

Abstract
The amide proton exchange rates in various lanthanide(III) DOTA-tetraamide complexes were investigated by CEST as a function of variable chemical structures and charges on the amide substituents. Comparisons were made between YbDOTA-(gly)4− (Yb-1), YbDOTA-(NHCH2PO3)45− (Yb-2), and YbDOTA-(NHCH2PO3Et2)43+ (Yb-3). The general shapes of the CEST versus pH profiles were similar for the three complexes but they showed maximum CEST intensities at different pH values, pH 8.3, 8.8 and 6.9 for Yb-1, Yb-2 and Yb-3, respectively. This indicates that a more negatively charged substituent on the amide helps stabilize the partial positive charge on the amide nitrogen and consequently more base is required to catalyze proton exchange. The chemical shifts of the −NH protons in Yb-1 and Yb-2 were similar (−17 ppm) while the −NH proton in Yb-3 was at −13 ppm. This shows that crystal field produced by the amide oxygen donor atoms in Yb-3 is substantially weaker than that in the other two complexes. In an effort to expand the useful range of pH values that might be measured using these complexes as CEST agents, the shapes of the CEST versus pH curves were also determined for two thulium(III) complexes with much larger hyperfine shifted −NH proton resonances. The ratio of CEST from −NH exchange in Tm-1 compared to CEST from −NH exchange in Tm-3 was found to be linear over an extended pH range, from 6.3 to 7.4. This demonstrates a potential advantage of using mixtures of lanthanide(III) DOTA-tetraamides for mapping tissue pH by use of ratiometric CEST imaging.
Keywords: MRI, contrast agents, pH-responsive agents, paramagnetic agents, Chemical Exchange Saturation Transfer (CEST) agents, amide proton exchange, ratiometric analysis
Introduction
Chemical exchange saturation transfer (CEST), first demonstrated by Wolff and Balaban in 1989, is an image contrast mechanism based on chemical exchange of saturated spins (1,2). CEST contrast is achieved by applying a frequency-selective presaturation pulse at the resonant frequency of a labile solute proton which is then chemically transferred into another pool of spins. In most cases, the second pool corresponds to bulk water protons so turning on CEST contrast produces a decrease in the bulk water signal intensity and a consequently darkening of an MR image. Numerous endogenous and exogenous diamagnetic CEST agents (DIACEST) have been reported but here the chemical shift differences between the two exchanging pools makes selective excitation somewhat problematical (3). One solution to this limitation is to use an exogenous paramagnetic lanthanide complexes containing hyperfine-shifted exchange sites (PARACEST) (4–6) so that selective irradiation can be performed without significant off-resonance saturation of bulk water protons.
One of the most important determinants of CEST is the proton or water molecule exchange rate (kex). The residence lifetime (τM = 1/kex) is defined as the time a labile proton or molecule remains at one site before it exchanges into the other. τM cannot be too short because it becomes difficult to fully saturate a spin pool before exchange occurs nor should it be so long that magnetization returns back to equilibrium via spin-lattice relaxation (T1) before exchange occurs. These scenarios limit the observable CEST effect. A second factor is that τM must be in the slow-to-intermediate exchange regime as defined as:
| (1) |
where Δω is the frequency difference between the exchanging protons or water molecules. It has also been shown from basic Bloch theory that the optimal residence lifetime also depends on the power of the pulse (B1) used to excite the exchanging protons or water molecules (7,8),
| (2) |
This indicates that at low B1 (may be limited to 50–100 Hz for clinical applications), the optimal exchange lifetime for CEST can be estimated to be about 1–3 msec. To date, the bound water lifetimes in typical europium complex is in the 100–400 μs range so further work must be done to slow the rate of water exchange to make them practical.
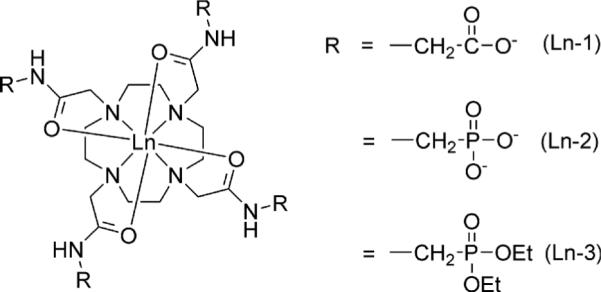
It has also been shown that the rates of proton exchange between a labile −NH proton and bulk water is relatively slow (ms range) and generally increases with increasing pH (9,10). This makes such exchange sites potentially useful as pH sensors. For example, the four equivalent amide protons of LnDOTA-(gly)4− have been previously shown (11,12) to have a pH-sensitive CEST signal in the range of interest for physiological pH measurements. In this work, we explored the effect of modifying the properties of the amide side chains of other LnDOTA-tetraamide complexes on the amide proton lifetimes as determined by CEST. High resolution NMR and CEST measurements were performed on Yb(III) and Tm(III) complexes of DOTA-(gly)4−, DOTA-(NHCH2PO3)45− and DOTA-(NHCH2PO3R2)43+ (see Chart 1) to compare the effects of chemical variation in amide substituents on the pH sensitivity of CEST from −NH exchange in these molecules. Our long term goal is to identify mixtures of agents with highly shifted −NH protons that can be selectively activated even in the presence of a broad water signal typical of that seen in vivo for ratiometric imaging of tissue pH.
Results and Discussion
High resolution 1H NMR spectra (not shown) of the three Yb(III) complexes showed typical hyperfine shifted resonances characteristic of other Yb(III) complexes of this type (11,13). The most easily assigned resonance is the most highly downfield shifted macrocyclic axial proton, usually referred to as the H4 resonance. This resonance appeared at 92 and 88 ppm in the NMR spectra of Yb-1 and Yb-2, respectively, and at 77 ppm in the spectrum of Yb-3. This result indicates that the two negatively charged ligand side-chains provide similar ligand fields for the Yb(III) ion while the phosphonate diethyl ester ligand (no charge) provides a considerably weaker ligand field (14). This same pattern was seen in chemical shift comparisons of the amide −NH protons. These were found near −17 ppm in NMR spectra of Yb-1 and Yb-2, and −13 ppm in the spectrum of Yb-3. Here again, the smallest chemical shift was observed for the uncharged DOTA-(NHCH2PO3Et2)4 ligand, consistent with a weaker ligand field.
Application of a frequency-selective, presaturation pulse on the −NH resonance in each of these samples results in a reduction in the bulk water signal, a characteristic CEST response that results from proton exchange between the −NH proton and bulk water. The magnitude of this CEST effect is, of course, pH and temperature dependent. Figure 2 shows the percent decrease in water intensity, [1-(Ms/Mo)], as a function of pH for the three Yb(III) complexes. All three curves have a similar shape, with amide CEST increasing with pH up to a maximum value then decreasing with a further increase in pH. This behavior is characteristic of base-catalyzed −NH proton exchange which reaches an optimal exchange rate at the apex of the CEST versus pH curves for the three complexes, at pH 8.3 for Yb-1, pH 8.8 for Yb-2 and pH 6.9 for Yb-3. These differences in pH where maximum CEST occurs clearly reflect differences in amide proton exchange rates in the three molecules and likely also differences in their pKa's (unknown). The potentiometric titrations of DOTA-(gly)4 (ligand 1) have been reported (15,16) but no high protonation steps attributable to amide protons were detected up to pH 11.7. Coordination of the amide oxygen to the Yb(III) results in sharing of the amide nitrogen lone pair electrons with the carbonyl carbon and this, in turn, increases the acidity of the amide proton and makes base-catalyzed proton exchange more efficient (17,18). The presence of an additional charged substituent near the amide nitrogen can either stabilize or destabilize this electron delocalization and thereby affect proton exchange as well (19). One would predict then that negatively charged substituents on the amide groups of Yb-1 and Yb-2 should make it more difficult to remove a proton from the amide and subsequently require a higher base concentration to initiate proton exchange. This is observed experimentally. The more highly charged substituent, −CH2-PO32− (Yb-2) makes removal of the amide proton more difficult compared to the −CH2-CO2− substitutent (Yb-1) so the apex of its curve lies at more basic pH. Conversely, the uncharged substituent, −CH2-PO(OEt)2 (Yb-3) allows for easier proton removal as evidenced by the shift in the apex of the curve for Yb-3 to lower pH (Figure 2). These results demonstrate that it should be relatively easy to shift the amide CEST curve to almost any desired pH range by altering the structure of the amide substituent.
Figure 2.

Theory also predicts that the optimal proton lifetime (τM) required to achieve maximal CEST depends upon the strength of the applied field (B1): (7)
| (2) |
Thus, for a B1 of 900 Hz, the optimal residence lifetime of a proton should occur near 0.18 ms while for a B1 of 300 Hz, the optimal lifetime would be longer, 0.53 ms. To test this experimentally, CEST versus pH profiles were recorded for Yb-1 and Yb-3 at four different applied B1 values (Figure 3). For both agents, it can be seen that the apex of the CEST versus pH curves vary with B1 as predicted. Reasonable agreement (±0.1 ms) between the theoretical and experimental τNH values was observed for both agents at all four power levels. These data demonstrate that the shape and position of the CEST versus pH curves is determined by the applied B1.
Figure 3.

A more interesting and perhaps less obvious difference between the CEST versus pH curves for Yb-1 and Yb-3 is that CEST increases with B1 (as expected) at or near the pH optima for Yb-1 but does not increase nearly as much with increasing B1 for Yb-3. The reason for this apparent anomaly is that amide proton exchange rates are so much faster for Yb-3 than Yb-1 at all pH values. This is apparent from the observation that one must go to much lower pH values to slow down −NH proton exchange enough for CEST to disappear for Yb-3 than for Yb-1. In comparison, the −NH exchange lifetime for Yb-3 at pH 7.5 is 0.11 ms while the −NH exchange lifetime for Yb-1 at this same pH is 3.3 ms, a 30-fold difference in exchange rates. Given that proton exchange is faster for Yb-3 at any given pH value, this leads to more rapid convergence of the exchanging −NH proton resonance with the bulk water resonance with an applied field, B1. Hence, the CEST versus pH curves for Yb-1 continue to increase with B1 near the optimal pH region while CEST for Yb-3 reaches a near plateau with increasing B1.
There is great interest in developing MRI sensors for mapping whole body tissue pH to distinguish normal from diseased tissues. In particular, images that report the extracellular pH of tumors would be of great diagnostic value (20). A CEST versus pH curve that covers a range of pH values from 7.4 to below 6 would be ideal for this purpose. While the CEST curves for Yb-1 and Yb-2 have optimal pH somewhat too high (Fig. 2), Yb-3 has an effective pH range between 6 and 7, depending upon applied B1 (Fig. 3). Nevertheless, one would not be able to distinguish between a tissue pH above 7.4 versus one below about pH 6.6 so using Yb-3 alone would not be optimal. One way of overcoming this limitation is by combining Yb-3 with another agent that has a different chemical shift and is more sensitive to changes in pH over a more basic pH range, such as Yb-1 or Yb-2. Yb-1 was chosen for further experimentation because of its steeper CEST versus pH curve (Fig. 2). Combining Yb-1 and Yb-3 together should not only increase the effective pH range but it also offers the possibility of ratiometric imaging to obtain a concentration-independent measure of pH (9).
The relatively small chemical shift dispersion of the amide protons in these Yb(III) complexes compared to the bulk water signal would be even more problematical in vivo because of the underlying magnetization transfer (MT) signal arising from water tightly associated with proteins and other large macromolecules (17,21,22). One solution might be to shift the amide proton resonance frequencies even further away from the bulk water signal by choosing a different lanthanide ion. Tm(III) is perhaps the best choice for this purpose as this paramagnetic ion is known to induce much larger chemical shifts in all ligand protons compared to Yb(III) without introducing too much line broadening (11). For comparison, the chemical shifts of the −NH protons in the 1H NMR spectra of Tm-1 and Tm-3 are at −51 and −40 ppm, respectively, about 3-fold larger than the shifts in the corresponding Yb(III) complexes.
CEST versus pH curves were collected for solutions of Tm-1 and Tm-3 at 310 K (Fig. 4). Although the general shapes of these curves were qualitatively similar to the corresponding Yb-1 and Yb-3 complexes (compare Figs. 2 and 4), the maximum in the CEST versus pH curve for Tm-1 is shifted slightly toward lower pH while the maximum in the curve for Tm-3 is shifted toward higher pH. The fact that these two compounds differ in their pH sensitivity suggests that one should be able to use a mixture of the two complexes and ratiometric imaging to obtain a concentration independent measure of pH. To examine this possibility, CEST spectra of equimolar mixture of Tm-1 and Tm-3 as a function of pH are shown in Figure 5. Again, the general shape of the CEST versus pH curves for each individual agent were similar to those shown for separate agents in Fig. 4 but the total CEST intensities of the mixture was somewhat smaller than that observed in the single agent samples because the higher total concentration of Tm(III) (40 mM) shortened the T1 of the bulk solvent protons. In this case, the T1 of bulk water for 20 mM solutions of Tm-1 or Tm-3 at 310K averaged about 0.5 s while the T1 of water containing the mixture (total Tm = 40 mM) was 0.25 s.
Figure 4.

Figure 5.

A ratiometric analysis described previously by Ward and Balaban for diamagnetic molecules was used to obtain a concentration-independent measure of pH (9). Here, the ratio of CEST from the two unique chemical exchange sites (site 1 and site 2) are measured and plotted as follows.
| (3) |
Equation 3 illustrates that the CEST ratio, [(Mo − Ms)Site1/MsSite1]/[(Mo − Ms)Site2/MsSite2], is proportional to the ratio of the agent concentrations, the number of exchangeable protons at each site (4 in this case), and the proton exchange rates at the two sites, kex. This equation also assumes that both exchange sites are fully saturated after application of a long presaturation pulse. Since both rates are pH dependent, a plot of the CEST ratio as a function of pH yields a standard curve that is independent of [Agent] and n. This is important because the local concentration of the agent in tissue is unknown in most cases and this is usually required for most pH measurements in vivo. Such ratiometric CEST measurements on other paramagnetic systems have been shown to provide a concentration-independent measure of pH by several authors (9,11,12,23,24) and, more recently, Wu, et al. (25).
The ratiometric curve reported in Fig. 6 was generated by collecting two CEST spectra and taking the ratio of water intensities, Tm-3 (pre-saturation at −40 ppm)/ Tm-1 (pre-saturation at −51 ppm) as a function of solution pH. The resulting ratiometric plot covers a broader pH range (pH 6.4 – 7.4) than seen previously for any of the individual agents. This extended pH range could prove important in imaging the extracellular pH of individual tumors or in differentiating between infracted or poorly perfused tissues from well-perfused tissues using CEST-MRI. Of course, calibration curves such as the one shown in Figure 6 will depend on factors such as B1, field strength, and concentration so separate calibration curves should be generated for each particular experimental protocol. Although we do not demonstrate here that this ratiometric plot is indeed independent of agent concentration as theory predicts, we have shown recently that this same ratiometric method works well for a pH-dependent PARACEST agent over a wide concentration range (25).
Figure 6.

For practical applications, Tm-1 and Tm-3 can not be assumed to distribute identically in tissues due to the differences in their charge and molecular size. This limitation could potentially be overcome by encapsulating both the agents in a single nano-carrier such as a liposome. A liposome filled with two types of Tm(III) CEST agents would not only insure that an identical amount of each agent would occupy the same tissue space, but such a system could potentially increase the CEST sensitivity of such a pH sensor by increasing the local agent concentration at the site of interest. Of course, proton exchange rates may also be slower due to the additional liposomal bilayer barrier so this may be a tradeoff. The approach taken here using two Tm(III) complexes also has some potential advantages over the pH-sensitive YbDOTAM dendrimers reported previously (24), especially for ratiometric imaging. The two Tm(III) complexes studied here have the advantage of having a larger chemical shift difference between the two amide protons compared to the different Yb(III) dendrimers and the −NH exchange sites in the Tm(III) complexes are shifted further away from the bulk water frequency so the potential interference with the tissue MT signal is further minimized.
Conclusions
Three lanthanide-based PARACEST agents bearing different charges on the amide substituent were reported in this study. The differences in the electrostatic properties of the appended amide group altered both the −NH exchange rates and resonance frequencies of the amide protons. Consequently, this affects the pH sensitivity range of the amide proton saturation transfer to bulk water. It was shown that a shift in the apex of a CEST versus pH curve correlated with the ability of the substituent to stabilize the negative charge on the deprotonated form of the amide. A most highly negative substituent (−CH2-PO32−) destabilizes this charge and this results in a shift in the apex to a more basic pH value (pH 8.8) while the neutral amide substituent (−CH2-PO(OEt)2) shifted the apex of the CEST versus pH curve toward a lower pH value (pH 6.9). These observations led to further studies of agent mixtures, each having a different amide proton chemical shift and pH-responsive regions to create a pH sensor that covers a broader pH range required for many clinical applications. This study could provide an avenue to further explore the potential of amide proton exchange by fine-tuning the properties of the amide side-arm.
Experimental
The synthesis of DOTA-(NHCH2PO3R2)4, DOTA-(NHCH2PO3)48− and DOTA-(gly)44− was performed using a previously reported method (11,13,26).
NMR spectroscopy
NMR samples for CEST studies were prepared by dissolving an agent in H2O (400 μL) at a concentration of 100 mM. The pH was adjusted by addition of either lithium hydroxide monohydrate or p-toluenesulfonic acid monohydrate to avoid dilution.
CEST measurements
All CEST spectra were recorded on a Bruker Avance III 400 spectrometer at 25°C (for Yb complexes) and 37°C (for Tm complexes) by application of a 4 second frequency-selective presaturation pulse over a range of frequencies followed by a single observe pulse to measure the residual water signal. Two signal averages were collected at each presaturation frequency. Prior to collection of the full CEST spectra, single frequency CEST intensity measurements showed that 4 seconds was sufficient to reach full saturation of each exchanging −NH proton. The bulk water signal intensity, Ms/Mo, is plotted as a function of saturation frequency and is referred to as the Z-spectrum or recently, CEST spectrum. In this experiment, the sample was irradiated with 4 different presaturation pulses (B1) (21.2, 16.5, 11.8 or 7.0 μT) at a 4-second duration over the range of ±100 ppm saturation frequencies (saturation offset). The CEST effect was determined by taking the bulk water signal intensity from the CEST spectrum at the resonance frequency of the exchanging proton (on-resonance) and at the same offset frequency but on the opposite side with respect to the bulk water signal intensity (off- resonance). The bulk water signal was set to 0 ppm. This method takes into account the direct saturation effects of the bulk water signal.
Fitting CEST spectra to the Bloch equations modified for exchange
The resulting CEST spectra were fitted to the Bloch equations for a three site exchange pool model (bulk water, water coordinated with the Ln3+, and the amide proton) using a MATLAB™ program (27). The T1 of the bulk water proton was measured using the inversion recovery method using a Bruker Avance spectrometer operating at 400.13 MHz, while T2 was estimated by taking the full width at half height of the bulk water proton peak. The following parameters were also included in the fitting program: presaturation pulse (B1) in Hz, magnetic field (B0), presaturation time, T1 and T2 of bulk water, and proton concentrations and resonance frequencies of bulk water, bound water and amide. The residence lifetime (τM) of the amide protons was determined by averaging the fits of several CEST spectra collected at at least four different B1 values (900, 700, 500, 300 Hz or 21.2, 16.5, 11.8 or 7.0 μT, respectively) and subsequently converted to amide proton exchange rates (kex = 1/τM).
Figure 1.
ACKNOWLEDGMENTS
Financial support from the National Institutes of Health (CA115531, RR02584, and EB004582) and the Robert A. Welch Foundation (AT-584) is gratefully acknowledged.
References
- 1.Forsen S, Hoffman RA. Study of Moderately Rapid Chemical Exchange Reactions by Means of Nuclear Magnetic Double Resonance. J. Chem. Phys. 1963;39:2892–2901. [Google Scholar]
- 2.Wolff SD, Balaban RS. Magnetization Transfer Contrast (MTC) and Tissue Water Proton Relaxation in Vivo. Magn. Reson. Med. 1989;10:135–144. doi: 10.1002/mrm.1910100113. [DOI] [PubMed] [Google Scholar]
- 3.Zhou JY, van Zijl PCM. Chemical exchange saturation transfer imaging and spectroscopy. Prog. Nucl. Magn. Reson. Spectrosc. 2006;48:109–136. [Google Scholar]
- 4.Aime S, Barge A, Botta M, De Sousa AS, Parker D. Direct MMR spectroscopic observation of a lanthanide-coordinated water molecule whose exchange rate is dependent on the conformation of the complexes. Angew. Chem. Int. Ed. 1998;37:2673–2675. doi: 10.1002/(SICI)1521-3773(19981016)37:19<2673::AID-ANIE2673>3.0.CO;2-#. [DOI] [PubMed] [Google Scholar]
- 5.Zhang SR, Winter P, Wu KC, Sherry AD. A novel europium(III)-based MRI contrast agent. J. Am. Chem. Soc. 2001;123:1517–1518. doi: 10.1021/ja005820q. [DOI] [PubMed] [Google Scholar]
- 6.Aime S, Delli Castelli D, Terreno E. Novel pH-reporter MRI contrast agents. Angew. Chem. Int. Ed. 2002;41:4334–4336. doi: 10.1002/1521-3773(20021115)41:22<4334::AID-ANIE4334>3.0.CO;2-1. [DOI] [PubMed] [Google Scholar]
- 7.Zhang SR, Merritt M, Woessner DE, Lenkinski RE, Sherry AD. PARACEST agents: Modulating MRI contrast via water proton exchange. Acc. Chem. Res. 2003;36:783–790. doi: 10.1021/ar020228m. [DOI] [PubMed] [Google Scholar]
- 8.Woods M, Donald EWC, Sherry AD. Paramagnetic lanthanide complexes as PARACEST agents for medical imaging. Chem. Soc. Rev. 2006;35:500–511. doi: 10.1039/b509907m. [DOI] [PMC free article] [PubMed] [Google Scholar]
- 9.Ward KM, Balaban RS. Determination of pH using water protons and chemical exchange dependent saturation transfer (CEST) Magn. Reson. Med. 2000;44:799–802. doi: 10.1002/1522-2594(200011)44:5<799::aid-mrm18>3.0.co;2-s. [DOI] [PubMed] [Google Scholar]
- 10.Guivel-Scharen V, Sinnwell T, Wolff SD, Balaban RS. Detection of proton chemical exchange between metabolites and water in biological tissues. J. Magn. Reson. 1998;133:36–45. doi: 10.1006/jmre.1998.1440. [DOI] [PubMed] [Google Scholar]
- 11.Aime S, Barge A, Castelli DD, Fedeli F, Mortillaro A, Nielsen FU, Terreno E. Paramagnetic lanthanide(III) complexes as pH-sensitive chemical exchange saturation transfer (CEST) contrast agents for MRI applications. Magn. Reson. Med. 2002;47:639–648. doi: 10.1002/mrm.10106. [DOI] [PubMed] [Google Scholar]
- 12.Terreno E, Castelli DD, Cravotto G, Milone L, Aime S. Ln(III)-DOTAMGIy complexes: A versatile series to assess the determinants of the efficacy of paramagnetic chemical exchange saturation transfer agents for magnetic resonance imaging applications. Invest. Radiol. 2004;39:235–243. doi: 10.1097/01.rli.0000116607.26372.d0. [DOI] [PubMed] [Google Scholar]
- 13.Kalman FK, Woods M, Caravan P, Jurek P, Spiller M, Tircso G, Kiraly R, Brucher E, Sherry AD. Potentiometric and relaxometric properties of a gadolinium-based MRI contrast agent for sensing tissue pH. Inorg. Chem. 2007;46:5260–5270. doi: 10.1021/ic0702926. [DOI] [PMC free article] [PubMed] [Google Scholar]
- 14.Dickins RS, Parker D, Bruce JI, Tozer DJ. Correlation of optical and NMR spectral information with coordination variation for axially symmetric macrocyclic Eu(III) and Yb(III) complexes: axial donor polarisability determines ligand field and cation donor preference. Dalton Trans. 2003:1264–1271. [Google Scholar]
- 15.Baranyai Z, Banyai I, Brucher E, Kiraly R, Terreno E. Kinetics of the formation of [Ln(DOTAM)](3+) complexes. European Journal of Inorganic Chemistry. 2007:3639–3645. [Google Scholar]
- 16.Baranyai Z, Brucher E, Ivanyi T, Kiraly R, Lazar I, Zekany L. Complexation properties of N,N', N' ', N' ' '-[1,4,7,10-tetraazacyclododecane-1,4,7,10-tetrayltetrakis(1-oxoethane-2,1-diyl)]tetrakis[glycine] (H(4)dotagl). Equilibrium, kinetic, and relaxation behavior of the lanthanide(III) complexes. Helvetica Chimica Acta. 2005;88:604–617. [Google Scholar]
- 17.Liepinsh E, Otting G. Proton exchange rates from amino acid side chains - Implications for image contrast. Magn. Reson. Med. 1996;35:30–42. doi: 10.1002/mrm.1910350106. [DOI] [PubMed] [Google Scholar]
- 18.Englande SW, Downer NW, Teitelba H. Hydrogen-Exchange. Annu. Rev. Biochem. 1972;41:903–924. doi: 10.1146/annurev.bi.41.070172.004351. [DOI] [PubMed] [Google Scholar]
- 19.Sheinblatt M. Nuclear Magnetic Resonance Study of Protolysis Kinetics of Peptide Hydrogens of Triglycine. J. Am. Chem. Soc. 1966;88:2123–2126. doi: 10.1021/ja00962a007. [DOI] [PubMed] [Google Scholar]
- 20.Gatenby RA, Gawlinski ET, Gmitro AF, Kaylor B, Gillies RJ. Acid-mediated tumor invasion: a multidisciplinary study. Cancer Res. 2006;66:5216–5223. doi: 10.1158/0008-5472.CAN-05-4193. [DOI] [PubMed] [Google Scholar]
- 21.Henkelman RM, Stanisz GJ, Graham SJ. Magnetization transfer in MRI: a review. NMR Biomed. 2001;14:57–64. doi: 10.1002/nbm.683. [DOI] [PubMed] [Google Scholar]
- 22.Eng J, Ceckler TL, Balaban RS. Quantitative H-1 Magnetization Transfer Imaging In vivo. Magn. Reson. Med. 1991;17:304–314. doi: 10.1002/mrm.1910170203. [DOI] [PubMed] [Google Scholar]
- 23.Ali MM, Yoo B, Pagel MD. Tracking the Relative In Vivo Pharmacokinetics of Nanoparticles with PARACEST MRI. Mol. Pharm. 2009;6:1409–1416. doi: 10.1021/mp900040u. [DOI] [PMC free article] [PubMed] [Google Scholar]
- 24.Pikkemaat JA, Wegh RT, Lamerichs R, van de Molengraaf RA, Langereis S, Burdinski D, Raymond AYF, Janssen HM, de Waal BFM, Willard NP, Meijer EW, Grull H. Dendritic PARACEST contrast agents for magnetic resonance imaging. Contrast Media Mol. Imaging. 2007;2:229–239. doi: 10.1002/cmmi.149. [DOI] [PubMed] [Google Scholar]
- 25.Wu YK, Soesbe TC, Kiefer GE, Zhao PY, Sherry AD. A Responsive Europium(III) Chelate That Provides a Direct Readout of pH by MRI. J. Am. Chem. Soc. 2010;132:14002–14003. doi: 10.1021/ja106018n. [DOI] [PMC free article] [PubMed] [Google Scholar]
- 26.Ali MM, Woods M, Caravan P, Opina ACL, Spiller M, Fettinger JC, Sherry AD. Synthesis and relaxometric studies of a dendrimer-based pH-responsive MRI contrast agent. Chemistry-a European Journal. 2008;14:7250–7258. doi: 10.1002/chem.200800402. [DOI] [PMC free article] [PubMed] [Google Scholar]
- 27.Woessner DE, Zhang SR, Merritt ME, Sherry AD. Numerical solution of the Bloch equations provides insights into the optimum design of PARACEST agents for MRI. Magn. Reson. Med. 2005;53:790–799. doi: 10.1002/mrm.20408. [DOI] [PubMed] [Google Scholar]