

Abstract
The genetic structure of 65 chicken populations was studied using 29 SSR loci. Six main clusters which corresponded to geographical origins and histories were identified: Brown Egg Layers, predominantly Broilers, native Chinese breeds or breeds with recent Asian origin, predominantly breeds of European derivation, a small cluster containing populations with No Common-History (NCH), and populations that had breeding history with White Leghorn. Another group of populations that shared their genome with several clusters was defined as “Multi-clusters”. Gallus gallus gallus (Multi-clusters), one of the subspecies of the Red Jungle Fowl, which was previously suggested to be one of the ancestors of the domesticated chicken, has almost no sharing with European and White Egg layer populations. In a further sub-clustering of the populations, discrimination between all the 65 populations was possible, and relations between them were suggested. The genetic variation between populations was found to account for about 34% of the total genetic variation, 11% between clusters and 23% between populations within clusters. The suggested clusters may assist in future studies on genetic aspects of the chicken gene pool.
Keywords: chicken, genetic diversity, STRUCTURE, biodiversity, SSR
Introduction
Traditional methods of clustering individuals and populations such as phylogenetic trees are based mainly on genetic distances. Recently, several studies have clustered individuals and populations of different organisms using STRUCTURE software, which uses Bayesian type clustering techniques (Pritchard et al. 2000, Rosenberg et al. 2001; 2002, Parker et al. 2004). Rosenberg et al. (2001) used genotypes of 27 SSR loci to assign 600 chickens originating in 20 populations to their original populations using STRUCTURE software; they reported on 98% success rate. They showed that when 12-15 highly polymorphic SSR loci and 15-20 individuals from each of 20 breeds were used, the clustering success was at least 90%. A gradual increase in the number of clusters in the analysis gives a perspective which can be interpreted as a reflection of the genetic relations between the populations (Hillel et al. 2007).
The chicken is an important livestock species since it produces a large part of human food consumption and also being used as a model organism. In the recent era many chicken breeds and lines were diminished, with many breeds in danger of extinction (Blackburn 2006). This decline in the genetic resources of chicken around the globe may limit flexibility of future breeding and may jeopardize unique genetic features. Thus it is important to take steps to conserve genetic diversity within the species. For that purpose, deeper insight into genetic diversity and its stratification among chicken populations around the world is needed. In the current study we characterized the genetic diversity among 65 chicken populations from several geographical regions and with different breeding histories. Previously, biodiversity studies based on individual genotypes of chickens have been reported on phylogenic relationships among several local populations, commercial breeds or wild populations (Twito et al. 2007; Cuc et al. 2006; Chen et al. 2008, Muchadeyi et al. 2007). Unlike the current study, which is based on genotypes of individual birds, a biodiversity study on 52 populations, which partly overlaps with the set of the 65 populations used in the current study, has been reported by Hillel et al. (2003) using DNA pools of the populations.
In the current study we estimated the stratification of a wide range of chicken populations from several continents and management histories. This study adds the genetic relation among populations to our previous study on genetic diversity within these populations (Granevitze et al. 2007). Additionally, we suggest a procedure which makes it possible to use STRUCTURE on large datasets with a reasonable repeatability.
Materials and methods
Chicken populations
A list of the 65 chicken populations under study is shown in Table 1, and their detailed description is given in Granevitze et al. (2007). Briefly, the gene pool comprised one subspecies of the red junglefowl, Gallus gallus gallus, 12 native Chinese breeds, one population from Vietnam, one population from Malawi, 39 breeds of different phylogenetic origins collected in Europe (mainly in Germany), four brown egg layer lines, three of them being of commercial origin (A, C and D) and one experimental, two white egg layer lines, one commercial and one experimental, two broiler sire lines, and two broiler dam lines. An additional inbred line was used as a reference. We aimed to sample the same number of males and females from as many families as possible, for a total of approximately 30 chickens per population. In total, 2,000 individuals were analysed.
Table 1.
List of the 65 populations used in this study
| No. | Population | aCluster | Origin | Sampling country |
|---|---|---|---|---|
| 1 | C line (Inbred) | 5 | Inbred line | Czech Republic |
| 2 | Green legged Partidge | 5 | Mixed Type | Poland |
| 3 | Fayoumi | 5 | Mediterranean | France |
| 4 | Bedouin | 6 | Mediterranean | Israel |
| 5 | Jaerhoens | 6 | NW-European | Scandinavia |
| 6 | Line Sarcoma Susc | 6 | Mediterranean | Germany |
| 7 | Iceland landrace | 6 | NW-European | Scandinavia |
| 8 | Padova | 6 | Crested Fowl* | France |
| f9 | Sc. Ref. Population | 6 | Mediterranean | Scandinavia |
| 10 | White egg layer A | 6 | Mediterranean | commercial |
| 11 | Brakel | 4 | NW-European | Germany |
| 12 | Italiener Triesdorf | 4 | Mediterranean | Germany |
| 13 | Italiener rebh. | 4 | Mediterranean | Germany |
| 14 | Italiener schw. | 4 | Mediterranean | Germany |
| 15 | Lakenfelder | 4 | NW-European | Germany |
| 16 | Vorwerk | 4 | NW-European | Germany |
| 17 | Westf. Totleger | 4 | NW-European | Germany |
| 18 | Hamburger Lackh. | 4 | NW-European | Germany |
| 19 | Bergische Kraeher | 4 | NW-European | Germany |
| 20 | Brabanter | 4 | Crested Fowl* | Netherlands |
| 21 | Deutsche Sperber | 4 | NW-European | Germany |
| 22 | Friesenhuhner | 4 | NW-European | Germany |
| 23 | Hamburger Sprenkel | 4 | NW-European | Germany |
| 24 | Krueper | 4 | NW-European | Germany |
| 25 | Ost. Moewen | 4 | NW-European | Germany |
| 26 | Paduaner | 4 | Crested Fowl* | Germany |
| 27 | Ramelsloher | 4 | NW-European | Germany |
| 28 | Rheinlaender | 4 | NW-European | Germany |
| 29 | Schlotterkaemme | 4 | NW-European | Germany |
| 30 | Thuer. Barthuehner | 7 | NW-European | Germany |
| 31 | Kastilianer | 7 | Mediterranean | Germany |
| 32 | Malay | 7 | Game | Germany |
| 33 | Gallus gallus gallus | 7 | Wild | Thailand |
| 34 | Malawi | 7 | African | Malawi |
| 35 | Godollo Nhx | 7 | Half Asian | Hungary |
| 36 | Orlov | 7 | Mixed type | Germany |
| 37 | AB line, high | 1 | Half Asian | Netherlands |
| 38 | Brown egg layer A | 1 | Half Asian | commercial |
| 39 | Brown egg layer C | 1 | Half Asian | commercial |
| 40 | Brown egg layer D | 1 | Half Asian | commercial |
| 41 | Rhode Island Red | 1 | Half Asian | Germany |
| 42 | Broiler dam line A | 2 | Half Asian | commercial |
| 43 | Broiler dam line D | 2 | Half Asian | commercial |
| 44 | Broiler sire line A | 2 | Half Asian | commercial |
| 45 | Broiler sire line B | 2 | Half Asian | commercial |
| 46 | Tr. Naked Neck | 2 | Mixed Type | Hungary |
| 47 | Marans | 2 | Half Asian | France |
| 48 | Asil | 2 | Game | Germany |
| 49 | Sundheimer | 2 | Half Asian | Germany |
| 50 | New Hampshire | 2 | Half Asian | Germany |
| 51 | Luyuan | 3 | Asian | China |
| 52 | Xiaoshan | 3 | Asian | China |
| 53 | You | 3 | Asian | China |
| 54 | Cochin | 3 | Asian | Germany |
| 55 | Brahma | 3 | Asian | Germany |
| 56 | Chahua | 3 | Asian | China |
| 57 | Dagu | 3 | Asian | China |
| 58 | H'mong | 3 | Asian | Vietnam |
| 59 | Tibetan | 3 | Asian | China |
| 60 | Baier | 3 | Asian | China |
| 61 | Gushi | 3 | Asian | China |
| 62 | Dou | 3 | Asian | China |
| 63 | Langshan | 3 | Asian | China |
| 64 | Wugu | 3 | Asian | China |
| 65 | Xianju | 3 | Asian | China |
clusters that were created using Structure software: 1 - Brown Egg Layers, 2 – predominantly Broilers, 3 – native Chinese breeds or breeds with recent Chinese origin, 4 - predominantly breeds of European derivation, 5 - a small cluster contains populations with No Common-History (NCH), 6 - populations that had breeding history with White Leghorn including White Egg Layers, and 7 – multi-cluster (breeds share several clusters)
supposed origin is East Europe
Genotyping
A detailed description of the 29 SSR (Simple Sequence Repeat) markers used in this study is given in Granevitze et al. (2007). Briefly, a set of 29 SSR markers which are distributed on 15 chromosomes of the chicken genome with a minimum distance of 17cM, were typed individually by means of PCR. Genotyping was performed using ABI sequencers (Applied Biosystems, CA, USA) and semi-automated LICOR sequencer (LICOR Biotechnology Division, Lincoln, Nebraska, USA).
Analyses, based on STRUCTURE
We used the STRUCTURE software (Pritchard et al., 2000) to cluster the 2,000 chickens (from 65 populations) based on their genotypes at 29 SSR loci. In order to determine the number of iterations and burn-in periods needed for each solution, we created a curve of likelihood vs. number of iterations and burn-in steps (iterations and burn-in steps varied between 2,000 and 2.5 million steps; whole set at K=2). The curve reached saturation (plateau) at 10,000 iterations. We used 50,000 iterations after 20,000 burn-in cycles in all the analyses. We analyzed the data for two to six clusters (K) with 100 repeats for each K value. Further analysis was done by splitting the dataset into subsets according to the clustering obtained at K = 6.
The similarity coefficient (C) measure, quantifies the similarity between two solutions of STRUCTURE calculated for the same number of populations with same number of clusters (Rosenberg et al., 2002). We estimated similarity coefficients (C) between paired combinations among all 100 repeated solutions of STRUCTURE within each K-value. As was reported by Rosenberg et al. (2002) and seen in Figure 1, similarity coefficient (C) decreased rapidly for all K-values when similarities between solutions are slightly decreased. Pairs of solutions which had similarity coefficient above 0.95 presented similar clustering of populations with minor changes in membership coefficients; below this threshold clustering of populations were sometimes different. Thus, solutions with a pair-wise C ≥ 0.95 were considered to be identical. The most frequent solution among the 100 repeats was chosen as the most likely. Graphical display of this solution was done using DISTRUCT software (Rosenberg et al. 2004). Due to computational limitations it was not possible to calculate the similarity coefficient (C) between the 100 runs for K values larger than six.
Figure 1.
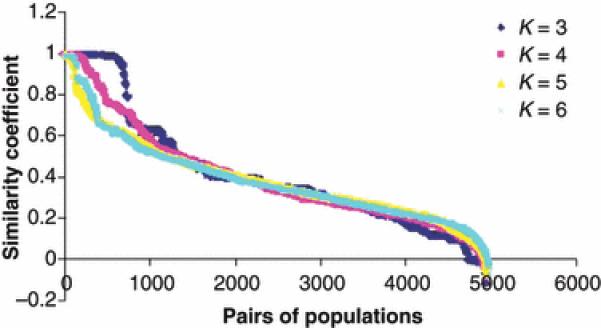
Distribution of the similarity coefficients (C). The distribution was constructed on 4950 pairs of solutions which were obtained from 100 runs of STRUCTURE on the full data set at K=3 to 6. Pairs of solutions are ordered according to their similarity coefficients’ (C) values in descending order.
Phylogenic and statistical software
Analysis of molecular variance (AMOVA) was performed using ARLEQUIN (http://anthro.unige.ch/arlequin). The significance of the variance components associated with the different levels of genetic structure was tested using a non-parametric permutation procedure with 16,000 permutations (Excoffier et al. 1992).
Results and Discussion
Genetic structures of the 65 chicken populations were analyzed by the software STRUCTURE, applying an increasing number of K-values (from two to six) to the total set of 2000 individuals (Figure 2). At K = 2, the obtained two clusters separated the Asian and the European populations. A number of populations had average membership coefficients (graphically displayed as stripes) in both clusters indicating admixture of both. The cluster which corresponded to the Asian population included 12 native Chinese breeds, one Vietnamese population, and two German fancy breeds Cochin(#54) and Brahma(#55). The latter two breeds are German fancy breeds, which are presumably of Chinese origin (Wandelt and Wolters, 1996). The other cluster contained populations primarily originating from Europe. For K=3, the admixed populations from K = 2 formed a new cluster (in red at level K=3 in Figure 2). When K was increased up to six, the populations of this third group were further split into two separate main clusters, and a group which combined admixed populations of all six clusters (multi-cluster populations). One of these two main clusters, contained the Asil(#48) breed, broilers and a few additional related populations, which have partly an Asian background (Figure 2, red stripes). The second main cluster contained the brown egg layers based on Rhode Island Red(#41) and related populations (Figure 2, green stripes). At K = 5, a group of populations with No Common History (NCH) split off, encompassing breeds with no obvious relationship between each other (Figure 2, blue stripes). At K = 6, the White Egg Layers separated from the European cluster (Figure 2, gray stripes). White egg layers were established in the USA and were based on a narrow genetic basis of a single breed, the single comb White Leghorn (Crawford et al. 1990). The frequencies of the most frequent solutions are presented in quadrangular parentheses for each K value (Figures 2, 3 and 4).
Figure 2.
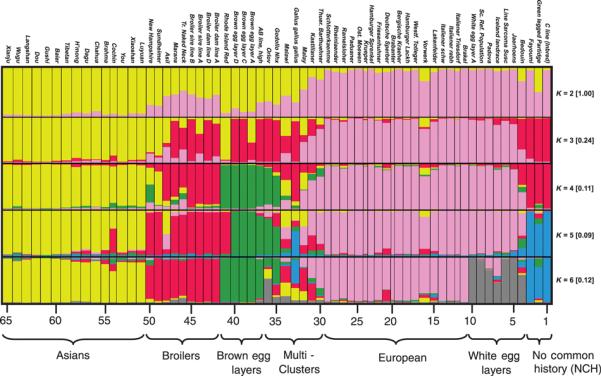
Cluster patterns of 2000 individuals from 65 populations obtained by STRUCTURE based on 29 SSR loci, for varying number of clusters from K=2 up to K=6. For K=6 the clusters are: 1 - Brown Egg Layers, 2 – predominantly Broilers, 3 - native Chinese breeds or breeds with recent Asian origin, 4 - predominantly breeds of European derivation, 5 – a small cluster contains populations with No Common-History (NCH), and 6 - populations that had breeding history with White Leghorn including white egg layers. Another group of populations that shared their genome with several clusters was defined as “Multi-clusters”. The frequency of the presented solution among the 100 repeated solutions presented in quadrangular parentheses for each K value.
Figure 3.
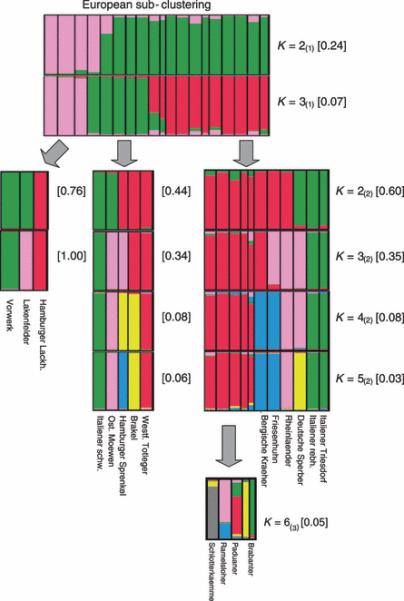
First sub-clustering (marked with a subscript “1” in brackets) of the European populations resulted in three sub-clusters at K=3. Each of these three clusters was further separately divided into additional clusters in a second sub-clustering (marked with a subscript “2” in brackets). The frequency of the presented solution among the 100 repeated solutions presented in quadrangular parentheses for each K value.
Figure 4.
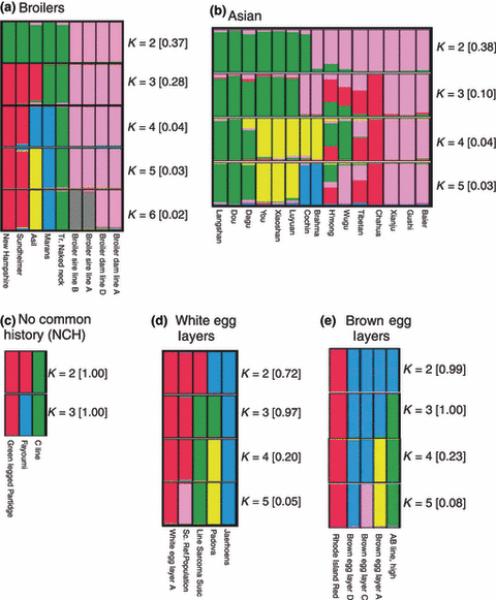
Sub-clustering of the non-European main clusters: (A) Broilers, (B) Asians, (C) No Common-History (NCH), (D) White Egg Layers, and (E) Brown egg layers. The frequency of the presented solution among the 100 repeated solutions presented in quadrangular parentheses for each K value.
The Multi-cluster group included the following seven populations: Thueringer Barthuehner(#30), Kastilianer(#31), Malay(#32), Gallus gallus gallus(#33), Malawi(#34), Godollo Nhx(#35) and Orlov(#36). It is rather non-trivial to point out historical information that could explain why these populations had membership in several clusters. Such an admixture can result either from being the descendant or the ancestor of several sources. The subspecies Gallus gallus gallus(#33) of the red jungle fowl is included among the admixed populations. Interestingly, while it is assigned to several clusters, it has almost no affinity with European and White Egg Layers’ clusters.
A detailed structuring description among populations and clusters are presented as a supplementary section to this article.
Sub-clustering
The six clusters of the 2000 birds from 65 populations were each further sub-clustered by STRUCTURE, similarly to the approach that was applied for human data by Rosenberg et al. (2002) and Jakobsson et al. (2008). Following this strategy, most of the populations reached their final own distinct clusters that contained a single population.
European sub-cluster
Analysis of the European cluster was performed in two subsequent steps of sub-clustering; the first sub-clustering is marked as the subscript “1” and the second sub-clustering is marked as subscript “2”. Except for Westfaelische Totleger(#17), the first sub-clustering gave consistent results for K equals 2(1) and 3(1) (Figure 3). One cluster (red strips) at K=3(1) represents breeds from the middle, east and south of Europe, while the other two clusters (pink and green strips; K=3(1)) represent breeds from the north and west of Europe (Figure 3). The source of the distinction between these breeds from the middle, east and south European sub-cluster is unclear. Previous knowledge suggests that Friesenhuehner(#22) were crossed with Spanish breeds in the Netherlands after the Spanish occupation in the 16th century, and it is considered to be one of the ancestors of the following breeds: Brakel(#11), Westfaelische Totleger(#17), Ostfriesische Moewen(#25) and Hamburger Sprenkel(#23) (Dürigen 1885). The Italiener Schwarz(#14) breed was developed by crossing the Spanish breed Minorka with Italiener rebhuhnfarbig (Schwarz 1996). This information may explain why these breeds clustered together at K=3(1).
Further analysis of the European sub-cluster (Figure 3, K=4(2), right cluster) shows separation of the Rheinlaender(#28)and Deutsche Sperber(#21) , and of the Friesenhuehner(#22) and Bergische Kraeher(#19) from the other breeds. Rheinlaender(#28) is a Middle-West-European breed that was genetically influenced by the North-French breed Le Mans (Montag 1983), and thus it is differentiated from the other European breeds. The Deutsche Sperber(#21) was crossed with Rheinlaender(#28) at the end of the 20th century (Kämmerling 2002). Clustering of the Friesenhuehner(#22) and Bergische Kraeher(#19) agrees with earlier reports that these populations were imported from Southeast-Europe to Middle-Europe, centuries ago (Wandelt and Wolters 1996, Six 2005a,b).
Asian and other stocks
In further analysis of the ‘broilers cluster’, the commercial lines were first separated from the non-commercial populations, and at K=6, the commercial broilers were split into dam and sire lines (Figure 4A). Broilers originated from White Cornish (based on White Asil) and White Rocks, a breed with Asiatic origin. Asil(#48), a game type with pearl comb, was separated early in the clustering process from the rest of the non-commercial broiler populations which possess a single comb. Although the New Hampshire(#50) population is based on Rhode Island Red(#41), which is a brown egg layer, it has common breeding history with Yellow Indian Game (based on Asil, Schwarz 1996) that may explain its clustering within this group.
The Asian sub-cluster, when further analysed, separated into two distinct clusters at K=2 (Figure 4B). When K was increased to 5, these groups were separated into three and two sub-clusters, respectively. Although Brahma(#55) and Cochin(#54) are breeds collected from German fanciers, they cluster with the Asian breeds because of their Chinese origin. At K=5, however, they make up their own group which may correspond to their isolation from native Chinese breeds. In addition, three multi-cluster populations were revealed within the main Asian cluster. The clustering of the Asian breeds at K=5 is in agreement with the clustering Chen et al. (2008) obtained for Chinese breeds.
The three populations in the No Common History cluster (NCH; Figure 4C) are from distinct genetic and geographical origins; to our best knowledge they didn't share any recent common ancestral origin. Thus, being clustered together indicates that these three populations are relatively far from all other populations in this study.
The White Egg Layers cluster (Figure 4D) contains only populations that have common breeding history with White Leghorns, which is the ancestor of the white egg layers. The Bedouin(#4) and Iceland landrace(#7) breeds which had low membership coefficients (0.61 and 0.44, respectively) with white egg layer cluster when the complete dataset was analyzed at K=6, were removed from the sub-clustering.
Sub-clustering the brown egg layers cluster (Figure 4E), first, differentiated the commercial egg layer lines from the Rhode Island Red(#41). The commercial lines were all separated clearly from each other when K values increased up to K=5.
In general, STRUCTURE differentiated well between populations. For example, STRUCTURE separated with minimal admixture even between commercial and experimental lines which managed as close populations for many generations. This verifies that STRUCTURE can efficiently utilize the SSR genotypic information for assessing population stratification. In the absence of such knowledge, the clustering result suggests previously unknown information about the genetic background of breeds.
Methodological Aspects - Repeatability of the results obtained by
STRUCTURE
In many cases STRUCTURE provides non identical results in repeated runs of the same data set. This is particularly true when analyzing a large number of populations with a moderate or large degree of complexity (Rosenberg et al. 2001, 2002; Parker et al. 2004). The algorithm may get stuck in a local optimum, returning results that do not reflect the true situation (Corander et al. 2004). This is due to the stochastic nature of the algorithm implemented in STRUCTURE. Similarity coefficient (C) can be used to assess the repeatability of runs on the same data set (Rosenberg et al. 2002). Parker et al. (2004) analyzed 414 dogs representing 85 pure breed populations, the similarity coefficients between runs of the same data were 0.84, 0.61 and 0.26 for 3, 4 and 5 clusters, respectively. Low similarity coefficients indicate low similarity between repeated runs of the same data set. Rosenberg et al. (2002) faced the same problem when analyzed a large human data set. In a preliminary study, when we increased the number of iterations up to 2.5 million (following the suggestion of the software authors), non-identical solutions have been observed in the repeated runs. In the current study we overcame this difficulty by taking the most common out of 100 solutions. We applied a procedure which adopts the most repeatable solution of STRUCTURE, using the similarity coefficient (C) (Rosenberg et al. 2002). The similarity coefficient was calculated for all possible 4950 pairs of 100 solutions generated by STRUCTURE for the same dataset. As was reported by Rosenberg et al. (2002) and seen in Figure 4, similarity coefficient (C) decreased rapidly when similarities between solutions are only slightly decreased. Thus, solutions with a pair wise C ≥ 0.95 were considered to be identical. These solutions were clustered into groups of identical solutions and the most frequent solution was chosen to be the most accurate. The consistency between most frequent solutions through subsequent K values is an indication that this is a satisfactory approach (Figures 1, 2 and 3).
AMOVA - between populations
Analysis of molecular variance (AMOVA) showed that the fraction of variance between breeds was about 34% (Table 2). This variation among chicken breeds is the highest reported for breeds of farm animals (MacHugh et al. 1998, Parker et al. 2004), and is very large in comparison with variation between human populations (approximately 12%; Li et al. 2008). High genetic diversity between breeds in farm animals is usually assumed to be due to barriers between breeds (Parker et al. 2004). In the current analysis we partitioned the variation into two components in a hierarchal manner: variation between clusters indicated by STRUCTURE software (Figure 2) and variation between breeds within these clusters. The results (Table 2) indicate that the variation between clusters is much lower (~11%) than the variation between breeds within clusters (~23%).
Table 2.
AMOVA based on 29 SSR loci of 65 chicken populations assigned into six clusters according to Structure analysis
| Source of variation | Percentage of variation |
|---|---|
| Among clusters | 11.16 |
| Among populations within clusters | 23.00 |
| Within populations | 65.84 |
| Total | 100 |
Supplementary Material
Acknowledgments
We wish to thank Helmut Lichtenberg for his creative computational support.
Footnotes
References
- Blackburn HD. The National Animal Germplasm Program: challenges and opportunities for poultry genetic resources. Poultry Science. 2006;85:210–215. doi: 10.1093/ps/85.2.210. [DOI] [PubMed] [Google Scholar]
- Chen G, Bao W, Shu J, Ji C, Wang M, Eding H, Muchadeyi F, Weigend S. Assessment of population structure and genetic diversity of 15 Chinese indigenous chicken breeds using microsatellite markers. Asian Australian Journal of Animal Science. 2008;21:331–339. [Google Scholar]
- Corander J, Waldmann P, Marttinen P, Sillanpaa MJ. BAPS 2: enhanced possibilities for the analysis of genetic population structure. Bioinformatic. 2004;20:2363–2369. doi: 10.1093/bioinformatics/bth250. [DOI] [PubMed] [Google Scholar]
- Crawford RD. Origin and history of poultry species. In: Crawford RD, editor. Poultry Breeding and Genetics. Elsevier; New York: 1990. pp. 1–41. [Google Scholar]
- Cuc NTK, Muchadeyi FC, Baulain U, Eding H, Weigend S, Wollny CBA. An Assessment of Genetic Diversity of Vietnamese H'mong Chickens. International Journal of Poultry Science. 2006;5:905–913. [Google Scholar]
- Dürigen B. Die Geflügelzucht. Verlag Paul Paray; Berlin: 1885. [Google Scholar]
- Excoffier L, Smouse P, Quattro J. Analysis of molecular variance inferred from metric distances among DNA haplotypes: Application to human mitochondrial DNA restriction data. Genetics. 1992;131:479–491. doi: 10.1093/genetics/131.2.479. [DOI] [PMC free article] [PubMed] [Google Scholar]
- Granevitze Z, Hillel J, Chen GH, Thi Kim Cuc N, Feldman M, Eding H, Weigend S. Genetic diversity within chicken populations from different continents and management histories. Animal Genetics. 2007;38:576–583. doi: 10.1111/j.1365-2052.2007.01650.x. [DOI] [PubMed] [Google Scholar]
- Hillel J, Granevitze Z, Twito T, Ben-Avraham D, Blum S, Lavi U, David L, Feldman MW, Cheng H, Weigend S. Microsatellites, SNPs and the draft sequence of the sex chromosomes, as information sources for the assessment of chicken biodiversity. World's Poultry Science Journal. 2007;63:33–45. [Google Scholar]
- Hillel J, Groenen MA, Tixier-Boichard M, Korol AB, David L, Kirzhner VM, Burke T, Barre-Dirie A, Crooijmans RP, Elo K, Feldman MW, Freidlin PJ, Mäki-Tanila A, Oortwijn M, Thomson P, Vignal A, Wimmers K, Weigend S. Biodiversity of 52 chicken populations assessed by microsatellite typing of DNA pools. Genetics Selection Evolution. 2003;35:533–357. doi: 10.1186/1297-9686-35-6-533. [DOI] [PMC free article] [PubMed] [Google Scholar]
- Jakobsson M, Scholz SW, Scheet P, Gibbs JR, VanLiere JM, Fung HC, Szpiech ZA, Degnan JH, Wang K, Guerreiro R, Bras JM, Schymick JC, Hernandez DG, Traynor BJ, Simon-Sanchez J, Matarin M, Britton A, van de Leemput J, Rafferty I, Bucan M, Cann HM, Hardy JA, Rosenberg NA, Singleton AB. Genotype, haplotype and copy-number variation in worldwide human populations. Nature. 2008;451:998–1003. doi: 10.1038/nature06742. [DOI] [PubMed] [Google Scholar]
- Kämmerling W. Deutsche Sperber: Raritäten auf Dauer Geflügel-Börse 16/2002, S. 2-3. Verlag Jürgens; Germering: 2002. [Google Scholar]
- Li JZ, Absher DM, Tang H, Southwick AM, Casto AM, Ramachandran S, Cann HM, Barsh GS, Feldman M, Cavalli-Sforza LL, Myers RM. Worldwide Human Relationships Inferred from Genome-Wide Patterns of Variation. Science. 2008;319:1100–1104. doi: 10.1126/science.1153717. [DOI] [PubMed] [Google Scholar]
- MacHugh DE, Loftus RT, Cunningham P, Bradley DG. Genetic structure of seven European cattle breeds assessed using 20 microsatellite markers. Animal Genetics. 1998;29:333–340. doi: 10.1046/j.1365-2052.1998.295330.x. [DOI] [PubMed] [Google Scholar]
- Montag F. 75 Jahre Sonderverein der Züchter des Rheinländer-Huhnes. Geflügel-Börse 9/1983, S. 2-6. Verlag Jürgens; Germering: 1983. [Google Scholar]
- Muchadeyi FC, Eding H, Wollny CB, Groeneveld E, Makuza SM, Shamseldin R, Simianer H, Weigend S. Absence of population substructuring in Zimbabwe chicken ecotypes inferred using microsatellite analysis. Animal Genetics. 2007;38:332–9. doi: 10.1111/j.1365-2052.2007.01606.x. [DOI] [PubMed] [Google Scholar]
- Parker HG, Kim LV, Sutter NB, Carlson S, Lorentzen TD, Malek TB, Johnson GS, DeFrance HB, Ostrander EA, Kruglyak L. Genetic structure of the purebred domestic dog. Science. 2004;304:1160–1164. doi: 10.1126/science.1097406. [DOI] [PubMed] [Google Scholar]
- Pritchard JK, Stephens M, Donnelly P. Inference of Population Structure Using Multilocus Genotype Data. Genetics. 2000;155:945–959. doi: 10.1093/genetics/155.2.945. [DOI] [PMC free article] [PubMed] [Google Scholar]
- Rosenberg NA. Distruct: a program for the graphical display of population structure. Molecular Ecology Notes. 2004;4:137–138. [Google Scholar]
- Rosenberg NA, Burke T, Elo K, Feldman MW, Freidlin PJ, Groenen MA, Hillel J, Maki-Tanila A, Tixier-Boichard M, Vignal A, Wimmers K, Weigend S. Empirical evaluation of genetic clustering methods using multilocus genotypes from 20 chicken breeds. Genetics. 2001;159:699–713. doi: 10.1093/genetics/159.2.699. [DOI] [PMC free article] [PubMed] [Google Scholar]
- Rosenberg NA, Pritchard JK, Weber JL, Cann HM, Kidd KK, Zhivotovsky LA, Feldman MW. The genetic structure of human populations. Science. 2002;298:2381–2385. doi: 10.1126/science.1078311. [DOI] [PubMed] [Google Scholar]
- Schwarz W. Der große Geflügelstandard in Farbe. Band 1: Hühner (Großrassen), Truthühner, Perlhühner. Verlag Oertel Spörer; Reutlingen: 1996. [Google Scholar]
- Six A. Wieder entdeckt: Bosnische Kräher. Geflügel-Börse 13/2005, S. 4-5. Verlag Jürgens; Germering: 2005a. [Google Scholar]
- Six A. Beobachtungen zum Türkischen Huhn. Geflügel-Börse 19/2005, S. 6. Verlag Jürgens; Germering: 2005b. [Google Scholar]
- Twito T, Weigend S, Blum S, Granevitze Z, Feldman MW, Perl-Treves R, Lavi U, Hillel J. Biodiversity of 20 chicken breeds assessed by SNPs located in gene regions. Cytogenetic Genome Research. 2007;117:319–326. doi: 10.1159/000103194. [DOI] [PubMed] [Google Scholar]
- Wandelt R, Wolters V. Handbuch der Hühnerrassen. 453 S. Verlag Wolters; Bottrop: 1996. [Google Scholar]
Associated Data
This section collects any data citations, data availability statements, or supplementary materials included in this article.