Abstract
This paper proposes a framework for detecting the suspected abnormal region of the bladder wall via magnetic resonance (MR) cystography. Volume based features are used. First, the bladder wall is divided into several layers, based on which a path from each voxel on the inner border to the outer border is found. By using the path length to measure the wall thickness and a bent rate term to measure the geometry property of the voxels on the inner border, the seed voxels representing the abnormalities on the inner border are determined. Then, by tracing the path from each seed, a weighted bent rate term is constructed to determine the suspected voxels, which are on the path and inside the bladder wall. All the suspected voxels are grouped together for the abnormal region. This work is significantly different from most of the previous computer aided bladder tumor detection reports on two aspects. First of all, the T1-weighted MR images are used which give better image contrast and texture information for the bladder wall, comparing with the computed tomography images. Secondly, while most previous reports detected the abnormalities and indicated them on the reconstructed three-dimensional bladder model by surface rendering, we further determine the possible region of the abnormality inside the bladder wall. This work aims at a non-invasive procedure for bladder tumor detection and abnormal region delineation, which has the potential for further clinical analysis such as the invasion depth of the tumor and virtual cystoscopy diagnosis. Five datasets including two patients and three volunteers were used to test the presented method, all the tumors were detected by the method, and the overlap rates of the regions delineated by the computer against the experts were measured. The results demonstrated the potential of the method for detecting bladder wall abnormal regions via MR cystography.
Index Terms: Bladder wall thickness, bent rate, weighted bent rate, tumor detection, MR cystography
I. Introduction
Bladder carcinoma has become the fifth leading cause of cancer-related deaths in the United States. The 5-year relative survival rate (the 5-year survival rate refers to the percentage of patients who live at least 5 years after their cancers are found, while the 5-year relative survival rate estimates the survival rate excluding causes of death not related to the disease of interest) of patients whose cancers are found in the third or fourth stage is below 50% [1]. In addition, bladder cancer is reported to have high recurrence rate after resection of the tumors (as high as 80% [2]). Therefore, developing an effective and non-invasive tool for detection of the bladder abnormalities and re-examination after the tumor resection is crucial for management of the deadly carcinoma. Fiberoptic cystoscopy is currently the most popular diagnostic and therapeutic tool. However, it is invasive, expensive and uncomfortable with limited field-of-view (FOV), and carries a risk of 5% to 10% rate of urinary tract infection. As an alternative and less invasive diagnostic tool, virtual cystoscopy is preferable which uses computed tomography (CT) and magnetic resonance imaging (MRI) to evaluate the entire bladder and provide qualitative parameters to the radiologists for diagnosis. So far, most previous reports only provided the reconstructed three-dimensional (3D) virtual bladder model. Little effort was devoted to detect suspected bladder abnormalities by computers in the virtual cystoscopy system. Conventional characteristic features, like curvedness and shape index, vary significantly from voxel to voxel [3], causing high false positive (FP) rate. Preliminary results show that the bladder wall thickness can be a biomarker for detection of the abnormalities [4~6]. The method in [5] generated promising results. The CT imaging procedure injects exogenous contrast agent into the bladder and makes the state of the bladder (full/empty) more controllable for constructing the atlas. However, the CT imaging is invasive and provides little information about the inner bladder wall region. Therefore, we prefer to utilize MRI for the clinical purpose. Because the bladder shape and wall thickness vary obviously among different subjects (volunteer/patient), the construction of the thickness atlas in [5] is not reasonable in the MRI-based analysis. Besides, all the above reports only used the 3D mesh (which is always generated from the segmented inner border of the bladder wall) to represent the bladder and indicate the abnormalities by rendering different colors on the 3D model. Generally, the 3D models provide no information inside the bladder wall. Most recent researches used the MRI to estimate the invasion depth of the bladder tumor [7]. However, it needs the expert to manually delineate the tumor region in advance.
In this paper, we introduce a non-invasive procedure to detect the bladder abnormalities and the abnormal regions inside the bladder wall via MR cystography. By considering the wall thickness and inner border geometry property, the seeds for the suspect abnormalities on the inner border are determined. Tracing from the seeds, volume-based features inside the bladder wall are explored to extract the whole abnormality region. The T1-weighted MR images are used due to its better image contrast among soft tissues (the bladder wall in this work), in addition to less concern on radiation and invasiveness [8, 9]. The reliablity of the MR virtual cystoscopy has been proved in [10]. This work inherits our previous automatic bladder wall segmentation work [11], and provides the potential for further estimation of the bladder tumor invasion depth and malignant staging.
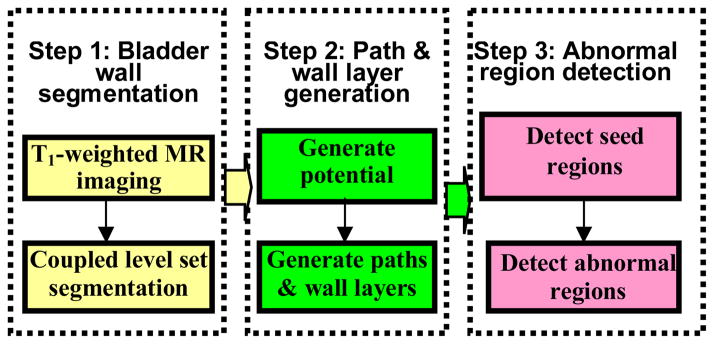
The whole procedure of the presented method includes three steps: (1) Segmentation of the bladder wall by using the coupled level set framework [11]. (2) Generation of the bladder wall layers by using the potential field inside the bladder wall and the paths from voxels on the inner border to the outer border. (3) Determination of the seed points on the inner border to represent the possible abnormal patches by using the wall thickness and the bent rate (BR), where tracing along the paths from the seeds and extracting the abnormal regions of the bladder wall is performed by using weighted bent rate (WBR) layer-by-layer. Fig. 1 depicts the pipeline of the whole procedure. Each step is detailed below.
Fig. 1.
Pipeline of the bladder abnormal region detection.
II. Bladder Wall Layer and Path Generations
In this step, the inner and outer borders of the bladder wall are segmented first. Then, based on the segmentation results, the bladder wall is divided into several layers and the path from each voxel on the inner border to the outer border is determined. The different layers and paths simulate the iso-potential surface and the electric field lines respectively. The wall thickness is estimated as the path length, and volume-based features can be extracted voxel-by-voxel along the paths. All the procedures above employ the level set functions.
A. Bladder Wall Segmentation
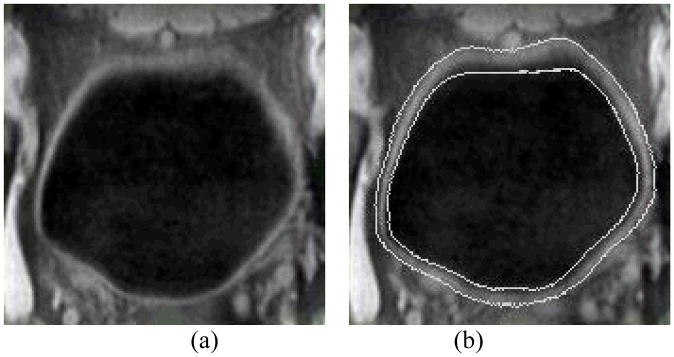
The inner and outer borders of the bladder wall are segmented by using the coupled level set algorithm [11]. The two level set functions collaborate with each other and automatically segment the inner and outer borders of the bladder wall in the 3D image datasets. For each level set function φ, the border segmentation consists of all the points x where φ(x) = 0. In the 3D space, the border is a surface, which we call it the zero level-set surface (ZLSS). In consequence, φ is expressed as a signed distance function, which has the form of φ(x)= ±d, where d is the nearest Euclidean distance from x to the ZLSS. The positive or negative value indicates that voxel x is inside or outside the ZLSS. More explanation for the level set method can be found in [12]. Suppose φ1 and φ2 are the inner level-set function (ILSF) and the outer level-set function (OLSF), respectively, to segment the inner and outer borders of the bladder wall. By modifying the well-known Chan-Vese model [13, 14] and proposing an adaptive clustering algorithm, the image energy and geometry energy potentials are well defined for the evolution of the level set functions. Then the φ1 and φ2 evolve iteratively and produce the final segmentation results. One advantage of the coupled level set framework is that it takes both the image intensity information and the segmented border geometry information into account, which is a solution for the problems of image inhomogeneity, ghost and complex intensity distribution near the outer border of the bladder wall in the T1-weighted MR images. Fig. 2 shows an example of the segmentation results. The details about the coupled level-set framework for the bladder wall segmentation can be found in our previous work [11].
Fig. 2.
(a) A typical T1-weighted MR image slice of a bladder. (b) Segmentation result of the same slice as in (a). Two white curves in (b) are the segmented inner and outer borders represented by ZLSSs of φ1 and φ2, respectively.
This segmentation algorithm provides the wall borders, which may help the following geometry analysis as comparing to our previous segmentation of partial volume layers each with a thickness due to the partial volume effect [3, 15, 16].
B. Bladder Wall Layer and Path Generations
After the segmentation, potential field inside the bladder wall is constructed based on φ1 and φ2. Furthermore, the path for each voxel on the inner border to the outer border and different wall layers are constructed given the potential field. We expect that the layers and paths have the similar property as the iso-potential surfaces and the electric field lines, respectively. That means: (1) all layers do not intersect with each other; (2) from each voxel on the inner border, there is one and only one path to the outer border; (3) the paths do not intersect with each other; (4) the paths perpendicular to the layers at the intersections. The concepts above are illustrated in Fig. 3. The potential field is generated first. The solid lines represent the layers while the dash lines indicate the paths. The voxels within one layer have approximately the same potential value.
Fig. 3.
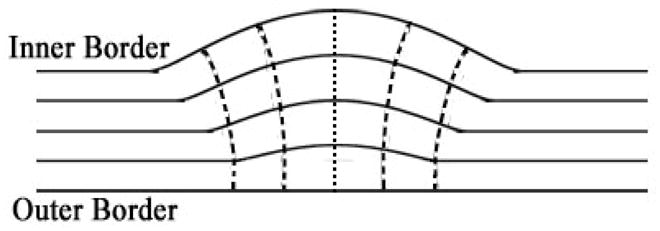
Illustration of the bladder wall layers and the paths.
The level set functions φ1 and φ2 can be used to estimate the potential field function P. The different layers generated by the potential function meet the criteria (1) above. The paths go along the gradient direction of the potential field voxel-by-voxel. To make the paths smooth and approximately perpendicular to the bladder wall borders at the intersection, the potential field and the paths are generated as follow:
-
The potential field is denoted by P, which is
(1) In Eq. (1), α1 and α2 are two power exponents, where α1, α2 ∈ [0,1]. They are the weighting factors to ensure that the iso-potential surfaces close to the inner or the outer borders have the similar shape with the corresponding borders. |φi(x)| is the absolute value of function φi(x), i= 1,2.
A layer of the bladder wall, consisting of voxels with similar potential value, is an iso-potential surface. Suppose the bladder wall is divided into n layers. The maximum and minimum potential value inside the bladder wall are Pmax and Pmin respectively. Then the jth layer consists of the voxels with potential value P ∈[Pmin +(j−1)×δP, Pmin + j×δP), where δP= (Pmax − Pmin)/n.
The gradient direction vector of each voxel x is obtained by using the potential function P(x), where is the unit vector to denote direction of potential gradient at voxel x.
As mentioned above, the path simulates the electric field line. Given a voxel x and the unit direction vector g(x), the path is traced along g(x). Generally, one path starts from the voxel xs on the inner border and stops at the voxel xe on the outer border of the bladder wall. Then, the path length is used to measure the wall thickness at xs.
III. Bent Rate and Weighted Bent Rate
The BRis a measure of the geometry property of a surface (or layer), while the WBR is designed to measure the geometry property as well as the intensity variation across different layers.
The BR was first proposed to maintain the smoothness of the ZLSS during the evolution in our previous work [11]. We adapted the BR instead of the curvature term, which is widely used in most level set methods, to measure the bent level of the surface. In this work, the BR is used to detect the seeds of the abnormal regions on the inner border. The BR has the form of
| (2) |
| (3) |
where φ1 is the ILSF, H is the Heaviside function, whose value is 1 where(φ1(y)− φ1(x))> 0 and 0 where (φ1(y)− φ1(x))≤ 0. x now indicates the concerned (or central) voxel and y∈ Ω, where Ω indicates the images domain. K is the weighting parameter with R being a predefined constant value.
The WBR is expected to reflect the geometry property of each layer as well as the intensity variation across the surrounding layers. It is used to extract the abnormal region inside the bladder wall. The WBR has the form of
| (4) |
| (5) |
where x, y and R have the same meanings as they are in the BR term. I(y) denotes the intensity value at y. As mentioned above P is the potential function and H is the Heaviside function, whose value is 1 where(P(y)− P(x))> 0 and 0 where(P(y)− P(x))≤ 0. Pmax,R and Pmin,R are the maximum and minimum potential values in the region with radius R and centered at x. The design of the W takes into account the potential values of different layers and the distance of voxel y with respect to the central voxel x. Practically, W is set to be 0 if |y − x|> R. If we get rid of the intensity and layer information, which means setting W and I to 1, then Eq. (4) degenerates to the BR term in Eq. (2).
IV. Abnormal Region Extraction
Bladder carcinoma invades gradually from the mucosa (or the inner border) into the wall muscles. Depending upon the degrees of penetration, bladder carcinoma is categorized into different stages. It is desirable that the invasion of the tumor can be reflected by image geometry and texture features in the bladder wall, especially near the inner border. The bladder wall thickening and the geometry changes on the inner border are sensitive parameters for detecting the emerging of the bladder abnormalities. However, for further analyzing the invasion depth and staging of the tumor, the suspect abnormal regions on the surface and inside the bladder wall are needed to be extracted first. We use the following steps to extract these regions.
Search for the seeds on the inner border. This step is based on two assumptions. First, the abnormalities casue the increasing or decreasing of the BR value on the inner border as well as the increasing of the wall thickness. Second, the voxels on the inner border representing the abnormalities only take a minor part. The two assumptions are reasonable in the clinic. Therefore, a Gaussian model is used to estimate the distribution of the wall thickness and the BR on the inner border. The voxels out of one standard deviation of both the thickness and the bent rate distribution are selected as the seeds.
For each voxel located on the inner border and chosen as the seed, the path corresponding to this voxel is collected. All the voxels on the same paths as the seeds are defined as the candidate of the abnormal region, while all the other voxels represent the normal region of the bladder wall.
As we mentioned above, the bladder wall is divided into several layers by using the potential field P. Then the WBR of the voxels in one layer is obtained. The distribution of the WBR value is also estimated by the Gaussian model. Then, the candidate voxels, whose WBR values lay out of one standard deviation and are picked out in step (2) above, are finally classified as in the abnormal region.
V. Results and Discussion
A. Data Acquisition
Five T1-weighted MR data sets from five subjects respectively were used to test the presented method. The five subjects include 2 patients and 3 volunteers. All datasets were acquired by the Phillips’ 1.5T and 3.0T scanners. The subjects were asked to empty the bladder and drink a cup of water about a half hour prior to the scanning when the bladder was full with the urine. In the T1-weighted MR images, the urine signal is attenuated for good contrast against the wall. The whole procedure is noninvasive. The T1-weighted MR images were outputted in DICOM format. The DICOM images were then reformed into self-defining raw volume datasets after removing the header information. Considering the non-isotropic resolution in the T1-weighted images, the slice thickness in each dataset was interpolated to match the in-plane voxel size for cubic voxel array before performing image segmentation.
A similar work from another research group for detecting the bladder tumor extracted the bladder wall thickness by using the CT images [5], instead of MR images. The CT imaging procedure injected exogenous contrast into the bladder, which makes the bladder shape and states (full or empty) more controllable and comparable among different subjects’ datasets. Thus, they constructed an atlas for the bladder wall thickness by using a group image dataset. The abnormalities were detected by comparing an individual case with the atlas. Our method, although uses the bladder wall thickness as an important parameter, runs on a totally different way. While the T1-weighted MR imaging is non-invasive and provides better contrast for the bladder wall (which makes the detection inside the bladder wall region possible), it is less controllable on the state (full/empty) of the bladder. From the acquired datasets, we found that the bladder shape and the wall thickness vary significantly among different subjects, even the same subject with different bladder states (full or empty). Fig. 4 gives an example of the T1-weighted MR imaging from two different subjects. Fig. 4(a) is like a peanut while Fig. 4(b) is fuller and like a ball. The table below denotes that the mean value of the wall thickness in Fig. 4(b) is much thicker than that in Fig. 4(a). Thus, different from reference [5], we do not construct the bladder wall atlas for abnormality detection.
Fig. 4.
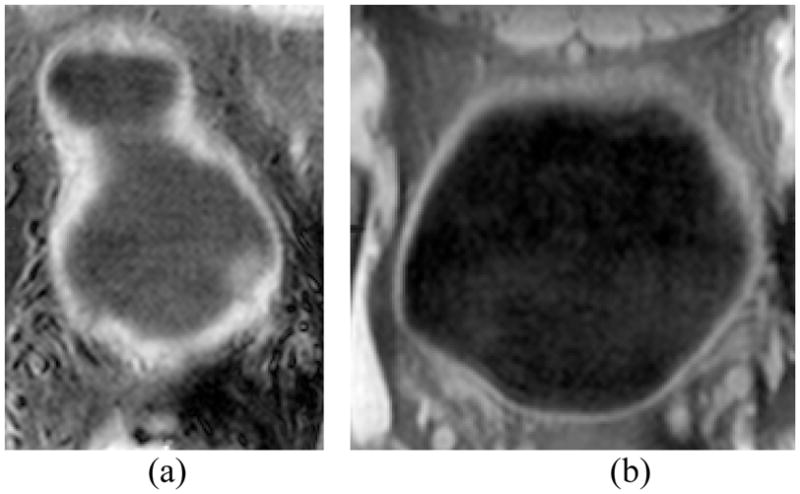
Examples of T1-weighted MR bladder images from different subjects.
B. Potential Field, Layers and Paths
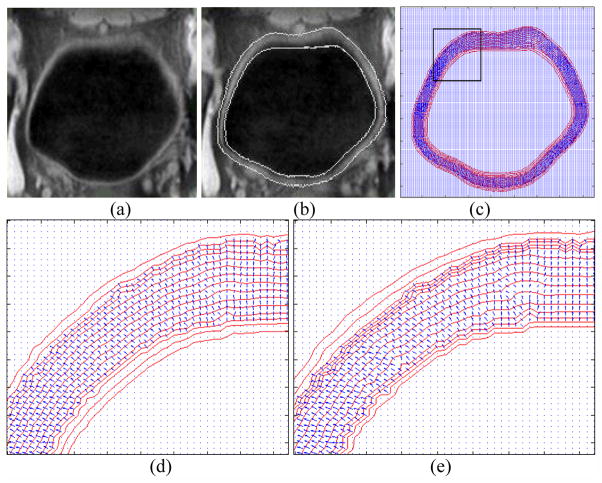
The potential field, layers and paths were generated based on the bladder wall segmentation results and the two level set functions φ1 and φ2. The reliability of the segmentation procedure has been proved in [11]. As we mentioned in Section II.B, the path and potential field generation procedures simulate the electric force line and the electric potential field. They provide a reasonable platform for (1) dividing the bladder wall into different layer and (2) tracing the paths from voxels on the inner border to the outer border. According to the level set theory, the segmented inner or outer border is an iso-potential surface in the potential field generated by φ1 or φ2 respectively. However, the potential field is generated by both φ1 and φ2 as in Eq. (1), which means the segmented borders are not exactly iso-potential surfaces. By choosing proper parameters α1 and α2 in Eq. (1), we can make the voxels on each border with similar potential values. Fig. 5 shows an example of iso-potential surfaces and the gradient direction in the slices. Fig. 5(a) is a slice from a clinical dataset and Fig. 5(b) is the segmentation result of the same slice. Fig. 5(c) shows the iso-potential surface (the red curves) and the gradient direction (the blue arrows) at each voxel. Both the iso-potential surface and the gradient direction were calculated in 3D space. We do not depict the gradient direction at all the voxels, but only the voxels inside the segmented bladder wall region. Also, the iso-potential surfaces depicted in Fig. 5 are those passing through at least one voxel that is inside the segmented bladder wall region. Figs. 5(d) and 5(e) enlarge the region inside the black frame in Fig. 5(c). The α1 and α2 values in Fig. 5(d) and 5(e) are (0.8, 0.6) and (0.8, 0.3), respectively. When α2 is increasing, the φ2 contributes more on φ1, and the shape of the iso-potential surface around the inner border are more distinct from the inner border itself. Therefore, we tend to choose smaller α2. Also, when the potential difference between the two adjacent layers is the same, a smaller α2 makes more layers concentrated toward the inner border of the bladder wall as shown in Fig. 5(e). Since the bladder tumor emerges from the inner border, more layers there would make a detection more reliable. In our experiments, α1= 0.8 and α2 = 0.3 were used.
Fig. 5.
Example of the iso-potential field and the gradient direction at each voxel. (a) The original T1-weighted MR image. (b) The segmentation result of the image in (a). The white curves are the segmented inner and outer borders. (c) The iso-potential surface (red curve) and the gradient direction (blue arrow) at each voxel inside the bladder wall. (d) The enlarged region in the black frame in (c). The potential is calculated by setting α1= 0.8 and α2= 0.6. (e) The enlarged region in the black frame in (c). The potential is calculated by setting α1= 0.8 and α2= 0.3.
The path was traced following the gradient direction at each voxel. The bladder wall thickness is measured as the path length between the inner and outer border of the bladder wall. In Table I, the average bladder wall thicknesses of all five test datasets are listed. For the patients’ datasets, the tumor regions were abandoned and did not contribute to the mean thickness. As we mentioned above, the bladder wall thickness varies obviously under the MR imaging procedure. The patient 1 (P1) is from the data shown in Fig. 4(a). Since the patient did not hold enough urine, the bladder wall is much thicker than the others. All the thicknesses in Table I are measured by the number of voxels.
TABLE I.
Average Bladder Wall Thickness
| Datasets | V1 | V2 | V3 | P1 | P2 |
|---|---|---|---|---|---|
| Thickness (Voxel) | 8.4 | 8.9 | 9.9 | 12.6 | 9.2 |
C. Abnormal Region Detection
Before detecting the abnormal region, the seeds should be found on the inner border first. Suppose a patch of connecting the seeds is a seed region. The number of the seed region represents the number of abnormalities detected in the current dataset. In Table II, four terms were used to generate the seed regions. The path length and the Euclidean distance were used to measure the bladder wall thickness. The curvature and the BR term were used for the surface geometry measurement. In Table II, the number of the detected seed region is listed for all datasets. The last row shows the ground truth.
TABLE II.
Numbers of the Detected Seed Regions
| V1 | V2 | V3 | P1 | P2 | |
|---|---|---|---|---|---|
| Path Length | 3 | 7 | 6 | 5 | 1 |
| Euclidean Distance | 3 | 7 | 5 | 6 | 1 |
| Bent Rate | 4 | 10 | 6 | 9 | 7 |
| Curvature | 7 | 11 | 8 | 14 | 8 |
| Path Length & Bent Rate | 2 | 2 | 1 | 3 | 1 |
| Ground Truth | 0 | 0 | 0 | 1 | 1 |
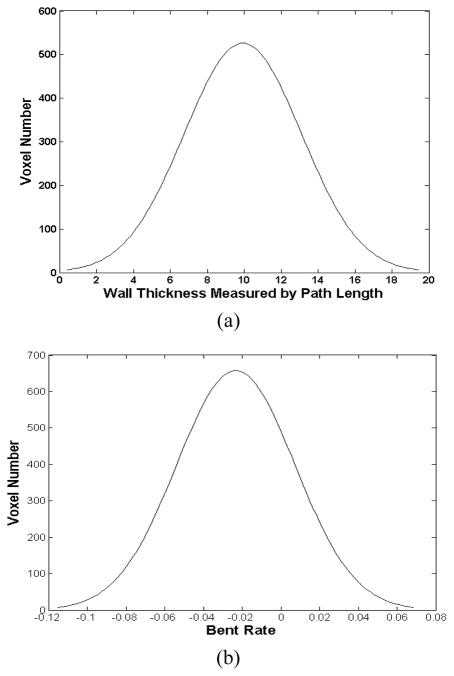
The “ground truth” in Table II indicates that all volunteers’ datasets contain no tumor and the two patients’ datasets each has one tumor. Using the path length and the BR together to detect the seed regions generated the best results. While all the parameters are capable to detect the tumor in the patients’ datasets, the path length combining with the BR generated the least FP regions. The path length and the Euclidean distance performed similarly with each other. The BR performed better than the curvature. That is partly due to the reason that the curvature term only takes into account the first-order neighborhood, which is more sensitive to the image noise. Because of these observations, the following procedures were based on the seed regions, which were generated by the path length combining with the BR. Fig. 6 shows examples of the BR value and the path length distribution of a dataset. The Gaussian model is suitable to describe these two distribution curves. The thickness and BR value at the seed voxels have and , where t is the thickness value,(μt, σt) and (μB R, σB R) are the corresponding means and standard deviations.
Fig. 6.
Example of the path length (a) and the BR (b) distribution diagrams. (a) The horizontal axis is the path length value, and the vertical axis is the number of voxels. (b) The horizontal axis is the BR value, and the vertical axis is the number of voxels.
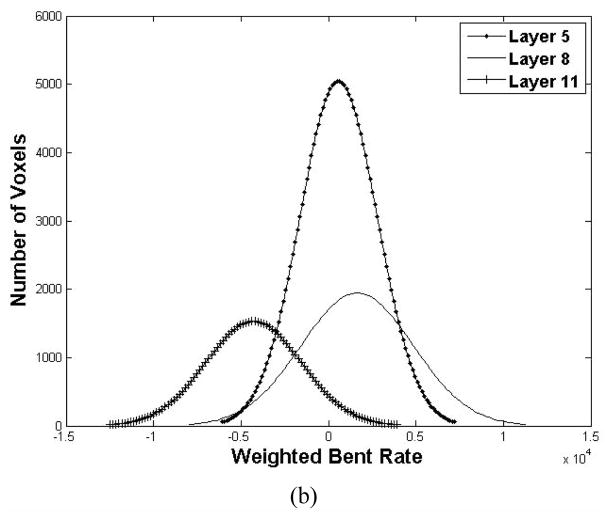
Then, we used the seeds as the initial to trace those concerned voxels inside the bladder wall. The WBR of the voxels on the tracing path was compared with those in the same layer to detect the abnormal region voxels. Before the abnormal region detection, we first explored the WBR distribution layer by layer. Fig. 7 shows an example in which the bladder wall was divided into 12 layers by the potential field. Fig. 7(a) is the diagram depicts the mean and standard deviation (the solid curve and the vertical bar) of the WBR in each layer. The horizontal and vertical axes are the layer index and the WBR value respectively. In our work, the bladder wall was divided into 12 layers according to the potential value. The layers from index 1 to 12 go from the outside toward the inside of the bladder wall. In Fig. 7(a), the WBR value in layers 10 to 12 are distinct from layer 1 to 9, which represents that they have independent distribution properties. Therefore, it is more reasonable to detect the abnormal region layer-by-layer than taking the entire bladder wall into account, which may diminish the tiny feature variation in each layer. Fig. 7 (b) plots the WBR value distribution curves of three layers (layer 5, layer 8 and layer 11). The distribution of WBR in each layer approximates the Gaussian distribution. Since the abnormal region possesses small part in each layer, we considered those voxels with the WBR value out of one standard deviation of the corresponding layer as the concerned voxels inside the abnormal region.
Fig. 7.
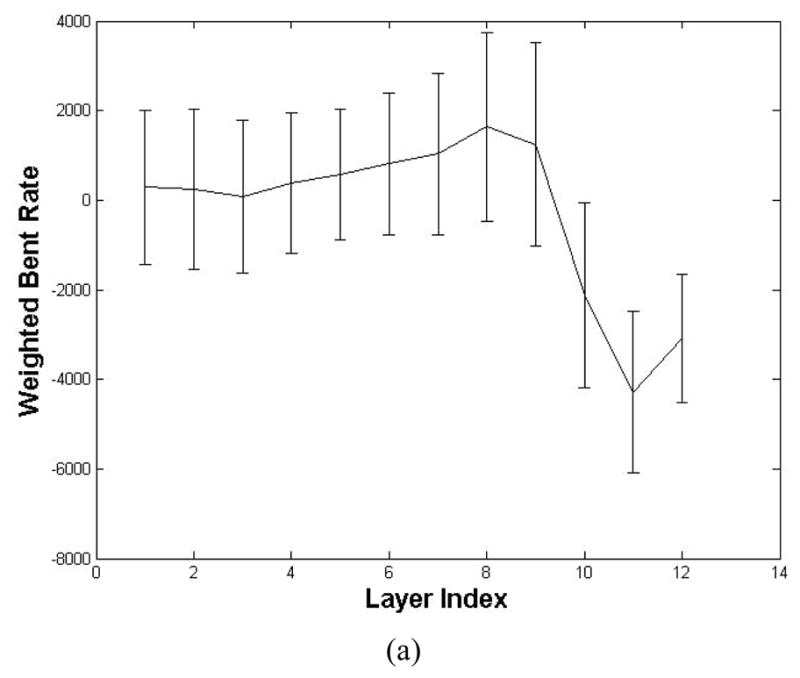
The WBR value in different layers (a total of 12 layers are defined). (a) is the mean and standard deviation of the WBR at different layers. (b) is the WBR distribution of layer 5, 8 and 11. Each curve is the number of voxels with respective to the WBR value.
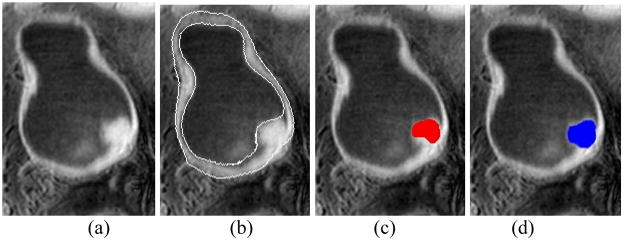
Fig. 8 is an example of the detected abnormal region. Fig. 8(c) shows the abnormal region detected by our method and Fig. 8(d) is the tumor region delineated by an expert manually. The overlap ratio was used to evaluate the accuracy of the abnormal region detected by the computer in comparison with the manually-drawn one. The overlap ratio is measure by
Fig. 8.
The result of the detected abnormal region. (a) The original T1-weighted MR image. (b) The segmentation result of (a), where two white curves are the segmented borders. (c) The abnormal region detected by the computer (the red region). (d) The tumor region delineated manually by the expert (the blue region).
| (6) |
where OR is the overlap ratio. VC and VM are the abnormal region volumes delineated respectively by the computer and the expert manually. Table III lists the OR of different datasets. The OR1 in the first row are from all the regions detected by the computer including the FPs, while the OR2 in the second row only includes the true positive regions detected by the computer.
TABLE III.
The Overlap Ratios of all the Datasets
| V1 | V2 | V3 | P1 | P2 | |
|---|---|---|---|---|---|
| OR1 | 0 | 0 | 0 | 64.5% | 93.7% |
| OR2 | 0 | 0 | 0 | 87.5% | 93.7% |
The overlap ratio of the true positive region is 87.5% and 93.7% for P1 and P2 respectively, which is promising. The OR1 of P1 is much lower because there are two FP regions detected by the computer.
VI. Conclusion
In this study, we proposed a non-invasive procedure for detecting the bladder abnormalities and the abnormal regions inside the bladder wall via MR cystography. The volume-based features BR and WBR were considered. First, the bladder wall was segmented by using the coupled level set framework [11]. Two level set functions were employed to segment the inner and outer borders of the bladder wall respectively. The potential field which simulates the electric potential field was generated by using the two level set functions. Then, the bladder wall was divided into several layers based on the potential field. And the paths inside the bladder wall were obtained. Bladder wall thickness was measured by the path length between the two borders. The suspected abnormal patches on the inner border (the seed region) were picked out based on the wall thickness and the BR of the voxels on the inner border. The seed regions were further used as the initial to trace the concerned voxels inside the bladder wall. Finally, the distribution of the WBR was measured layer-by-layer and the abnormal region was generated. The method was tested on both volunteer and patient datasets. By comparing with other features, the BR and wall thickness together detected all the tumors and generated the least number of false positives. The detected abnormal regions, which are the true positives, highly overlapped with the tumor region delineated manually by the expert. More delicate analysis for the tumor diagnosis can be performed inside the detected abnormal regions.
This study is based on and also an extension of our previous work [11], where a framework for extracting the inner and outer borders of the bladder wall is presented. The fundamental conjecture of this study and the previous work is that the wall thickness is a sensitive biomarker to detect bladder abnormalities, as observed by several studies [4, 5]. It is expected that both geometrical and texture features derived from the extracted wall would further improve the sensitivity of the biomarker. This study, including others [6], is an example of our research effort along that direction.
A major limitation in this study is the small number of datasets for the test of the new features. Resolving this limitation is somehow beyond the scope of this study because recruiting patients is a time consuming and requires a great resource. Despite the limitation, this study does show the feasibility of the method for the detection purpose, and is an attempt to explore the tumor detection inside the bladder wall.
Acknowledgments
This work was partly supported by the China Postdoctoral Science Foundation project (No. 20090460353), the China National Natural Science Foundation project (No. 81000646), and the Shenzhen Government R&D Program (JC201005270301A). Z. Liang was supported by the US NIH/NCI Grant #CA120917 and #CA082402.
Contributor Information
Chaijie Duan, Email: duan.chaijie@sz.tsinghua.edu.cn, Department of Biomedical Engineering, Tsinghua University, Beijing 100084, China; and the Graduate School at Shenzhen, Tsinghua University, Shenzhen 518055, China.
Kehong Yuan, Email: yuankh@sz.tsinghua.edu.cn, Department of Biomedical Engineering, Tsinghua University, Beijing 100084, China; and the Graduate School at Shenzhen, Tsinghua University, Shenzhen 518055, China.
Fanghua Liu, Department of Biomedical Engineering, Tsinghua University, Beijing 100084, China; and the Graduate School at Shenzhen, Tsinghua University, Shenzhen 518055, China.
Ping Xiao, Email: xiaoping@yahoo.com, Hospital of Peking University at Shenzhen, Shenzhen, 518015, China.
Guoqing Lv, Hospital of Peking University at Shenzhen, Shenzhen, 518015, China.
Zhengrong Liang, Email: Jerome.Liang@sunysb.edu, Departments of Radiology and Computer Science, State University of New York, Stony Brook, NY 11794 USA.
References
- 1.Overview: Bladder Cancer. Retrieved June 8, 2010, from American Cancer Society web site: www.cancer.org.
- 2.Lamm DL, Torti FM. Bladder cancer. A Cancer Journal for Clinicians. 1996;46:93–112. doi: 10.3322/canjclin.46.2.93. [DOI] [PubMed] [Google Scholar]
- 3.Li L, Wang Z, Harrington D, Huang W, Liang Z. A mixture-based computer aided detection system for virtual cystoscopy. Proc. International Society of Magnetic Resonance in Medicine; 2003. p. 146. [Google Scholar]
- 4.Fielding JR, Hoyte L, Okon SA, Schreyer A, Lee J, Zou KH, Warfield S, Richie JP, Loughlin KR, O’Leary MP, Doyle CJ, Kikinis R. Tumor detection by virtual cystoscopy with color mapping of bladder wall thickness. The Journal of Urology. 2002;167:559–562. doi: 10.1016/S0022-5347(01)69085-2. [DOI] [PubMed] [Google Scholar]
- 5.Jaume S, Ferrant M, Macq B, Hoyte L, Fielding JR, Schreyer A, Kikinis R, Warfield SK. Tumor detection in the bladder wall with a measurement of abnormal thickness in CT scans. IEEE Transactions on Biomedical Engineering. 2003;50(3):383–390. doi: 10.1109/TBME.2003.808828. [DOI] [PubMed] [Google Scholar]
- 6.Zhu H, Duan C, Jiang R, Li L, Fan Y, Yu X, Zeng W, Gu X, Liang Z. Computer-aided detection of bladder tumors based on the thickness mapping of bladder wall in MR images. Proc. SPIE Medical Imaging; 2010. CD-ROM. [Google Scholar]
- 7.Wu Z, Shi Z, Zhang G, Lu H. Detection of the invasion of bladder tumor into adjacent wall base on textural features extracted from MRI images. Proceeding of the 13th international conference on medical image computing and computer assisted intervention; 2010. pp. 89–96. [Google Scholar]
- 8.Liang Z, Chen D, Button T, Li H, Huang W. Feasibility studies on extracting bladder wall from MR images for virtual cystoscopy. Proc. International Society of Magnetic Resonance in Medicine,; 1999. p. 2204. [Google Scholar]
- 9.Chen D, Li B, Huang W, Liang Z. A multi-scan MRI-based virtual cystoscopy. Proc. SPIE Medical Imaging; 2000. pp. 146–152. [Google Scholar]
- 10.Lammle M, Beer A, Settles M, Hannig C, Schwaibold H, Drews C. Reliability of MR imaging-based virtual cystoscopy in the diagnosis of cancer of the urinary bladder. American Journal of Roentgenology. 2002;178:1483–1488. doi: 10.2214/ajr.178.6.1781483. [DOI] [PubMed] [Google Scholar]
- 11.Duan C, Liang Z, Bao S, Zhu H, Wang S, Zhang G, Chen J, Lu H. A coupled level set framework for bladder wall segmentation with application to MR cystography. IEEE Trans on Medical Imaging. 2010;29(3):903–915. doi: 10.1109/TMI.2009.2039756. [DOI] [PMC free article] [PubMed] [Google Scholar]
- 12.Osher S, Sethian J. Fronts propagating with curvature dependent speed: algorithms based on Hamilton-Jacobi formulation. Journal of Computer Physics. 1988;79:12–49. [Google Scholar]
- 13.Chan TF, Vese LA. Active contours without edges. IEEE Transactions on Image Processing. 2001;10(2):266–277. doi: 10.1109/83.902291. [DOI] [PubMed] [Google Scholar]
- 14.Vese LA, Chan TF. A multiphase level set framework for image segmentation using the Mumford and Shah model. International Journal of Computer Vision. 2002;50(3):271–293. [Google Scholar]
- 15.Li L, Wang Z, Li X, Wei X, Adler H, Huang W, Rizvi S, Meng H, Harrington D, Liang Z. A new partial volume segmentation approach to extract bladder wall for computer aided detection in virtual cystoscopy. Proc SPIE Medical Imaging. 2004;5369:199–206. [Google Scholar]
- 16.Li L, Liang Z, Wang S, Lu H, Wagshul M, Zawin M, Posniak E, Lee C. Segmentation of multi-spectral bladder MR images with inhomogeneity correction for virtual cystoscopy. Proc. SPIE Medical Imaging; 2008. CD-ROM. [Google Scholar]


