Whether or not obesity (measured in terms of body mass index, body surface area, visceral fat area, and s.c. fat area) can predict the long-term prognosis of renal cell cancer patients treated with vascular endothelial growth factor–targeted therapy is examined.
Keywords: Metastatic kidney cancer, Prognosis, Body mass index, BMI, Body surface area, BSA, Visceral fat, Subcutaneous fat, Obesity, Overweight
Abstract
Background.
Obesity increases the risk for renal cell carcinoma (RCC). However, it has only recently been identified as an independent positive prognostic factor for localized RCC.
Objective.
To determine whether obesity influences long-term prognosis in metastatic RCC patients receiving vascular endothelial growth factor–targeted therapy.
Design, Setting, and Participants.
In 116 patients with metastatic RCC who received antiangiogenic agents (sunitinib, sorafenib, axitinib, bevacizumab) in 2005–2010, we evaluated whether body mass index (BMI), a body surface area (BSA) above the European average, the visceral fat area (VFA), or s.c. fat area (SFA) were of predictive relevance.
Measurements.
BMI was categorized based on current World Health Organization definitions. BSA was stratified according to the European average for men (1.98 m2) and women (1.74 m2). VFA and SFA were dichotomized using the median of the observed distribution as the cutoff. The primary endpoints of this study were time to progression and overall survival time.
Results and Limitations.
The whole population had median progression-free and overall survival times of 8.3 months and 20.5 months, respectively. In contrast to BMI and BSA, higher than average VFA and SFA levels were significant predictors of longer progression-free and overall survival times. The major limitations of this study are its retrospective design and its heterogeneous patient population.
Conclusion.
This is the first study to identify high VFA and SFA levels as positive predictive biomarkers for patients who receive first-line antiangiogenic agents for metastatic RCC.
Introduction
The development of therapeutic agents blocking pathways typically involved in tumor progression, such as the vascular endothelial growth factor (VEGF) pathway, revolutionized the treatment of patients with metastatic renal cell cancer (RCC) and established molecular targeted therapy as the preferred therapeutic approach. However, treatment with these novel drugs is still palliative and we still lack indicators to predict which patient profits most from which agent in which sequence and, particularly, dose rate.
Obesity is a widely accepted risk factor for RCC [1–4], which is of increasing importance because today, worldwide, >300 million adults are obese, and the prevalence of obesity is still rapidly rising. It is projected that, by 2015, 75% of American adults will be overweight and 41% will be deemed obese [5]. However, even though being overweight predisposes to RCC, obesity has only recently been identified as an independent positive prognostic factor for patients with localized RCC [6, 7].
Interestingly, a study presented at the 2010 American Society of Clinical Oncology Annual Meeting by Choueiri et al. [8] evaluated the effect of body mass index (BMI) and body surface area (BSA) on the prognosis of metastatic RCC patients treated with VEGF-targeted therapy [8]. In that trial, obesity was independently associated with a better clinical outcome in patients with metastatic disease under targeted therapy. Similar results were reported for patients treated with pazopanib [9]. In contrast, in a previous issue of The Oncologist, Ladoire et al. [10] only recently published the results of a similar but smaller trial in which a high visceral fat area (VFA) and high s.c. fat area (SFA) were significantly associated with a shorter time to progression and shorter survival time in patients with metastatic RCC treated with antiangiogenic agents.
Facing these controversial data in the metastatic setting, and the urgent need for prognostic as well as predictive factors, the aim of our study was to assess whether or not obesity (measured in terms of BMI, BSA, VFA, and SFA) can predict the long-term prognosis of patients treated with VEGF-targeted therapy.
Patients, Materials, and Methods
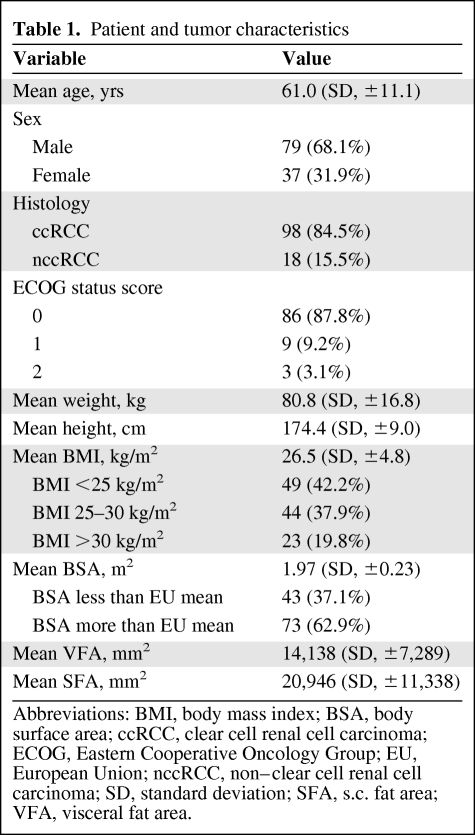
This study included 116 patients with metastatic RCC with complete BMI and BSA data and/or information about their pretherapeutic VFA and SFA (n = 77). Patients had received tyrosine kinase inhibitors (sunitinib, n = 90; sorafenib, n = 15; axitinib, n = 8) or bevacizumab (n = 3) as first-line treatment for metastatic RCC. Detailed patient information is given in Table 1. Patients had a median follow-up of 21 months (interquartile range [IQR], 9.5–30.3 months). Forty-three patients had baseline systemic hypertension, 11 suffered from non–insulin-dependent diabetes mellitus, and two patients had hyperlipidemia.
Table 1.
Patient and tumor characteristics
Abbreviations: BMI, body mass index; BSA, body surface area; ccRCC, clear cell renal cell carcinoma; ECOG, Eastern Cooperative Oncology Group; EU, European Union; nccRCC, non–clear cell renal cell carcinoma; SD, standard deviation; SFA, s.c. fat area; VFA, visceral fat area.
BMI was categorized based on current World Health Organization definitions (http://www.who.int/bmi): <18.5 kg/m2, underweight; 18.5–24.99 kg/m2, normal range; ≥25–29.99 kg/m2, preobese; ≥30 kg/m2, obese. BSA was stratified according to the European average for men (1.98 m2) and women (1.74 m2) [11, 12].
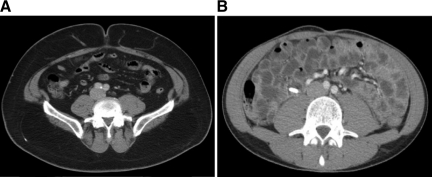
VFA and SFA were measured retrospectively on available computed tomography scans performed before treatment initiation, at the level of the umbilicus with the patient in the supine position, as described previously [13]. Briefly, we used ImageJ software (http://rsb.info.nih.gov/ij/) to measure pixels with densities in the −190 Hounsfield units (HU) to −30 HU range to delineate the s.c. and visceral compartments and to compute the cross-sectional area of each in mm2 as described earlier [10, 13] (Figure 1). Fat measurements were all performed by one radiologist (K.I.R.), who was blinded to patient information, clinical treatment, and outcome. Given the absence of normative data on VFA and SFA in the literature, values in our patient collective were dichotomized for both using the median of the observed distribution as the cutoff.
Figure 1.
Axial computed tomography images of two different patients at the level of the umbilicus for assessment of SFA and VFA. (A): Obese patient with considerable fat in the s.c. and visceral compartment (BMI, 34.6 kg/m2; BSA, 2.17 m2; VFA, 16,211 mm2; SFA, 46,681 mm2). (B): Patient with a minimal s.c. and visceral fat amount (BMI, 19.8 kg/m2; BSA, 1.78 m2; VFA, 1,025 mm2; SFA, 3,639 mm2).
Abbreviations: BMI, body mass index; BSA, body surface area; SFA, s.c. fat area; VFA, visceral fat area.
Statistical Analysis
The follow-up duration was calculated from the date of first VEGF agent administration to the date of death or the last follow-up visit. The primary endpoints of this study were the progression-free survival (PFS) and overall survival (OS) times. The PFS interval was defined as time from the first VEGF agent administration to the first recorded evidence of progression. The OS time was defined as the time of VEGF agent administration to the date of death. Continuous variables were reported as means and standard deviations (SDs) for parametric distributions or as medians and IQRs for nonparametric distributions. Kaplan–Meier survival times were calculated, and subgroups were compared using the log-rank test statistic. Multivariate Cox regression models were used to assess the association between survival and BMI, BSA, VFA, and SFA adjusted for different clinical and patient covariates. The χ2 test and Fisher's exact test were used to assess differences in covariate distributions among the BMI and BSA categories. SPSS 17.0 (SPSS Inc., Chicago, IL) was used for statistical assessment. p-values <.05 were considered significant in all tests. All p-values were two-sided.
Results
Correlation Between Patient or Tumor Characteristics and Different Measures of Obesity (BMI, BSA, VFA, SFA)
Baseline patient and tumor characteristics are summarized in Table 1. Patients (n = 116 evaluable) had a mean BMI of 26.5 kg/m2 (SD, ±4.8 kg/m2) with no difference between men (26.4 kg/m2) and women (26.6 kg/m2) (p = .87, t-test). BMI did not correlate with either age (p = .85, Spearman's ρ) or histological subtype (p = .31, χ2 test). A BSA above the European average was not associated with sex (p = .84, χ2 test) or age (p = .81, t-test). Moreover, BSA was higher than average in 65.3% of patients with clear cell and 50.0% of patients with non–clear cell RCC (p = .29, Fisher's exact test).
Patients (n =77 evaluable) with a VFA higher than the median in our cohort tended to be older (mean age, 61.2 years versus 56.9 years; p = .08, t-test). This association was not shown for patients with a high SFA (p = .76). In contrast to SFA (p = .45, Fisher's exact test), a high VFA was more often found in men (58.2%) than in women (27.3%) (p = .02, Fisher's exact test). Neither VFA nor SFA was associated with histological subtype.
Measures for Obesity (BMI, BSA, VFA, SFA) and Their Predictive Value
The calculated median PFS and OS times of all 116 patients with metastatic RCC were 8.3 months and 20.5 months, respectively.
Kaplan–Meier analysis disclosed no significant difference in the PFS interval (median, 8.4, 8.3, and 7.8 months, respectively; p = .63) or the OS time among the three BMI classes (19.0 months, 20.9 months, and 20.3 months, respectively; p = .61, log-rank). In agreement, the median PFS and OS times were 8.4 months and 22.5 months for patients with a BSA below and 7.8 months and 20.4 months for patients with a BSA above the European average (p = .47 and p = .13, respectively, log-rank). Applying subgroup analysis including only patients with clear cell histology, no significant difference in terms of the PFS or OS time for BMI or BSA could be demonstrated either.
In contrast, patients with a high VFA experienced a significantly longer median PFS duration (11.5 months) as well as a longer OS time (32.3 months) than patients with a lower VFA (8.4 months and 16.9 months; p = .005 and p = 0.04, respectively, log-rank) (Fig. 2A, 2B). After exclusion of patients without clear cell RCC, the results for the median PFS (11.7 months versus 8.3 months; p = .001) and OS (32.7 months versus 16.8 months; p = .04) times for patients with higher and lower VFAs did not differ.
Figure 2.
Association between visceral fat area (VFA) and clinical outcome (Kaplan–Meier). (A): The median progression-free survival times were 11.5 months and 8.4 months for patients with a higher and lower than average VFA, respectively (p = .005, log-rank). (B): The median overall survival times were 32.3 months and 16.9 months for patients with a higher and lower than average VFA, respectively (p = .038, log-rank).
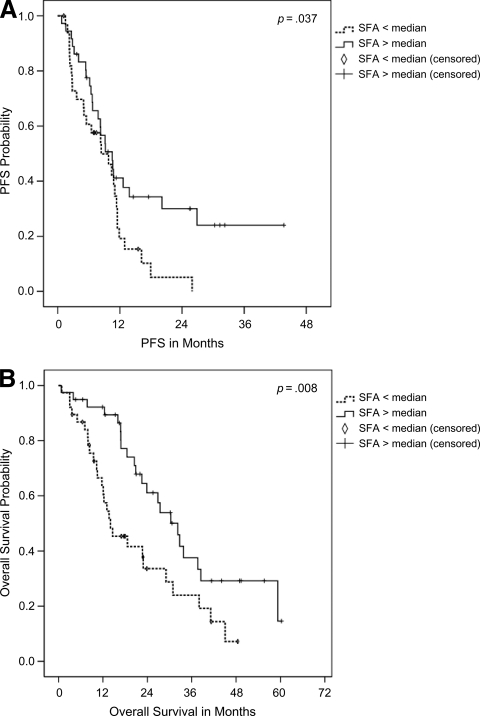
Furthermore, Kaplan–Meier analysis revealed that a higher rather than average SFA qualified as a significant predictor of a longer PFS interval (10.5 months versus 8.4 months; p = .04) and longer OS time (32.3 months versus 14.0 months; p = .008) (Fig. 3A, 3B). Including only patients with clear cell RCC, the results for the median PFS duration (10.6 months versus 8.4 months; p = .03) and overall survival duration (32.7 months versus 14.6 months; p = .01) for patients with higher and lower than average SFAs were nearly identical to those of the whole group.
Figure 3.
Association between s.c. fat area (SFA) and clinical outcome (Kaplan–Meier). (A): The median progression-free survival times were 10.5 months and 8.4 months for patients with a higher and lower than average SFA, respectively (p = .037, log-rank). (B): The median overall survival times were 32.3 months and 14.0 months for patients with a higher and lower than average SFA, respectively (p = .008, log-rank).
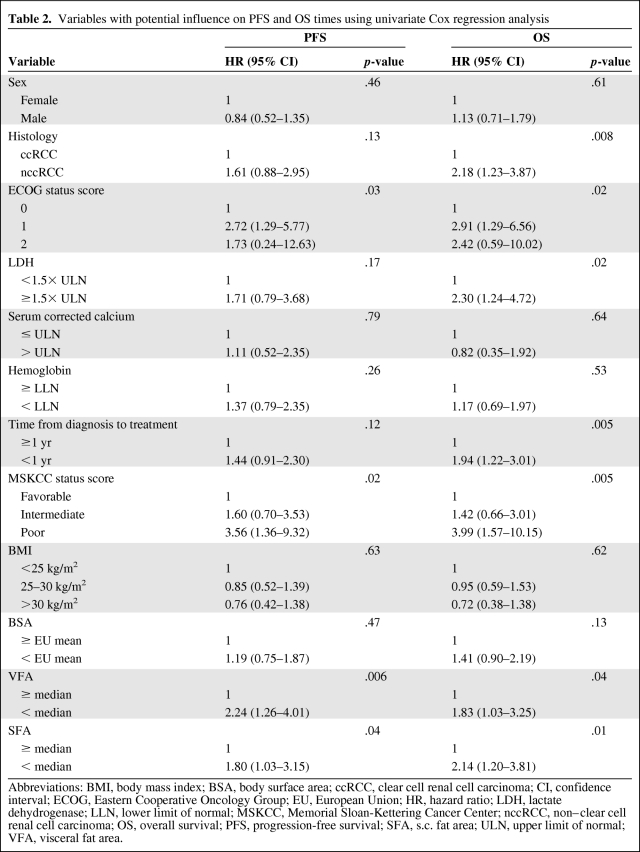
Applying univariate Cox regression analyses, variables that predicted a shorter PFS interval were a high Eastern Cooperative Oncology Group (ECOG) performance status score, a high Memorial Sloan-Kettering Cancer Center (MSKCC) status score, and a lower than average VFA and SFA. Factors predicting a shorter OS duration, however, were a histologic subtype other than clear cell, a high ECOG score and MSKCC status score, a lactate dehydrogenase level >1.5× the upper limit of normal, a time from diagnosis to treatment <1 year, and, again, a lower than average VFA and SFA (Table 2).
Table 2.
Variables with potential influence on PFS and OS times using univariate Cox regression analysis
Abbreviations: BMI, body mass index; BSA, body surface area; ccRCC, clear cell renal cell carcinoma; CI, confidence interval; ECOG, Eastern Cooperative Oncology Group; EU, European Union; HR, hazard ratio; LDH, lactate dehydrogenase; LLN, lower limit of normal; MSKCC, Memorial Sloan-Kettering Cancer Center; nccRCC, non–clear cell renal cell carcinoma; OS, overall survival; PFS, progression-free survival; SFA, s.c. fat area; ULN, upper limit of normal; VFA, visceral fat area.
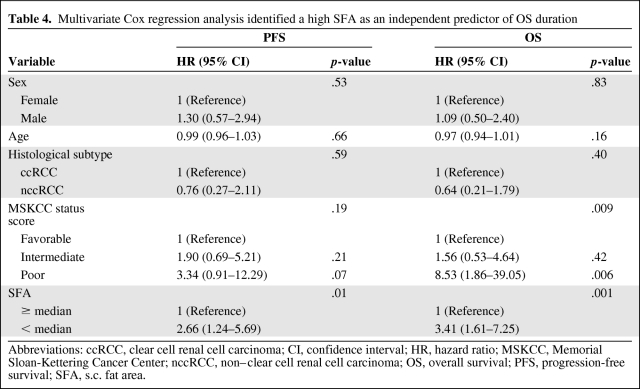
Using multivariate Cox regression analysis, including sex, age, histologic subtype, and MSKCC status prior to systemic treatment, in contrast to BMI (p = .88 and p = .17) and BSA (p = .85 and p = .77), VFA (p = .006; hazard ratio [HR], 3.26; 95% confidence interval [CI], 1.39–7.62 and p = .006; HR, 2.97; 95% CI, 1.36–6.47) and SFA (p = .012; HR, 2.66; 95% CI, 1.24–5.69 and p = .001; HR, 3.41; 95% CI, 1.61–7.25) were identified as independent predictive markers of PFS and OS times, respectively, for patients with metastatic RCC treated first line with antiangiogenic agents (Tables 3 and 4).
Table 3.
Multivariate Cox regression analysis identified a high VFA as an independent predictor of PFS and OS times
Abbreviations: ccRCC, clear cell renal cell carcinoma; CI, confidence interval; HR, hazard ratio; MSKCC, Memorial Sloan-Kettering Cancer Center; nccRCC, non–clear cell renal cell renal cell carcinoma; OS, overall survival; PFS, progression-free survival; VFA, visceral fat area.
Table 4.
Multivariate Cox regression analysis identified a high SFA as an independent predictor of OS duration
Abbreviations: ccRCC, clear cell renal cell carcinoma; CI, confidence interval; HR, hazard ratio; MSKCC, Memorial Sloan-Kettering Cancer Center; nccRCC, non–clear cell renal cell carcinoma; OS, overall survival; PFS, progression-free survival; SFA, s.c. fat area.
Discussion
The rapid development of agents blocking the VEGF pathway has changed the landscape of treatment for advanced renal cancer. Because the median OS time doubled in only a few years, molecularly targeted therapy is now the preferred treatment approach for most patients with advanced clear cell RCC. However, prognostic parameters that stratify patients profiting from targeted therapy, leading to highly individualized treatment protocols, are still lacking.
Obesity is a widely accepted risk factor for RCC [4]. Moreover, Lowrance et al. [14] recently demonstrated that it is particularly associated with a higher risk for clear cell tumors. It has been hypothesized that overweight individuals show dysregulation of multiple pathways, which may spur tumor development or aggressiveness. Upregulation of estrogen and insulin levels or other growth factors secreted from adipose tissue has been noted. Furthermore, abnormal cholesterol metabolism and immune system alterations have been described [15]. Despite the fact that obesity significantly increases the risk for RCC, overweight was identified as an independent prognostic marker of a better cancer-specific survival outcome in patients with organ-confined RCC [6]. Nevertheless, all studies evaluating the association between body mass and mortality caused by RCC were focused on patients at the time of diagnosis, and mostly on those with localized disease.
To our knowledge, only two conflicting trials have analyzed the influence of obesity on the prognosis of metastatic RCC patients under VEGF-targeted therapy [8, 10]. In a retrospective multicenter study including 475 metastatic RCC patients who received anti-VEGF drugs as first-line therapy, Choueiri et al. [8] found that obesity (high BMI and BSA) was independently associated with a better treatment outcome. In contrast, Ladoire et al. [10] reported, in a retrospective study, that high VFA and SFA were significantly associated with a shorter time to progression and shorter survival time in patients with metastatic RCC treated with either immunotherapy (n = 49) or targeted agents (n = 64).
However, in our study, which was comprised of 116 patients receiving first-line VEGF-targeted agents, we were not able to reproduce the results published by Choueiri et al. [8]. That is, in our study, BMI and BSA were not significantly associated with the PFS or OS duration. However, because our patient cohort was smaller than that of Choueiri et al. [8], and because we observed at least a trend toward a better prognosis for patients with higher BMI or BSA levels, significance might have been reached with a higher number of patients. That is, our study might have been underpowered and thus failed to show a significant predictive impact of BMI or BSA on the prognosis of patients treated with antiangiogenic agents.
However, we were able, for the first time, to show that high VFA and SFA are significantly associated with a better prognosis. Using multivariate analysis, a higher than average VFA and SFA predicted longer PFS and OS times. These results are directly in contrast to those recently published by Ladoire et al. [10], who described that, in 64 metastatic RCC patients treated with first-line antiangiogenic agents, a high VFA served as a predictive biomarker for a shorter survival time.
The major limitations of this study, as well as the studies by Ladoire et al. [10] and Choueiri et al. [8], are its retrospective design, its lack of central pathology review, its heterogeneous patient population, and its relatively short follow-up. Nevertheless, we were able to clearly show that higher levels of adipose fat, particularly the VFA and SFA, predicted a better prognosis in metastatic RCC patients treated with antiangiogenic agents. The reasons for this finding remain unclear and could include the possibility that high adipose fat levels simply prevent tumor cachexia or the fact that adipose tissue acts as an endocrine and paracrine organ that releases cytokine-like polypeptides responsible for widespread biological effects [10, 16] that are not yet fully understood and could enhance the efficacy of anti-VEGF agents. Furthermore, our results indicate that BMI and BSA are crude measures of obesity and that it can be beneficial to directly assess VFA or SFA as a measure of overweight. If the results of Choueiri et al. [8] and our results can be confirmed in future trials, basic research will be needed to investigate why high fat levels might serve as a positive predictive marker of therapeutic response to antiangiogenic treatment. This could help to further improve the systemic treatment for patients with metastatic RCC.
Editor's Note: See the accompanying commentary, “Impact of body composition on clinical outcomes in metastatic renal cell cancer,” by P.A. Tang, D.Y.C. Heng, and T.K. Choueiri, on pages 1484–1486 of this issue.
Acknowledgment
Sandra Steffens, Viktor Grünwald, and Kristina I. Ringe contributed equally.
Footnotes
- (C/A)
- consulting/advisory relationship
- (RF)
- Research funding
- (E)
- Employment
- (H)
- Honoraria received
- (OI)
- Ownership interests
- (IP)
- Intellectual property rights/inventor/patent holder
Author Contributions
Conception/Design: Markus A. Kuczyk, Sandra Steffens, Viktor Grünwald, Mark Schrader, Andres J. Schrader
Provision of study material or patients: Viktor Grünwald, Kristina I. Ringe, Christoph Seidel
Collection and/or assembly of data: Markus A. Kuczyk, Sandra Steffens, Viktor Grünwald, Kristina I. Ringe, Christoph Seidel, Hendrik Eggers
Data analysis and interpretation: Markus A, Kuczyk, Sandra Steffens, Kristina I. Ringe, Frank Wacker, Andres J. Schrader
Manuscript writing: Markus A, Kuczyk, Sandra Steffens, Andres J. Schrader
Final approval of manuscript: Andres J. Schrader
References
- 1.Chow WH, Dong LM, Devesa SS. Epidemiology and risk factors for kidney cancer. Nat Rev Urol. 2010;7:245–257. doi: 10.1038/nrurol.2010.46. [DOI] [PMC free article] [PubMed] [Google Scholar]
- 2.Chow WH, McLaughlin JK, Mandel JS, et al. Obesity and risk of renal cell cancer. Cancer Epidemiol Biomarkers Prev. 1996;5:17–21. [PubMed] [Google Scholar]
- 3.Lindblad P, Wolk A, Bergström R, et al. The role of obesity and weight fluctuations in the etiology of renal cell cancer: A population-based case-control study. Cancer Epidemiol Biomarkers Prev. 1994;3:631–639. [PubMed] [Google Scholar]
- 4.Calle EE, Rodriguez C, Walker-Thurmond K, et al. Overweight, obesity, and mortality from cancer in a prospectively studied cohort of U.S. adults. N Engl J Med. 2003;348:1625–1638. doi: 10.1056/NEJMoa021423. [DOI] [PubMed] [Google Scholar]
- 5.Wang YC, Colditz GA, Kuntz KM. Forecasting the obesity epidemic in the aging U.S. population. Obesity (Silver Spring) 2007;15:2855–2865. doi: 10.1038/oby.2007.339. [DOI] [PubMed] [Google Scholar]
- 6.Waalkes S, Merseburger AS, Kramer MW, et al. Obesity is associated with improved survival in patients with organ-confined clear-cell kidney cancer. Cancer Causes Control. 2010;21:1905–1910. doi: 10.1007/s10552-010-9618-2. [DOI] [PubMed] [Google Scholar]
- 7.Schrader AJ, Rustemeier J, Rustemeier JC, et al. Overweight is associated with improved cancer-specific survival in patients with organ-confined renal cell carcinoma. J Cancer Res Clin Oncol. 2009;135:1693–1699. doi: 10.1007/s00432-009-0616-2. [DOI] [PMC free article] [PubMed] [Google Scholar]
- 8.Choueiri TK, Xie W, Kollmannsberger CK, et al. The impact of body mass index (BMI) and body surface area (BSA) on treatment outcome to vascular endothelial growth factor (VEGF)-targeted therapy in metastatic renal cell carcinoma: Results from a large international collaboration [abstract 4524]. Presented at the 2010 American Society of Clinical Oncology Annual Meeting; June 4–8, 2010; Chicago, Illinois. [Google Scholar]
- 9.Xu C, Bing N, Ball HA, et al. Association of germ-line SNPs with overall survival (OS) in pazopanib-treated patients (Pts) with advanced renal cell carcinoma (RCC) [abstract 4558]. Presented at the 2011 American Society of Clinical Oncology Annual Meeting; June, 3–7, 2010; Chicago, Illinois. [Google Scholar]
- 10.Ladoire S, Bonnetain F, Gauthier M, et al. Visceral fat area as a new independent predictive factor of survival in patients with metastatic renal cell carcinoma treated with antiangiogenic agents. The Oncologist. 2011;16:71–81. doi: 10.1634/theoncologist.2010-0227. [DOI] [PMC free article] [PubMed] [Google Scholar]
- 11.Heaf JG. The origin of the 1 × 73-m2 body surface area normalization: Problems and implications. Clin Physiol Funct Imaging. 2007;27:135–137. doi: 10.1111/j.1475-097X.2006.00718.x. [DOI] [PubMed] [Google Scholar]
- 12.Health-Statistics. Key Data on Health 2002. Luxembourg: Office for Official Publications of the European Community; 2002. pp. 1–145. [Google Scholar]
- 13.Yoshizumi T, Nakamura T, Yamane M, et al. Abdominal fat: Standardized technique for measurement at CT. Radiology. 1999;211:283–286. doi: 10.1148/radiology.211.1.r99ap15283. [DOI] [PubMed] [Google Scholar]
- 14.Lowrance WT, Thompson RH, Yee DS, et al. Obesity is associated with a higher risk of clear-cell renal cell carcinoma than with other histologies. BJU Int. 2010;105:16–20. doi: 10.1111/j.1464-410X.2009.08706.x. [DOI] [PMC free article] [PubMed] [Google Scholar]
- 15.Moyad MA. Obesity, interrelated mechanisms, and exposures and kidney cancer. Semin Urol Oncol. 2001;19:270–279. [PubMed] [Google Scholar]
- 16.Baillargeon J, Rose DP. Obesity, adipokines, and prostate cancer (review) Int J Oncol. 2006;28:737–745. [PubMed] [Google Scholar]


