Abstract
Probing a sample using infrared spectroscopy following a laser-induced temperature jump is a powerful method to monitor fast relaxation kinetics. Here, we describe how this approach is used to study the kinetics of RNA folding. We begin with a concise summary of the infrared spectral properties of RNA in the 1500–1800 cm−1 region. The infrared transitions in this region are directly related to the double bond stretching vibrations and ring modes of the nucleotide bases. When RNA undergoes a conformational change, the local environments of the nucleotides are altered. Consequently, the changes in the corresponding infrared spectrum are associated with the structural changes. Experimentally, temperature is used to systematically vary the RNA structure. When a short laser pulse is used to produce a rapid temperature increase in the sample, the structural changes that ensue can be followed in real time. In this contribution, we discuss experimental methods including sample preparation, instrumentation, and data analysis. We conclude with several experimental examples that highlight usefulness of the technique.
1. Introduction
Most types of optical spectroscopy exhibit sensitivity to molecular structure. For example, UV–visible absorption and fluorescence spectroscopies are commonly used to monitor RNA folding and unfolding. What distinguishes infrared (IR) spectroscopy however, is its structural specificity. UV–visible and fluorescence spectra each typically display a single broad band, the intensity of which reports on the conformational changes of the RNA. In contrast, an IR spectrum displays numerous absorption bands, spanning a broad wavenumber range from 800 to 1800 cm−1. Each transition is due to specific structural moieties in the RNA. Collectively, there is an IR spectral signature for nearly every molecular group within an RNA molecule. In particular, the molecular groups involved in base pairing and stacking (C=O, C=N, and C=C of the individual bases) display strong IR absorptions in the 1500–1800 cm−1 range. When RNA structure changes, the local environments of the involved groups are altered (e.g., ionic strength, proximity to hydrogen bond donors or acceptors, etc.). Explicable changes in the corresponding IR spectrum result (intensity changes, band shifts, etc.) that reflect the local environmental change experienced by that group. The signal from each individual IR band provides comparable information to that found in a UV–visible or fluorescence spectrum. The difference is that an IR spectrum has multiple signals, each of which reports on a slightly different structural component of the RNA.
The utility of IR spectroscopy is illustrated by the following analogy. In a FRET (fluorescence resonance energy transfer) experiment, a fluorescent donor is attached to one end of the RNA while an acceptor is attached to the other end. The strength of the fluorescence signal is related to the distance between the donor and acceptor. Folding is monitored by observing this signal as a function of time. Similarly, spectral characteristics of fluorescent base analogs substituted at various positions along the chain can be used to track folding. In both cases, the results provide a global indicator of RNA conformation. While inferences can be made, the behavior of unlabeled residues or the residues between the FRET pair cannot be determined directly. Now, imagine that we can place “FRET pairs” all along an RNA oligomer or simultaneously label all of the residues (ignoring the fact that this would profoundly affect the structure). In addition, assume that the overlap between the individual spectral signals is marginal so that each can be distinguished. Now, when the RNA folds, we not only know when the ends approach one another, but we also have indicators that tell us when the proximities of other residues change. Taking the combined data together paints a very detailed picture of structural progression. The need for multiple probes to fully map the energy landscape of small RNAs has been recognized in several recent papers (Ballin et al., 2007; Hyeon and Thirumalai, 2008; Ma et al., 2008). In another paper, a reference is made to a hypothetical “dual fluorophore” quenching experiment where one fluorophore is placed in the loop and the other near the stem (Nivon and Shakhnovich, 2004). Since the intrinsic IR absorption bands of nucleic acids are structurally specific (described in Section 2), we can achieve the desired effect without the addition of nonnative probes that may ultimately alter the structure.
Experimentally, temperature is commonly used to bring about systematic structural changes in the RNA. To illustrate, consider the thermal equilibrium between a population of folded and unfolded RNA molecules, F ⇌ U (for now ignore the existence of intermediates), governed by the equilibrium constant Keq = cU/cF. It can be shown that the change in concentration of the folded population is related to a temperature change by (Bernasconi, 1976)
| (17.1) |
Here, c0 is the total concentration cF + cU, ΔH is the enthalpy of unfolding, and R is the gas constant. Accordingly, an increase in temperature will result in a decrease in the folded population, provided that the unfolding enthalpy is both nonzero and positive. Implicit in this equation is that the concentration changes are proportional to key IR absorptions bands. Thus, Eq. (17.1) provides the link between RNA structure and the observable IR spectrum. This equation also shows that the greatest changes will be observed when temperatures near the melting temperature (Tm) are studied (i.e., K ≈ 1).
If the temperature is changed suddenly (i.e., during a “temperature jump”), then it becomes possible to monitor ΔcF (or ΔcU) as a function of time. For this simple two-state example, the concentration as a function of time would show exponential behavior
| (17.2) |
(we have used Δc rather than ΔcF or ΔcU to be more general). The experimentally obtained quantity is the relaxation time, τ = (kF + kU)−1. Neither the folding rate, kF, nor the unfolding rate, kU, is determined directly. Strictly speaking, the experiment measures RNA “relaxation” rather than folding or unfolding.
2. Infrared Spectral Properties of RNA
2.1. Sensitivity to structure
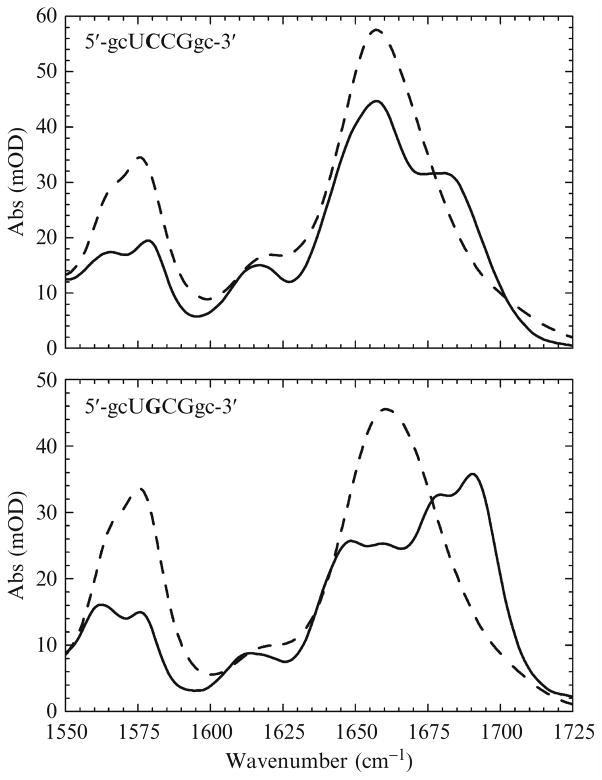
IR spectroscopy is extremely sensitive to RNA conformational changes and base sequence. This is illustrated in Fig. 17.1 using the IR spectra of two different RNA tetraloops. The lower panel shows IR spectra of 5′-gcUGCGgc-3′ (“HPG”) and the upper panel corresponds to 5′-gcUCCGgc-3′ (“HPC”). (The bases written in uppercase indicate the unpaired bases of the loop while those in lowercase are the bases that comprise the stem.) In each, the dashed line is the IR spectrum for the unfolded oligonucleotide (acquired at T ≫ Tm) while the solid line is for the corresponding folded conformation (acquired at T ≪ Tm). The spectral changes that develop as the hairpins fold are substantial. Furthermore, despite differing by only a single base in the loop, the folded spectra for each hairpin are very different (this will be explained later). By comparison, the UV–visible or fluorescence spectra of the same two hairpins would be practically indistinguishable whether folded or unfolded. This is an example of the structural sensitivity afforded by IR spectroscopy.
Figure 17.1.
Equilibrium FTIR spectra of two RNA tetraloops. The sequences are indicated in the figures. Bases written in uppercase are the unpaired bases found in the loop while those written in lowercase are the bases found in the stem. The dashed lines are spectra of the unfolded RNA and the solid lines are the folded spectra. Note the similarities between the two unfolded spectra and the differences between the folded spectra.
Since the IR spectrum of an RNA molecule has numerous features, IR spectroscopy is not limited to the determination of the fraction folded only. Depending upon the wavenumber of the transition, IR spectroscopy can distinguish A·U base pairs from G·C base pairs as well as the more complex base pairing schemes found in triple helices (Banyay et al., 2003; Brauns and Dyer, 2005). Similarly, base stacking interactions can be distinguished from base pairing interactions. It has even been shown that transfer RNAs of different species can be distinguished from their IR spectra (Thomas, 1969).
2.2. Spectral assignments
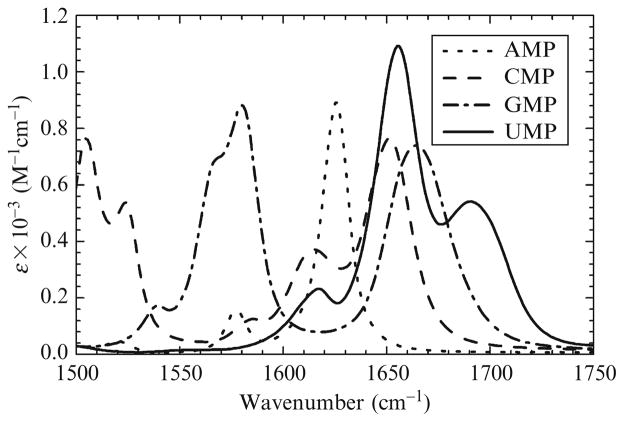
The IR spectra of RNA have a useful property that can be used to facilitate spectral interpretation as well as to more clearly illustrate spectral assignments. When fully unfolded, the IR spectrum of an RNA molecule is roughly equal to the sum of the contributions of its component nucleotides. For example, the IR spectrum of unfolded HPC would be approximately equal to AUMP + 3AGMP + 4ACMP. Figure 17.2 shows the IR spectra of the four mononucleotides and is provided as a visual aid to the reader for the description of the spectral assignments that follow.
Figure 17.2.
Equilibrium FTIR spectra of the four nucleotide bases. Band assignments are given in the text.
The following IR spectral assignments are taken from the same references or our own work (Banyay et al., 2003; Brauns and Dyer, 2005). Between 1678 and 1689 cm−1 is a transition due to the C6=O6 stretch of guanine that decreases in intensity and red shifts when duplexed with cytosine. There is a strong absorption band ~1655 cm−1 that is due to the C4=O4 stretch of uracil that decreases in intensity when it forms a base pair with adenine. Around ~1650 cm−1 lies a transition attributed to the C2=O2 stretch of cytosine. This band red shifts and decreases in intensity when involved in a base pair. The region between 1620 and 1632 cm−1 is dominated by a strong, narrow transition due to C=N and C=C ring vibrations of adenine. This band blue shifts and decreases in intensity when base paired. At ~1525 cm−1 is a cytosine in-plane ring vibration that drastically decreases in intensity when duplexed with guanine. Around ~1566 cm−1 is a transition that is due to a C=N ring vibration of guanine with contributions from a combination of C6=O6, C5–C6, and C4=C5 stretches (all guanine). Near ~1584 cm−1 is an additional very weak in-plane ring vibration of cytosine. Finally, a second C=N vibration of guanine lies between 1575 and 1590 cm−1 that decreases when base paired. To some degree, all of these transitions are also sensitive to base stacking interactions, in particular, the ring vibrations.
The preceding assignments can be used to interpret the spectra shown in Fig. 17.1. In the unfolded state, interbase interactions are negligible and the spectral differences between the two hairpins are solely due to base composition. Hence, the slight differences between the unfolded spectra shown in Fig. 17.1 are simply because HPG has more guanine and less cytosine. Likewise, HPC has more cytosine and less guanine. However, in the folded state, interbase interactions are abundant and structural differences between the hairpins manifest in the spectra.
2.3. Thermodynamics
Plotting the absorption at a specific wavenumber as a function of temperature produces a melt curve. By fitting the curves to a mathematical model, the melting temperature and other thermodynamic parameters can be determined. In the equilibrium limit, folding exhibits two-state behavior and the fraction unfolded fU at any temperature is related to the absorption by
| (17.3) |
where AU is the absorbance of the unfolded RNA and AF is the absorbance of the folded RNA. Equation (17.3) provides a phenomenological model that describes the temperature dependence of the absorption. Equation (17.3) is related to the equilibrium constant by
| (17.4) |
The equilibrium constant can then be written in terms of the Gibbs free energy according to
| (17.5) |
Finally, the enthalpy of unfolding ΔH and melting temperature Tm are obtained from the temperature dependence of the Gibbs energy, given by the Gibbs–Helmholtz equation
| (17.6) |
Equation (17.6) also provides a way to measure the change in heat capacity ΔCp between the folded and unfolded states. By combining the previous relationships, the raw melt curves are fit directly to
| (17.7) |
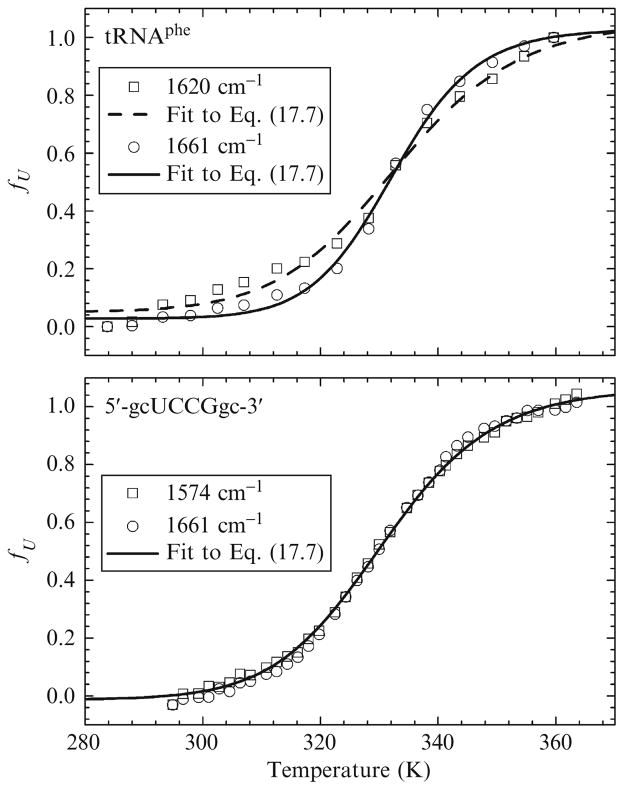
In this expression, AU, AF, ΔH(T), ΔCp, and Tm are all fitting parameters. Once the raw data has been fit, the curves can be “normalized” for comparison by converting the absorbance data to fraction unfolded using Eq. (17.3). Examples are shown in Fig. 17.3.
Figure 17.3.
Melt curves for the indicated RNAs. All data have been normalized by converting them to the fraction unfolded fU using Eq. (17.3).
Determining ΔCp from optical melting experiments warrants further discussion. While calorimetric methods measure heat capacity directly, spectroscopic data is fit to a model function that includes ΔCp as a fitting parameter. Imposing a two-state model on a non-two-state system is a potential source of error. One way to “circumvent” this is to make the assumption that ΔCp is negligible and simply ignore it. Although this is frequently done, doing so is not completely justifiable (Mikulecky and Feig, 2004). Changes in solvent and electrostatic environments when RNA folds can result in heat capacity differences between the two different states. The alternative is to proceed with the fit and accept the possibility of error. In principle, this is the preferred choice since the error will likely be small. However, as we will explain in the next section, this must be done cautiously.
The goal of curve fitting is to obtain a single set of fit parameters that uniquely describes the data. An overparameterized model can jeopardize the reliability of the fit and give ambiguous results. One solution is to reduce the number of parameters by holding ΔCp constant at zero. As we described previously, this may sacrifice a bit of accuracy. However, the reliability of the fit is increased substantially and general conclusions can still be drawn. This is acceptable provided that the assumption is stated up front. The melt curves in the lower part of Fig. 17.3 were fit this way. Alternatively, the full model can be used, with additional steps taken to ensure the validity of the results. An example is shown in the upper part of Fig. 17.3. Here, the experiments were repeated multiple times (minimizing the measurement error), the data were fit simultaneously (using a global fitting algorithm), and the results were corroborated using a separate singular value decomposition analysis.
In the lower panel of Fig. 17.3 are melt curves for HPC at 1574 cm−1 (squares) and 1661 cm−1 (circles). The upper panel shows melt curves for tRNAphe at 1620 cm−1 (squares) and 1661 cm−1 (circles). For HPC (lower), these wavenumbers correspond to base stacking (1574 cm−1; ring vibrations) and base pairing (1661 cm−1; G·C pairing). The melt curves (and subsequent thermodynamics) are virtually identical. It will be shown later, however, that the kinetics at the two different wavenumbers are very different. The wavenumbers for the tRNA (upper) correspond to A·U base pairing (1620 cm−1) and GC base pairing (1661 cm−1). Unlike the oligonucleotide, the melt curves for tRNA are different at each wavenumber. The differences were verified using a much more rigorous analysis that included singular value decomposition (Brauns and Dyer, 2005). Different melt curves imply that the thermodynamics are also different. We were able to use this result in conjunction with the relaxation kinetics to suggest a parallel pathway folding mechanism for tRNA.
2.4. Practical considerations
Because of the strong IR absorption of H2O in the 1500–1800 cm−1 region, all experiments must be carried out in D2O solutions. Still, even in D2O, there is a nonnegligible absorption in our spectral window of interest. The strong residual absorption necessitates the use of thin optical path lengths. A path length of ~50 μm has been shown to be optimal (Venyaminov and Prendergast, 1997). However, thin path lengths further require that the sample be present at a relatively high concentration. The molar absorbtivity of RNA in the 1500–1800 cm−1 region is roughly 700 M−1 cm−1 (per nucleotide). This estimate is an average of the peak absorptivities from a number of samples over a range of temperatures. It is an approximation only, and should be treated as such. Using this value, an absorption between 0.01 and 0.1 requires mononucleotide concentrations between ~3 and 30 mM. Anything lower, and the signal would simply be too weak to be practical. On the other hand, higher concentrations should be avoided since this would increase the likelihood of dimer formation (or aggregation in general). This is especially true for oligonucleotides.
3. Experimental Methods
3.1. Samples and sample preparation
For practical reasons, samples are initially prepared in H2O solutions and then deuterated prior to performing experiments. High purity, deionized water is always used. A buffer is chosen with the only stipulation being that it does not interfere with the IR spectrum of the RNA. We typically use phosphate or Tris buffers at pH 7.2 (upon deuteration, the solution becomes slightly more basic with a pD = ~ 7.6 at 25 °C). Depending upon the nature of the experiment, buffer concentrations in the 1–100 mM range are used. Additional salts (e.g., Na+, Mg2+) can also be added in accordance with a particular experiment.1 Usually two buffers are prepared: a primary (containing EDTA at 0.1 mM) and a secondary (no EDTA). Samples are prepared by first dissolving them in the primary buffer. The EDTA is used to sequester tightly bound divalent cations such as Mg2+. This is followed by dialysis against the secondary buffer that removes the EDTA from the sample (the carbonyls of EDTA could interfere with the sample spectra).
Once the dialysis is complete, a known volume is lyophilized at least three times against D2O to remove the labile protons. To avoid contamination from atmospheric H2O, the samples are handled in a makeshift “glovebox” (a Plexiglas case that is purged with dry air, but not sealed from the surroundings). This precaution seems to be more than sufficient to guard against contamination. The final step is the degassing of the sample to guard against cavitation artifacts in the temperature jump (T-jump) experiments (explained later). We degas the sample by placing it under a mild vacuum for up to 15 min with occasional agitation.
3.2. Sample cells
Reliable comparison between the two experimental methods (T-jump and equilibrium FTIR) is facilitated by using the same cells for both. The cells are a custom design comprised two CaF2 windows separated by a Teflon spacer. The spacer defines the optical path length and also divides the cell into two compartments; one for the sample (RNA and buffer) and one for the reference (buffer alone). In this way, sample and reference measurements are obtained by simply translating the cell from side to side. Path lengths are typically ~50 μm. The CaF2 windows are placed in a copper housing. The windows are secured by fastening a copper faceplate to the housing. The relative path lengths of the sample and reference compartments are determined by measuring interference fringes in an empty cell. If the path length variation between each side of the cell exceeds ±0.1 μm, the cell is dismantled and reassembled until the desired tolerance is met. The cell is then mounted on a larger copper block that is coupled to a circulating water bath for temperature control. The cell temperature is maintained to within ±0.1 °C.
3.3. FTIR spectroscopy
Equilibrium FTIR spectra are recorded using a commercial rapid scanning interferometer coupled to a custom made sample chamber. The copper block with affixed cell is mounted to a computer-controlled translation stage and placed in the sample chamber. The chamber is purged with dry air for a minimum of 3 h prior to collecting spectra. The computer-controlled stage allows sample and reference spectra to be recorded without compromising the sample compartment purge. To obtain an acceptable signal-to-noise level, a single spectrum may require up to ~512 coadded scans (256 scans for the reference and 256 scans for the sample). Rather than recording 256 scans for the reference followed by 256 sample scans, the cell is translated back and forth so that sample and reference spectra are recorded alternately. This is done to minimize any long-term baseline drift. Temperature-dependent spectra are usually recorded at 1 °C increments from 20 to 90 °C. A LabVIEW program has been written that automates the collection of temperature-dependent spectra. This is advantageous considering that a full melt profile can take up to 18 h to complete.
3.4. Time-resolved spectroscopy
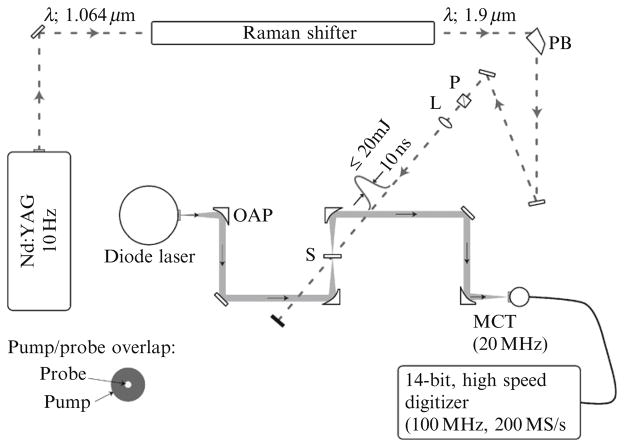
Time-resolved spectroscopy is performed using a pump-probe method in which a short-pulsed laser is used to initiate a T-jump and a mid-IR probe laser is used to monitor the transient IR absorbance in the sample. A schematic of the entire instrument is shown in Fig. 17.4. For clarity, only key components are shown. In the description that follows, only those components will be described. A continuous-wave (CW) lead-salt (PbSe) diode laser (output power <1 mW) tuned to a specific vibrational mode of the RNA molecule probes the transient absorbance of the sample. The linewidth of the probe laser is quite narrow (<0.5 cm−1) and sets the spectral resolution of the time-resolved experiments. The divergent output of the diode laser is collected and collimated by a gold coated off-axis parabolic mirror (OAP) (off-axis angle, 90°; parent focal length, 25.4 mm; effective focal length, 50.8 mm). The mirror is mounted to a kinematic mount, which is in turn mounted to a three-axis linear translation stage for precise alignment control. The collimated probe diameter is ~1 cm and is focused tightly on the sample (diameter <100 μm) using a second OAP. The transmitted probe beam is collected by a third OAP and finally focused onto a 20 MHz MCT detector (~15 ns rise time) using a fourth OAP.
Figure 17.4.
Schematic of the T-jump spectrometer described in the text. OAP, off-axis parabolic mirror; PB, Pellin–Broca prism; P, polarizer; L, lens; S, sample; MCT, mercury cadmium telluride detector. The size of the pump relative to the probe at the point of overlap is shown in the lower left corner.
The T-jump pulse is generated by Raman shifting the fundamental output of a Q-switched Nd:YAG laser (λ = 1.064 μm) in a 1-m-long Raman cell filled with H2 at ~500 psi. The laser operates at a repetition rate of 10 Hz and has a pulse temporal width of <10 ns (FWHM). The Stokes shift in H2 is 4155 cm−1. As a result, the first Stokes line is at a wavelength of 1.9 μm that is partially absorbed by the D2O solvent, and thus serves as the T-jump pulse. A Pellin–Broca prism is used to separate the 1.9 μm radiation from the remaining Stokes, anti-Stokes, and residual Rayleigh radiation. The T-jump pulse is carefully overlapped with the probe laser at the sample. A long focal length lens (f = 250 mm) is used to adjust the diameter of the T-jump pulse. At the point of overlap, the pump diameter should be roughly five times the diameter of the probe beam (this is shown in the lower left corner of Fig. 17.4). This assures that the entire probe volume experiences uniform heating and also minimizes the effects of any beam drift.
D2O has an absorption band centered around 1.9 μm that corresponds to the first vibrational overtone. The D2O transmits 75–80% of the T-jump pulse in a cell with a 50 μm path length. The energy from the fraction that is absorbed produces the T-jump. The specific heat capacity of D2O is 4.22 J K−1 g−1. Assuming 20% absorption and a sample volume of 3.9 × 10⁻⁵ mL, one can calculate that ~20 mJ of 1.9 μm radiation is required to generate a ~20 °C T-jump. Since the thermal equilibration of the aqueous solvent occurs on a picosecond time scale, the T-jump is virtually instantaneous when induced by a 10 ns laser pulse. Hence, the time resolution of the experiment is limited by the laser pulse width and/or the detector rise time (~20 ns for the instrument described here). Prior to collecting time-resolved data, the temperature dependence of the probe beam transmission through the reference side of the cell is measured. Using these data, the transient absorption of the probe through the reference serves as an internal thermometer to measure the magnitude of the T-jump.
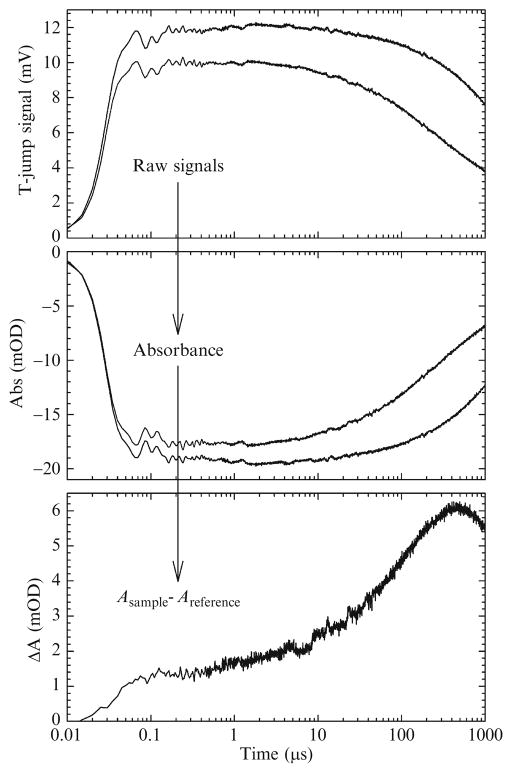
The arrival of the T-jump pulse defines t = 0 and triggers data collection. The transient absorption profile subsequent to the T-jump is detected by the MCT detector described above. The resulting waveform from 0 to 1.4 ms is digitized at 5 ns intervals by a 14-bit high-speed digitizer (100 MHz bandwidth, 200 MS s−1). Each waveform is usually averaged over ~3000 laser shots depending upon the signal strength. The time-dependent absorption is calculated for each sample/reference pair from the digitized MCT signal. Finally, the time-resolved absorbance of the sample is obtained by subtracting the reference absorption from the sample absorption. Figure 17.5 shows this procedure graphically.
Figure 17.5.
Example of kinetic data. The digitized MCT signals (top; gray is the sample and black is the reference) are converted to absorbance (middle) then the reference absorbance is subtracted from the sample absorbance (bottom).
Digitizing the waveforms at 5 ns increments over nearly 6 decades yields in excess of 260,000 data points. This has two drawbacks. One is that it is simply inconvenient; the excessive number of data points is cumbersome and impedes data analysis and display. The second drawback has a more important consequence. Digitizing a long time span in small intervals leads to unnecessary point density at longer times. For example, at t = 25 ns, the next point would be at 30 ns. However, at t = 500 μs, the next point would be at 500.005 μs. Aside from being impractical, subsequent data analysis is heavily weighted toward longer times and could lead to misleading results. We circumvent this by interpolating the raw data (e.g., the data in the upper plot of Fig. 17.5) using a logarithmically spaced time axis.2 Using this method, we reduce the number of data points to 3004. Before proceeding, we verify that the interpolated data exactly overlays the original data.
A possible complication that can arise in a T-jump experiment is “cavitation” (Wray et al., 2002). Cavitation is a photoacoustic phenomenon where bubbles in the fluid medium can be produced in response to the rapid rise in temperature. When this occurs, artifacts between 0.1 and 1 μs manifest, rendering the data in this region unusable. Our experience is that cavitation can be controlled by ridding the sample cells and sample solutions of nucleation sites for bubble growth. The use of high quality, scrupulously clean CaF2 windows, sample degassing, and filtration of particulates from sample solutions greatly diminishes (to the point of eliminating) the occurrence of cavitation events. Using this technique we can achieve T-jumps up to 20 °C without complications. In addition, cavitation superimposes distinct features on the data. Thus, a simple filter algorithm in the data collection software can be used to remove any contaminated transients in the event that cavitation does occur.
4. Examples
4.1. T-jump IR measurements of tRNA
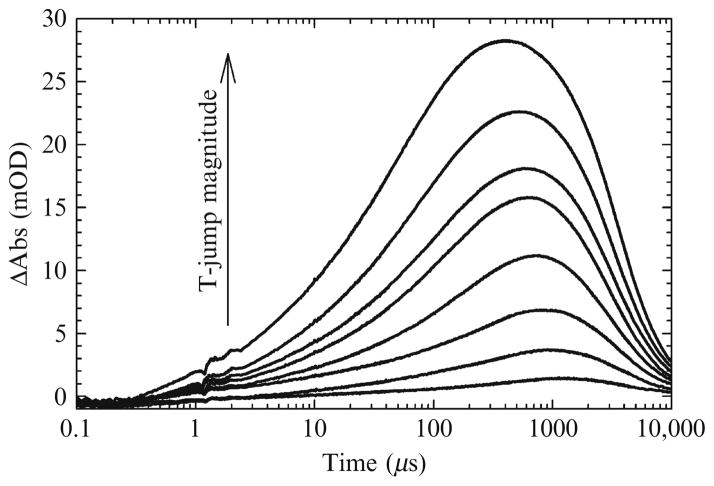
Several groups have used the laser-induced T-jump technique to study nucleic acid folding (Ansari et al., 2001; Dewey and Turner, 1980; Kuznetsov et al., 2008; Ma et al., 2006). However, the first T-jump IR measurements on RNA were carried out by us (Brauns and Dyer, 2005). This section briefly summarizes that work. The melting curves for tRNAphe at two different IR frequencies were shown previously in Fig. 17.3. Although the thermodynamic parameters for the two were shown to be statistically different, their melting temperatures are the same, ~58.5 °C. T-jump experiments were performed by holding the initial temperature constant at 47 °C where >98% of the total population is folded. Transient absorption profiles were recorded for both probe frequencies over a range of T-jump magnitudes up to a maximum 20 °C jump. A plot showing a series of transient absorptions recorded at 1661 cm−1 is shown in Fig. 17.6 (qualitatively, the data at 1620 cm−1 show the same behavior).
Figure 17.6.
A series of transient absorptions recorded at 1661 cm−1 for tRNAphe. Qualitatively, the data at 1620 cm−1 are the same. The initial temperature was held constant at 47 °C and the magnitude of the T-jump was varied up to a maximum of 20 °C. Each transient was fit to a three exponential model from t = 100 ns to the maximum transient absorption (t = ~ 1 ms).
The transients were all fit to an exponential model from t = 100 ns to t = ~ 1 ms, using
| (17.8) |
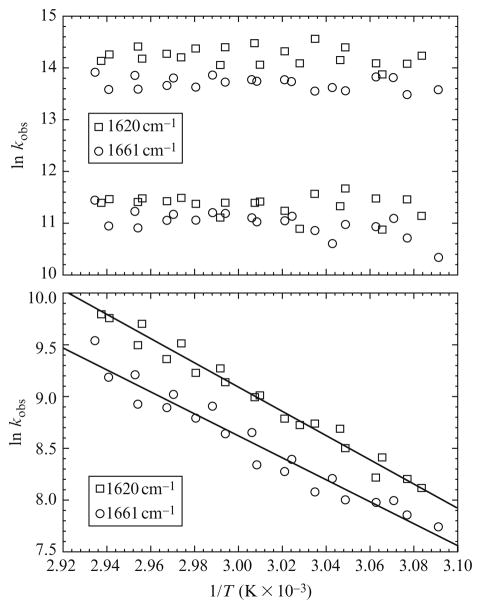
(The long time limit was chosen to be the time where the transient absorption reaches a maximum.) We observe three relaxation processes (i.e., N = 3). The kinetic phases are well separated in time, spanning hundreds of nanoseconds to hunderds of microseconds. The amplitudes contribute more or less equally to the total decay, the slowest phase contributing the least. What is particularly interesting, however, is that the relaxation times for the 1620 cm−1 data are faster than those at 1661 cm−1. This is easily seen in Fig. 17.7 where the observed rate constants (1/τ = kobs = kF + kU) for each phase are plotted in Arrhenius coordinates (i.e., ln kobs vs. 1/T). The activation enthalpy ΔH‡ can then be determined from the slope according to
Figure 17.7.
Arrhenius plots of the tRNA T-jump data at 1620 cm−1 (squares) and 1661 cm−1 (circles). The upper plot shows the fast and intermediate phases. These correspond to nonactivated processes. The lower plot shows the slow phase. In addition to corresponding to an activated process, the kinetics at 1620 cm−1 is faster than those at 1661 cm−1.
| (17.9) |
The constant is the y-axis intercept and is related to the preexponential factor.
The activation barrier for the slow phase and its average relaxation time suggest that we are observing base pair formation. The fact that the relaxation recorded at 1620 cm−1 is slightly faster than the relaxation at 1661 cm−1 is not surprising. The former corresponds to A·U base pairs which are weaker than their G·C counterparts. On the other hand, the activation barriers for the fast and intermediate relaxations are approximately zero. This implies that the barrier is mostly entropic.
From these data we proposed a parallel pathway folding model to describe tRNA folding. According to our model, the unfolded tRNA is partitioned into two similar (but distinctly different) structural ensembles. Each ensemble folds via a separate pathway; both converging at the native state. The rate limiting step in each is the initial collapse of the unfolded states into compact (but misfolded) intermediates. Following this collapse, the misfolded intermediates undergo fast, localized reorganizations where nonnative interactions are broken and native contacts are formed.
4.2. T-jump IR measurements of tetraloop formation
More recently, we have begun studying the fast relaxation kinetics of small RNA tetraloops (Stancik and Brauns, 2008). The structures of small RNA tetraloops are deceptively simple. At first glance, one might be inclined to expect loop formation to follow a two-state model. However, recent results (including our own work) have shown that this is not the case (Ma et al., 2006; Moody et al., 2004; Proctor et al., 2004; Siegfried et al., 2007). We are particularly interested in the conserved tetraloop sequence, UNCG. The oligonucleotides introduced earlier, HPC and HPG, are members of this group (N=C and N=G). The short, two base pair stem is chosen so that the oligonucleotides will melt at lower temperatures allowing fully denaturing conditions to be achieved.
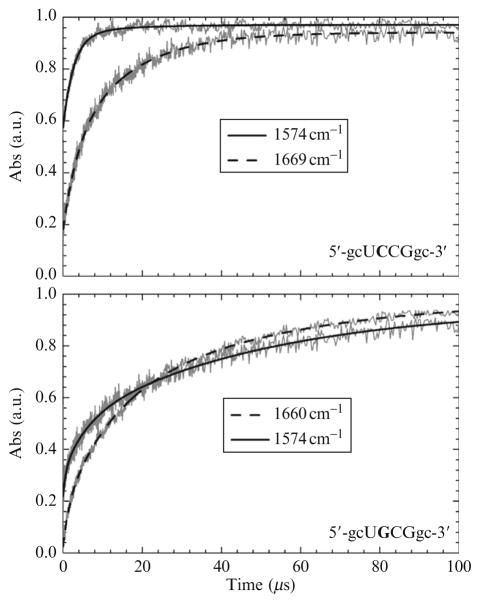
Kinetic data for these tetraloops are shown in Fig. 17.8. The kinetics for each was probed at two different probe frequencies following a 10 °C T-jump. Prior to the T-jump, both samples were equilibrated at their respective melting temperatures (58 °C for HPC and 60 °C for HPG). The melting data for HPG are not shown. Qualitatively, two features of the data are particularly noteworthy: (1) Each sequence displays very different relaxation kinetics. For example, the overall relaxation for HPC is quite a bit faster than the relaxation for HPG. Additionally, the kinetic traces for HPC are both fit to biexponential functions while those for HPG are fit to a triexponential function. (2) The kinetics for each depend on the probe wavenumber. For example, in both cases, the overall relaxation rate is faster when the kinetics is probed at 1574 cm−1 than at the higher probe wavenumber (for HPC, the difference is substantial).
Figure 17.8.
Transient absorption profiles for the indicated oligonucleotides. The absorbance has been normalized to facilitate direct qualitative comparison.
The implication from (1) above is that a single base substitution is sufficient to significantly alter the folding landscape. Two possibilities (or a combination of both) can explain the second feature from above. One is that the wavenumber-dependent kinetics highlights sequential events. The lower probe wavenumber (1574 cm−1) is due almost entirely to ring vibrations of guanine while the higher probe wavenumber is due mainly to guanine carbonyl stretch. Chronologically, base stacking interactions would precede the formation of base pair hydrogen bonds. The lower wavenumber kinetics is faster because the absorption at 1574 cm−1 is more sensitive to stacking interactions while the higher wavenumber is a direct measure of hydrogen bonding. An alternative explanation is that there is more than one folding population and that the wavenumber dependence arises due to the differential absorption of each. The latter scenario is similar to what was observed for tRNAphe.
The results from HPG are relatively new and still under investigation. However, the kinetic results for HPC have been analyzed in greater detail and have been published. For the sake of illustration, we will briefly summarize those findings. The consensus view is that the ruggedness of the energy landscape is due to misfolded structures (on or off pathway). However, almost invariably, misfolding is attributed to partial or incorrect stem contacts. In a small hairpin such as HPC, there are not enough degrees of freedom to access a wide variety of stem structures. Despite this, multi-exponential kinetics are observed. Since misfolding in the stem is insufficient to explain the folding complexity, we postulate that loop interactions and/or single strand stacking fluctuations also contribute to the overall folding complexity. It is already known that the earliest stages of hairpin folding involve base stacking. However, our results provide more detail. Before the chain can collapse permitting loop closure, the stacks rearrange leading to partial conformational ordering. With the bases properly oriented relative to their neighbors, the chain can collapse and zipping of the stem base pairs can occur. We justify our conclusion based on the probe frequency dependence of the kinetics in conjunction with activation parameters (data not shown). Our conclusions are similar to the recent findings of Zewail and coworkers (Ma et al., 2008). They refer to these intermediates as “labile in destacking but compact in nature.”
5. Conclusions
IR spectroscopy is extremely sensitive to RNA conformational changes. The IR spectrum of an RNA molecule exhibits many absorption transitions, each of which can be assigned to a specific molecular group of the RNA. If considered individually, each transition would provide a useful metric to monitor conformational changes. However, it is the ability to monitor the collective response of several transitions simultaneously that is unique to IR spectroscopy. Doing so allows for a more detailed analysis of structural changes. Moreover, folding kinetics can be studied by monitoring the IR spectrum as a function of time following a rapid laser-induced T-jump.
Footnotes
If the sample contains Mg2+ then Tris buffer must be used since MgPO4 will form a precipitate in aqueous solutions.
An alternative approach that we have also employed is to use a digitizer that can change the digitization interval “on the fly.”
References
- Ansari A, Kuznetsov SV, Shen Y. Configurational diffusion down a folding funnel describes the dynamics of DNA hairpins. Proc Natl Acad Sci USA. 2001;98:7771–7776. doi: 10.1073/pnas.131477798. [DOI] [PMC free article] [PubMed] [Google Scholar]
- Ballin JD, Bharill S, Fialcowitz-White EJ, Gryczynski I, Gryczynski Z, Wilson GM. Site-specific variations in RNA folding thermodynamics visualized by 2-aminopurine fluorescence. Biochemistry. 2007;46:13948–13960. doi: 10.1021/bi7011977. [DOI] [PMC free article] [PubMed] [Google Scholar]
- Banyay M, Sarkar M, Gräslund A. A library of IR bands of nucleic acids in solution. Biophys Chem. 2003;104:477–488. doi: 10.1016/s0301-4622(03)00035-8. [DOI] [PubMed] [Google Scholar]
- Bernasconi CF. Relaxation Kinetics. Academic Press; New York: 1976. [Google Scholar]
- Brauns EB, Dyer RB. Time-resolved infrared spectroscopy of RNA folding. Biophys J. 2005;89:3523–3530. doi: 10.1529/biophysj.105.061531. [DOI] [PMC free article] [PubMed] [Google Scholar]
- Dewey TG, Turner DH. Laser temperature jump study of solvent effects on poly(adenylic acid) stacking. Biochemistry. 1980;19:1681–1685. doi: 10.1021/bi00549a025. [DOI] [PubMed] [Google Scholar]
- Hyeon C, Thirumalai D. Multiple probes are required to explore and control the rugged energy landscape of RNA hairpins. JACS. 2008;130:1538–1539. doi: 10.1021/ja0771641. [DOI] [PubMed] [Google Scholar]
- Kuznetsov SV, Ren CC, Woodson SA, Ansari A. Loop dependence of the stability and dynamics of nucleic acid hairpins. Nucleic Acids Res. 2008;36:1098–1112. doi: 10.1093/nar/gkm1083. [DOI] [PMC free article] [PubMed] [Google Scholar]
- Ma H, Proctor DJ, Kierzek E, Kierzek R, Bevilacqua PC, Gruebele M. Exploring the energy landscape of a small RNA hairpin. JACS. 2006;128:1523–1530. doi: 10.1021/ja0553856. [DOI] [PubMed] [Google Scholar]
- Ma H, Wan C, Wu A, Zewail AH. DNA folding and melting observed in real time redefine the energy landscape. Proc Natl Acad Sci USA. 2008;104:712–716. doi: 10.1073/pnas.0610028104. [DOI] [PMC free article] [PubMed] [Google Scholar]
- Mikulecky PJ, Feig AL. Heat capacity changes in RNA folding: Application of perturbation theory to hammerhead ribozyme cold denaturation. Nucleic Acids Res. 2004;32:3967–3976. doi: 10.1093/nar/gkh723. [DOI] [PMC free article] [PubMed] [Google Scholar]
- Moody EM, Feerrar JC, Bevilacqua PC. Evidence that folding of an RNA tetraloop hairpin is less cooperative than its DNA counterpart. Biochemistry. 2004;43:7992–7998. doi: 10.1021/bi049350e. [DOI] [PubMed] [Google Scholar]
- Nivon LG, Shakhnovich EI. All-atom Monte Carlo simulation of GCAA RNA folding. J Mol Biol. 2004;344:29–45. doi: 10.1016/j.jmb.2004.09.041. [DOI] [PubMed] [Google Scholar]
- Proctor DJ, Ma H, Kierzek E, Kierzek R, Gruebele M, Bevilacqua PC. Folding thermodynamics and kinetics of YNMG RNA hairpins: Specific incorporation of 8-bromoguanosine leads to stabilization by enhancement of the folding rate. Biochemistry. 2004;43:14004–14014. doi: 10.1021/bi048213e. [DOI] [PubMed] [Google Scholar]
- Siegfried NA, Metzger SL, Bevilacqua PC. Folding cooperativity in RNA and DNA is dependent on position in the helix. Biochemistry. 2007;46:172–181. doi: 10.1021/bi061375l. [DOI] [PubMed] [Google Scholar]
- Stancik AL, Brauns EB. Rearrangement of partially ordered stacked conformations contributes to the rugged energy landscape of a small rna hairpin. Biochemistry. 2008;47:10834–10840. doi: 10.1021/bi801170c. [DOI] [PubMed] [Google Scholar]
- Thomas GJ., Jr Determination of the base pairing content of ribonucleic acids by infrared spectroscopy. Biopolymers. 1969;7:325–334. doi: 10.1002/bip.1969.360070305. [DOI] [PubMed] [Google Scholar]
- Venyaminov S Yu, Prendergast FG. Water (H2O and D2O) molar absorptivity in the 1000–4000 cm−1 range and quantitative infrared spectroscopy of aqueous solutions. Anal Biochem. 1997;248:234–245. doi: 10.1006/abio.1997.2136. [DOI] [PubMed] [Google Scholar]
- Wray WO, Aida T, Dyer RB. Photoacoustic cavitation and heat transfer effects in the laser-induced temperature jump in water. Appl Phys B. 2002;74:57–66. [Google Scholar]


