

Abstract
Met is the transmembrane tyrosine kinase cell surface receptor for Hepatocyte Growth Factor (HGF) and is related to the insulin receptor (INSR) tyrosine kinase. Here we report that the HGF–Met axis controls metabolism by stimulating hepatic glucose uptake and suppressing hepatic glucose output. We show that Met is essential for an optimum hepatic insulin response; Met exerts this by virtue of directly engaging the insulin receptor (INSR) in a Met–INSR hybrid complex. We found that the HGF–Met system restores insulin responsiveness in a mouse model of insulin refractoriness. The results provide new insights into the molecular basis of hepatic insulin resistance and suggest that HGF may have therapeutic potential in the clinical setting of type 2 diabetes.
Keywords: Met, HGF, HGFR, insulin receptor, IRS, insulin resistance, type 2 diabetes, glucose metabolism
INTRODUCTION
Hepatocyte Growth Factor (HGF) was originally discovered based on its ability to stimulate primary cultures of hepatocytes to undergo DNA synthesis1 and was subsequently identified as the ligand for Met (a.k.a., HGF receptor)1–5. In the liver, HGF is expressed and stored by specialized non-parenchymal cells known as the fat-storing stellate cells; HGF acts in a paracrine fashion on hepatocytes, which express the HGF receptor (Met) but do not express this ligand. Like the insulin receptor, Met is a heterodimer consisting of an alpha and a beta subunit held together by disulfide bonds and is the closest to INSR as far as overall structural and sequence similarity in the kinase domain as compared to any other RTK subclass6. No significant sequence homology exists between the extracellular domains of Met and INSR or their ligands HGF and insulin, respectively. In the kinase domain, Met and INSR possess a kinase regulatory loop which in Met is composed of Tyr1230-Asp-Lys-Glu-Tyr1234-Tyr1235 and in INSR of Tyr1146-Glu-Thr-Asp-Tyr1150-Tyr1151. Phosphorylation of the triple tyrosine sites is essential for upregulation of the catalytic activity of these two kinases7. Notably, neither Ron tyrosine kinase receptor, which is the closest relative of the Met receptor, nor EGFR family members, resemble INSR in its kinase regulatory loop with respect to the triple Tyr residues (Supplementary Figure 1). We therefore hypothesized that cellular signals emanating from the HGF–Met axis functionally overlap with those of the insulin–INSR system, including ones that control hepatic glucose metabolism, and that direct interplay between Met and INSR exists.
RESULTS
HGF and insulin recruit IRS to Met and INSR
We first performed glucose uptake and glycogen synthesis assays using normal primary cultures of rodent and human hepatocytes as well as hepatocytic cell lines such as HepG2 and Hepa1-6. HGF significantly stimulated glucose uptake and glycogen synthesis to the same extent as that elicited by insulin (Fig. 1a). Insulin and HGF synergistically stimulated glucose uptake when a minimal dose of insulin was used (Fig. 1a). Two particular insulin receptor substrate (IRS) proteins called IRS1 and IRS28–11 are known to be recruited to INSR in response to insulin and mediate glucose metabolism. HGF caused rapid recruitment of IRS1 and -2 to Met within 5 min. (Fig. 1b). EGF (Epidermal Growth Factor), a potent activator of hepatocyte proliferation, had no such effects (Fig. 1b). Notably, insulin treatment resulted in association of the IRS proteins with Met (Fig. 1b). Conversely, stimulation with HGF led to engagement of INSR with IRS2 as did insulin (Fig. 1c). Association of IRS proteins with Met was accompanied by their robust tyrosine phosphorylation which was pronounced by 5 min. of HGF treatment (Supplementary Figure 2, see also Fig. 1d).
Figure 1. HGF–Met stimulates hepatocyte glucose uptake via crosstalk with INSR.
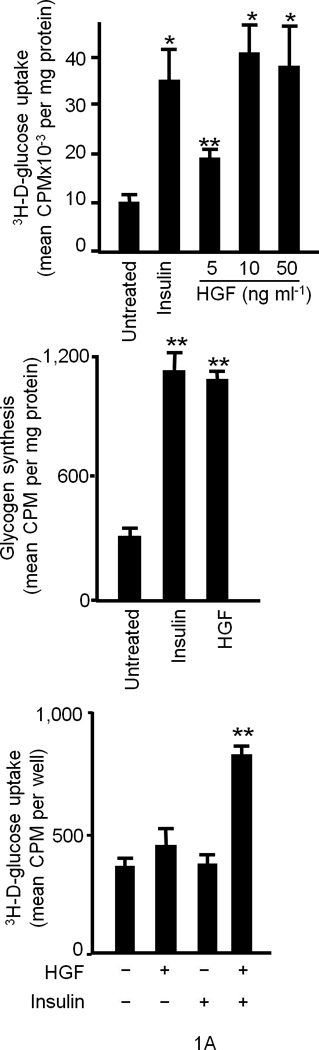
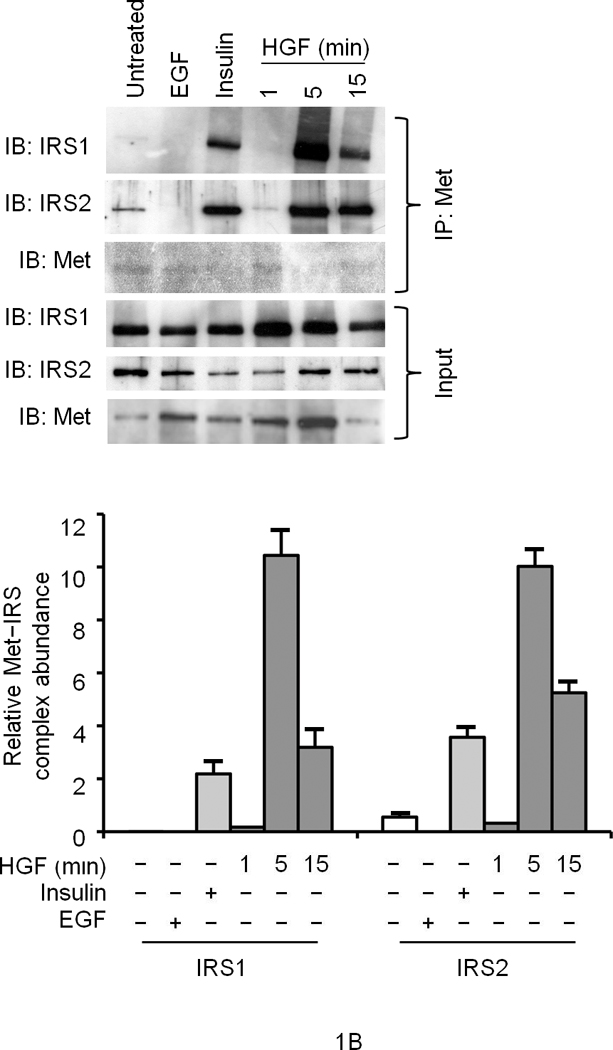
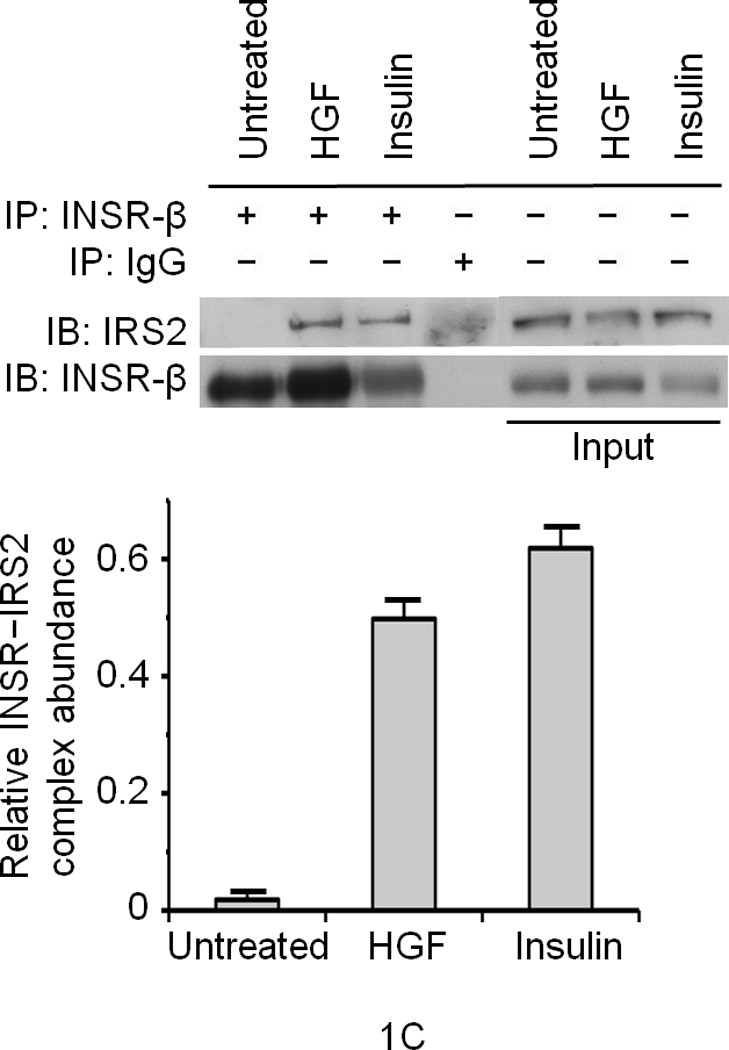
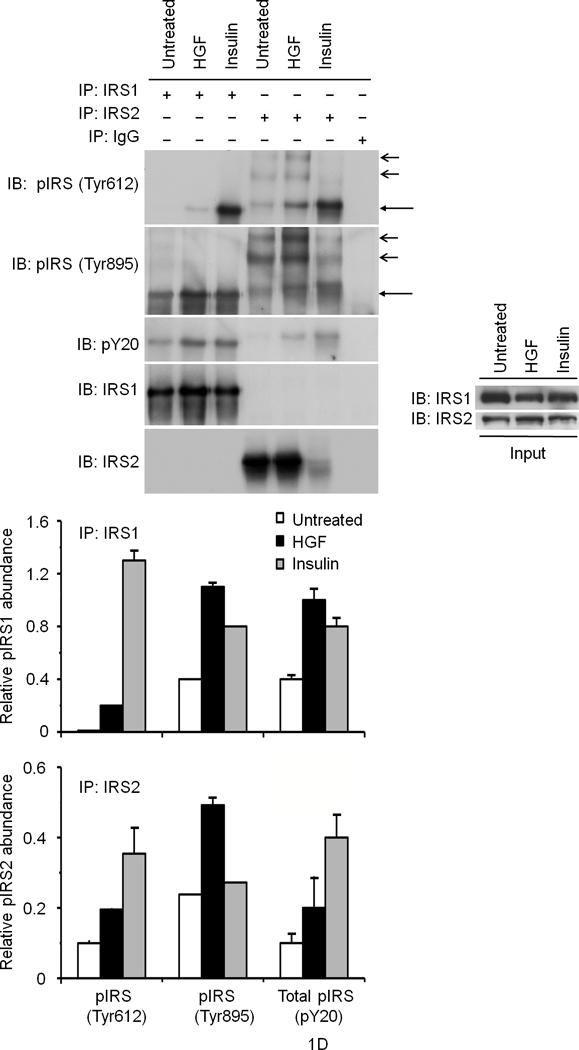
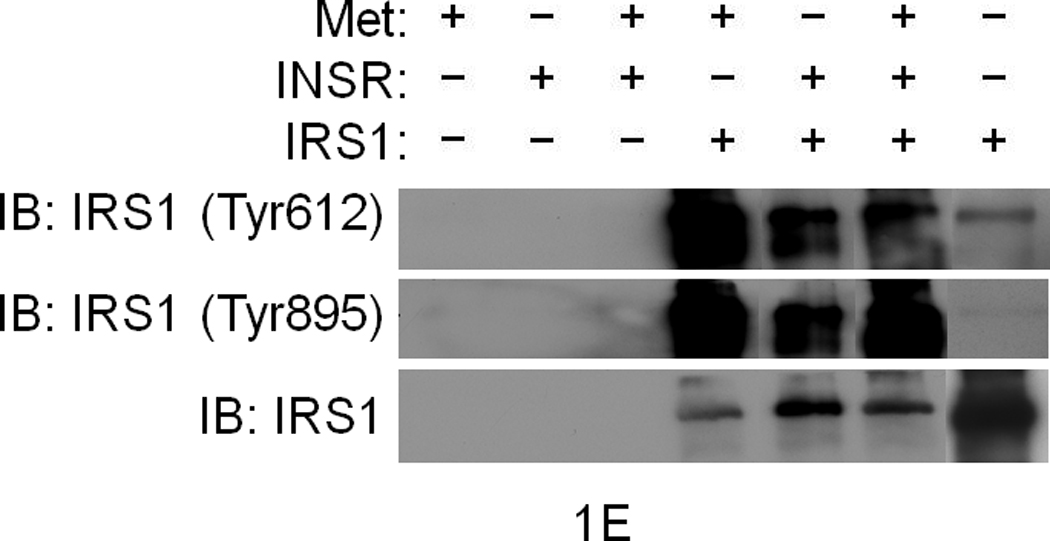
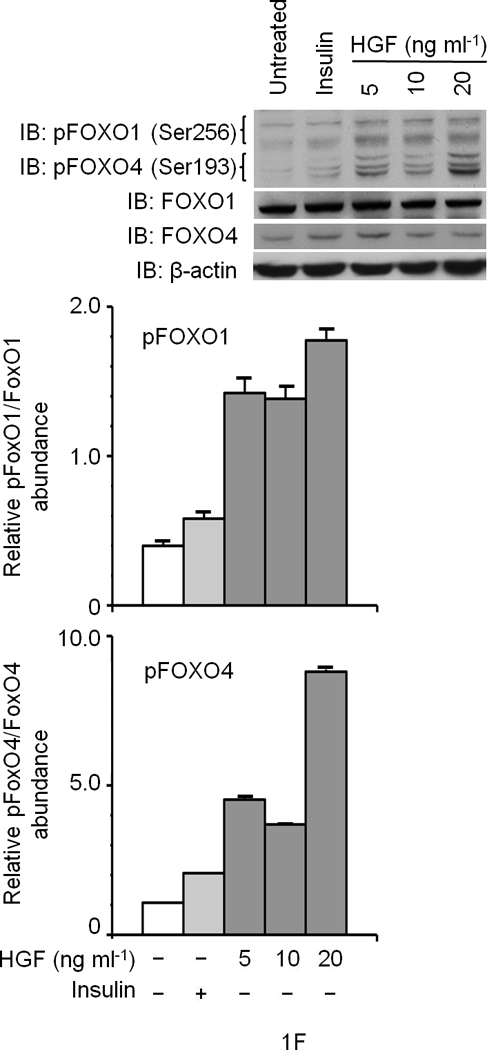
(a) Glucose uptake (top and bottom panels) and glycogen synthesis assays (middle panel) in primary culture of hepatocytes. *P < 0.05, **P < 0.002 by ANOVA as compared to untreated control. (b, c) Co–immunoprecipitation (IP) and immunoblotting (IB) experiments showing recruitment of IRSs to Met (b) and INSR (c) by HGF and insulin stimulation. (d) Differential activation of IRS proteins in Hepa1-6 cells by HGF and insulin as determined by IP and IB using site-specific phosphotyrosine antibodies. Arrows indicate pIRS. (e) Phosphorylation of IRS1 protein by Met using a cell-free kinase assay and purified recombinant proteins as indicated. (e) Activation of FOXO1 and FOXO4 in HepG2 cells by HGF (30 min.) using antibody to FOXO1 (Ser256, Mr approximately 70 kDa). This antibody also cross-reacts with pFOXO4 (Ser193) which has an approximate Mr of 60 kDa). Bar graphs depict normalized signal values as indicated for the given protein. Error bar represents mean ± s.e.m.
In response to insulin, IRS1 or -2 can be phosphorylated on several Tyr residues including two conserved tyrosine residues (referred to as Tyr612 and Tyr895; numbering corresponds to IRS1) and these two sites are known to engage PI3K and MAPK via p85 (a.k.a. PIK3R) and GRB2 or SHP2 (a.k.a. PTPN11), respectively8. Stimulation of hepatocytes with insulin or HGF induced tyrosine phosphorylation of both IRSs on these sites as determined by immunoprecipitation for IRS and immunoblotting with phosphosite-specific antibodies (Fig. 1d). HGF preferentially stimulated the Tyr895 site whereas insulin robustly stimulated Tyr612 (see normalized data depicted as bar graphs in Fig. 1d). Since Met, INSR and IRS associate with each other (see below), Met may interact with and activate IRS indirectly via INSR. To address this possibility, we performed kinase assays using a cell-free system that contained pure recombinant Met kinase, IRS1, as well as INSR kinase. Met by itself was capable of phosphorylating IRS1 at Tyr612 and Tyr895 sites (Fig. 1e). Like INSR, Met harbors an IRS binding motif (QPEY in Met – Supplementary Figure 1) as well as the YXXYY motif in the activation loop which when fully activated in INSR is known to bind to IRS28. Altogether, these data indicate that Met is capable of directly interact with and activate IRSs. Downstream from INSR and IRSs lies Akt, which upon activation, phosphorylates the transcription factors FoxO1 and FoxO4 subsequently inhibiting their function by causing nuclear exclusion12. In time course studies, we discovered that HGF stimulation induces phosphorylation of FoxO1 and FoxO4 (Fig. 1f) peaking at 30 min. and remaining sustained to the end point of the experiment (1 h., data not shown).
Met and INSR form a molecular complex and Met phosphorylates INSR
To determine whether Met and INSR associate with one another, we carried out co-immunoprecipitation studies using Hepa1-6 hepatocytic cells. In the absence of HGF or insulin, cells did not exhibit detectable Met–INSR complex. However, stimulation with HGF resulted in Met–INSR complex formation (Fig. 2a), and insulin treatment induced Met association with INSR which coincided with INSR activation (at pINSR Tyr1146, Fig. 2a). HGF plus insulin also caused Met–INSR complex formation which occurred concomitantly with an enhancement of INSR activation (Fig. 2a).
Figure 2. Met interacts with and phosphorylates INSR.


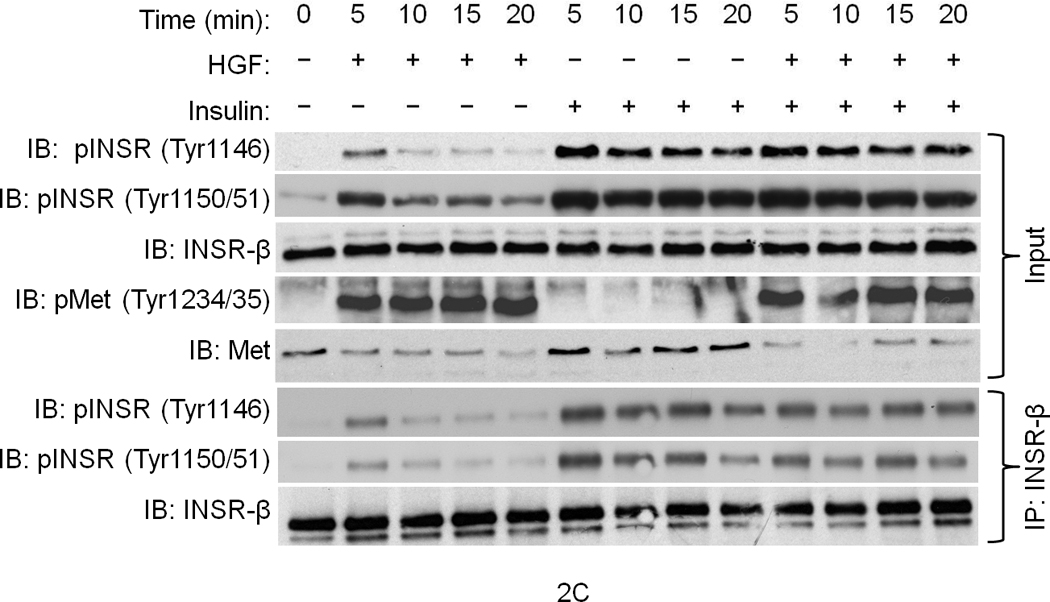
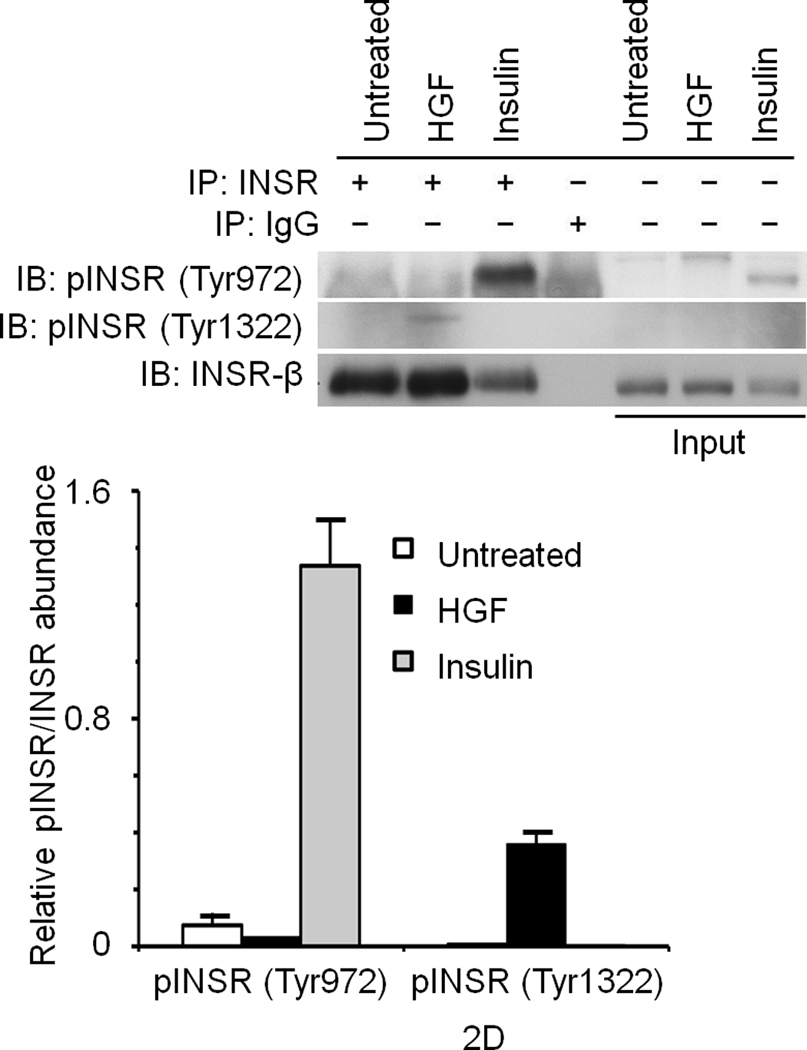
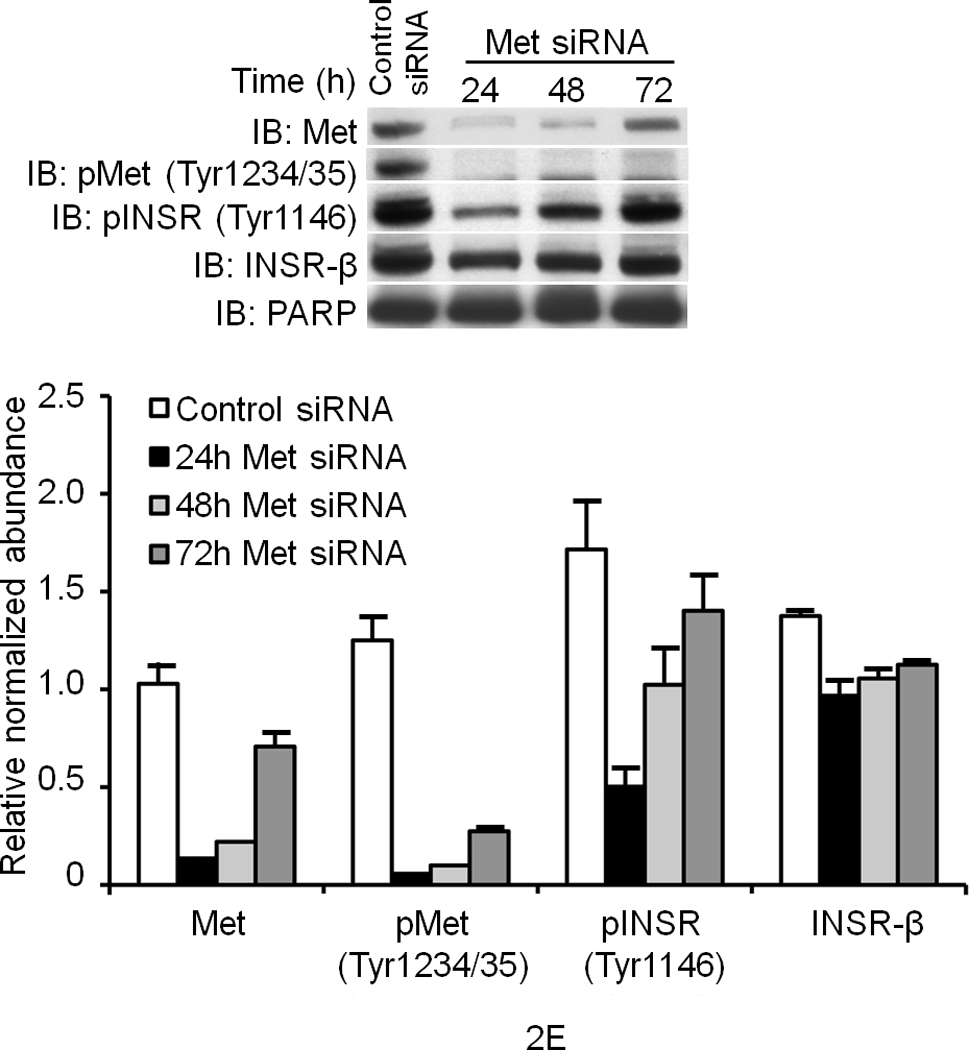
(a) Hepa1-6 cells were treated with the indicated ligands (HGF [40 ng ml−1] or insulin [5 ng ml−1] for 15 min.) and then subjected to IP and IB using the indicated antibodies. The lane labeled ‘input’ is untreated crude lysate. (b) A cell–free kinase assays using pure recombinant Met and INSR kinases alone or with each other for 15 min. in the kinase buffer containing 32P-γATP. The resulting membrane was also analyzed by IB for INSR and Met as depicted. (c, d) IB results of human primary culture of hepatocytes (c) or HepG2 cells (d) treated with HGF as in (a) using the indicated antibodies. (e) HepG2 cells were transfected with Met-specific or control siRNA and subjected to IB for determination of Met and INSR expression and activation status. Bar graphs depict normalized signal values as indicated for a given protein. Error bar represents mean ± s.e.m.
Given the above data, we wished to determine whether Met directly transphosphorylates INSR. Therefore, purified recombinant human Met kinase (78 kDa) and INSR kinase (70 kDa) containing only the cytoplasmic domains were subjected to kinase assays in the presence of 32P-γATP (i.e. hot kinase assays) to document de novo phosphorylation. Met or INSR incubated alone at low concentrations exhibited a minimal level of kinase activity. However, addition of Met to INSR resulted in robust tyrosine phosphorylation of INSR (compare lane 3 to 5 in Fig. 2b). Immunoblotting confirmed the presence of both Met and INSR in the reaction and revealed that Met-induced INSR phosphorylation includes the pY1146 site (Fig. 2b). We further established that Met tyrosine phosphorylates INSR using another type of recombinant INSR kinase which is His-tagged, has an Mr of 37 kDa, and is easily distinguished from recombinant Met kinase (which is GST-tagged and has an Mr of 78 kDa; see Supplementary Figure 3A). In similar experiments using recombinant EGFR kinase domain in hot kinase assays we found that phosphorylation of INSR by Met is specific as EGFR failed to promote INSR phosphorylation (Supplementary Figure 3B).
To investigate if INSR activation by Met occurs in cells, serum-deprived primary cultures of human hepatocytes were treated with HGF, insulin or a combination of the two and assessed for INSR activation. In the absence of their cognate ligands, Met and INSR demonstrated minimal tyrosine phosphorylation in their activation loops. Insulin stimulated INSR, and HGF activated Met (Fig. 2c). Notably, HGF also rapidly stimulated INSR in the kinase activation loop on Tyr1146 and Tyr1150/1151 (Fig. 2c; see also Supplementary Figure 4). Similar experiments using HepG2 cells revealed that HGF also activated INSR on its c-terminal tail residue Tyr1322 (Fig. 2d). This site is one of the multidocking sites in INSR responsible for engaging mediators like PI3K. We then down regulated Met by an siRNA-mediated approach and noted a pronounced reduction in the level of phospho-INSR (Fig. 2e) suggesting that full INSR activation requires Met. We next employed a Tet-regulated stable Hepa1-6 cell line which expresses a dominant negative form of Met as we described previously (DN-Met)13 to determine whether tyrosine phosphorylation of INSR induced by Met depends on functional Met. DN-Met acts as a suppressor of Met tyrosine kinase thus preventing Met activation induced by HGF (Fig. 3a). HGF-induced phosphorylation of INSR as well as recruitment of INSR and IRSs to Met were dampened upon DN-Met induction (Fig. 3b; see also Supplementary Figure 5).
Figure 3. INSR activation and IRS recruitment to Met requires functional Met kinase.
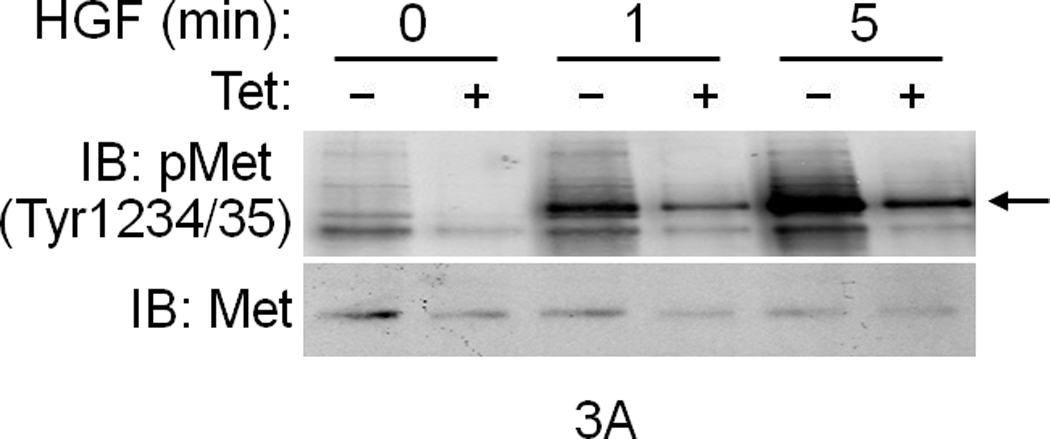

(a) IB data showing that induction of DN-Met by Tet dampens Met activation induced by HGF in Hepa1-6 cells. Arrow indicates pMet. (b) Cell lysates were also subjected to IP and IB analyses using the indicated antibodies. Bar graphs depict Met activation, and Met–INSR and Met–IRS complex formation after normalizing the indicated protein against corresponding Met IP. Error bar represents mean ± s.e.m.
Met is involved in hepatic glucose homeostasis
To determine whether Met–INSR crosstalk functions in vivo, we first injected wild type CD1 mice intraperitoneally with insulin (0.0002U g−1 and 0.02U g−1, two animals per dose) and assessed their liver extracts (as described for Fig. 3). The results indicated that INSR activation by insulin rapidly recruits Met to INSR and promotes Met interaction with IRS1 establishing that Met–INSR–IRS crosstalk is in fact operational in hepatic tissue (see Supplementary Figure 6A). We subsequently took a two-pronged approach to assess the importance of Met in glucose homeostasis in vivo. In the first arm, loss-of-function models were employed. We determined blood glucose levels in adult transgenic mice that express the dominant negative form of Met (DN-Met, described above) under the transcriptional regulation of albumin promoter enhancer (AlbDN-Met)13. We found that transgenic mice exhibited hyperglycemia under fasting conditions (mean blood glucose for the AlbDN-Met transgenic mice of 145 mg dl−1 as compared to 87 mg dl−1 for non-transgenic littermate controls (P = 0.0062) (Fig. 4a). We next subjected the AlbDN-Met mice to glucose tolerance test (GTT) and insulin tolerance test (ITT). These mice exhibited a significantly reduced ability to dispose of glucose (Fig.4b) and response to insulin as compared to wild type controls (Fig. 4c). Further investigation revealed that Met–INSR hybrid complex formation was detectable in the non-transgenic mice but was diminished in the AlbDN-Met transgenics (Supplementary Figure 6B).
Figure 4. Loss of Met function in the liver impairs glucose homeostasis.
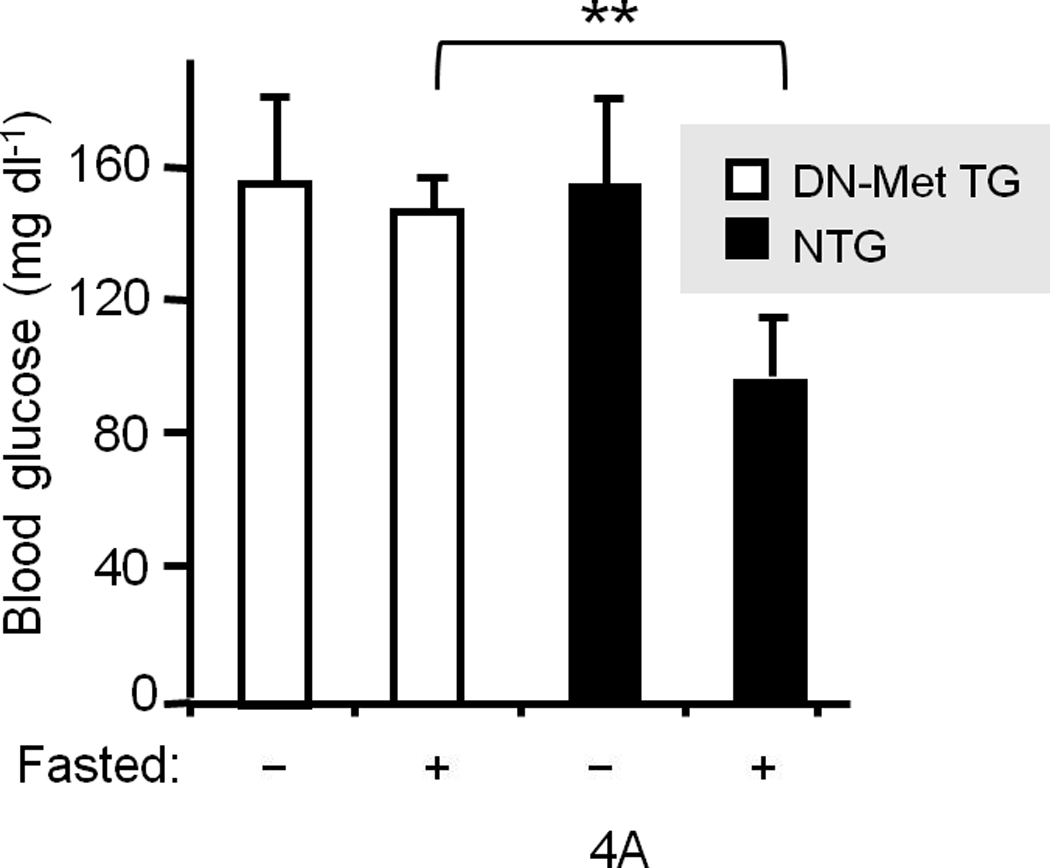


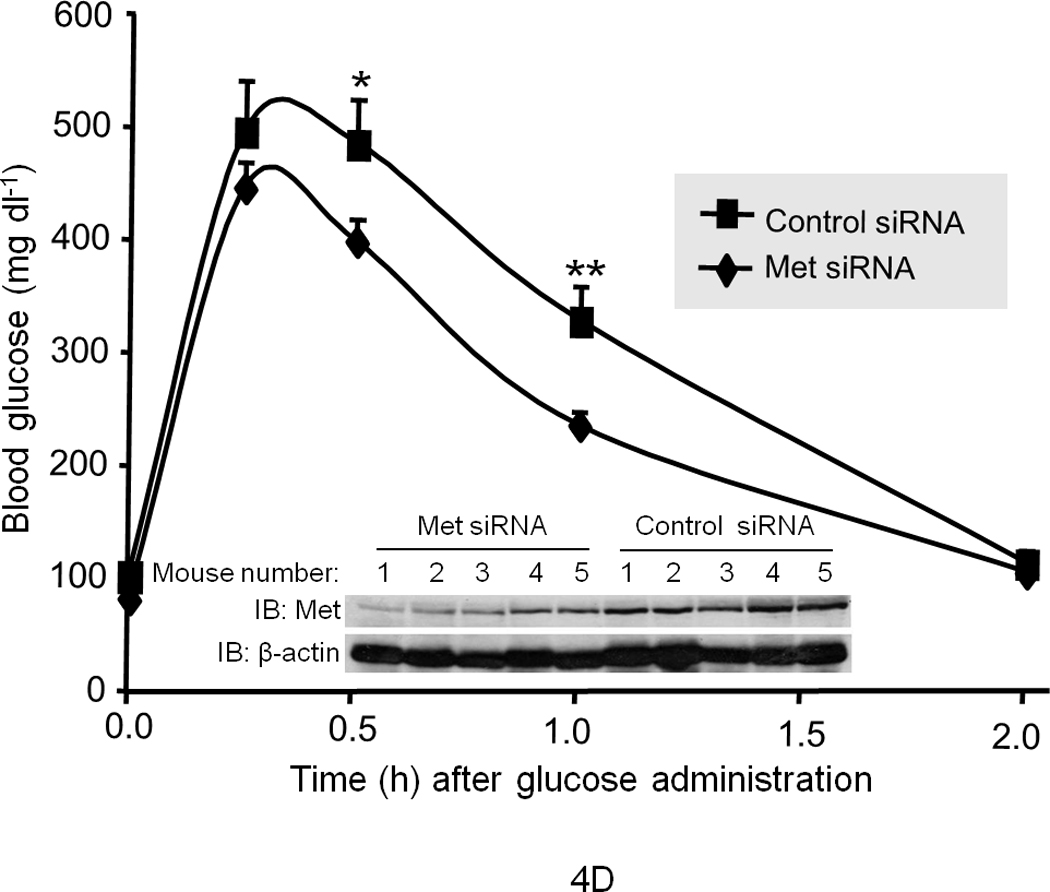
(a) Blood glucose levels were determined in wild type littermates and transgenic mice expressing AlbDN–Met in the liver13 in the fed (−) or fasted (+) state (n = 15 female mice per group). **P = 0.0062. GTT (b) and ITT (c) were performed in AlbDN-Met mice and their littermate controls (n = 5–7 male mice per group). The P values for GGT were: ***P < 0.001 by 2-way ANOVA between groups and P = 0.01 within a group. The P values for ITT were: *P = 0.03, **P = 0.002. (d) GTT was performed on CD1 mice that had been injected with Met-specific siRNA or control siRNA (n = 5 per group). *P = 0.026, **P = 0.017 (d–inset) IB results for Met protein abundance. Error bars represent mean ± s.e.m.
We also utilized the RNAi-mediated knock down technique to deliver siRNA to the liver in mice14,15 to investigate the short-term effects of Met impairment on hepatic glucose homeostasis. We administered Met-specific siRNA (10 nmol as a single tail vein injection) to mice and then subjected them daily to GTT after overnight fasting. (Note: we performed daily GTT so as to ensure the nadir of Met protein abundance was encompassed.) On day 1 (d.1) after siRNA injection, no difference in the rate of glucose clearance was noted between the Met siRNA injected and control groups (data not shown). However, on d.2 and d.3 after siRNA injection, significant impairment of glucose clearance in the Met-specific siRNA group was detected (Fig. 4d depicts the data for d.3; data from d.2 showed a similar pattern but are not shown). Diminished glucose clearance occurred concomitantly with a significant reduction (approximately 40%; P = 0.0017) in Met protein abundance (Fig. 4d – inset, also see Supplementary Figure 7). Met siRNA had no effect on INSR expression nor on hepatic histology (i.e., neither hepatic apoptosis nor necrosis was observed (data not shown).
HGF restores insulin responsiveness in diabetic mice
To determine whether HGF regulates glucose homeostasis, we also performed gain-of-function studies. We chose ob/ob mice for these experiments because they are a well-known model of insulin resistance and demonstrate dysregulated hepatic glucose output and fasting hyperglycemia. Notably we found that systemic injection of recombinant HGF to fasting ob/ob mice suppressed the rise of endogenous blood glucose over the test period of 120 min. as compared to saline treated control mice (Fig. 5a). Insulin administration (0.25 mU g−1, a highly efficacious dose in wild type lean mice) failed to suppress the blood glucose spike in ob/ob mice (Fig. 5b), but when co-injected with HGF, the combination of insulin and HGF profoundly blunted endogenous blood glucose elevation (Fig. 5c). These data suggest that HGF and insulin synergize to normalize blood glucose. HGF, unlike insulin, failed to induce overt hypoglycemia when administered to fasting normal lean mice (Fig. 5b) suggesting that HGF has a tonic influence on maintaining blood glucose in a normal range.
Figure 5. HGF administration to diabetic mice dampens endogenous glucose efflux into blood.
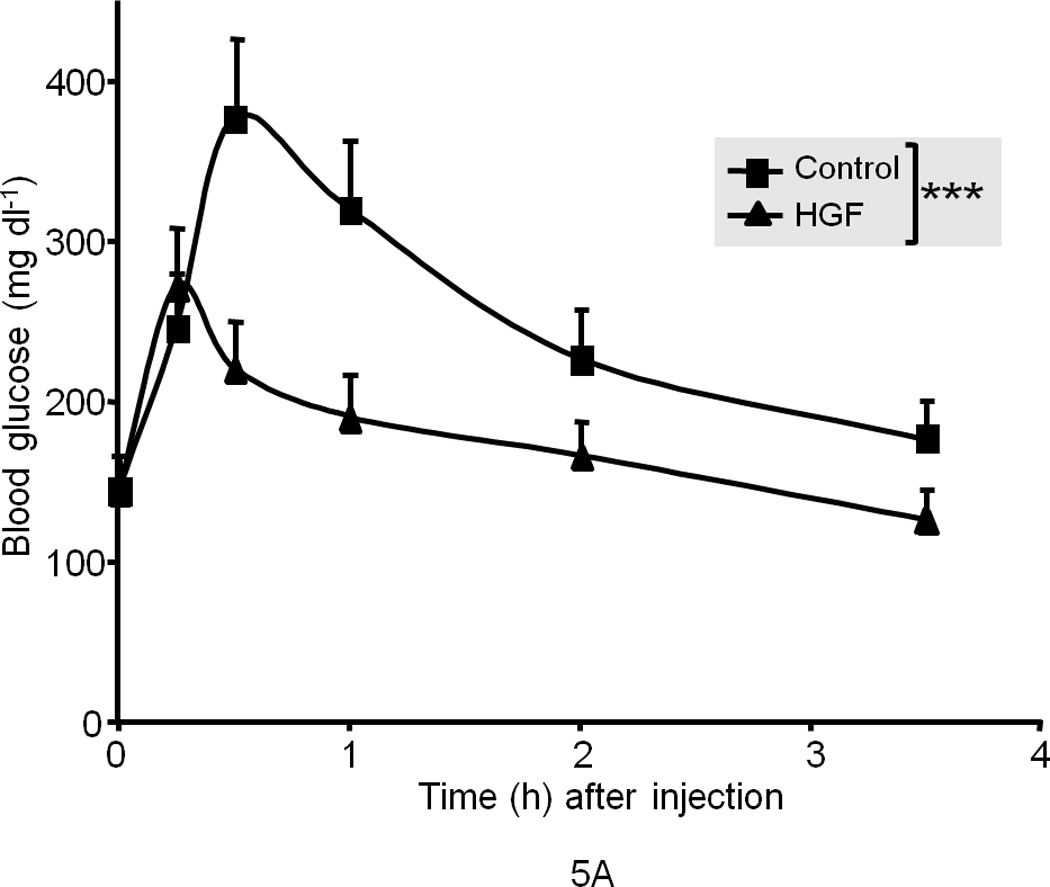
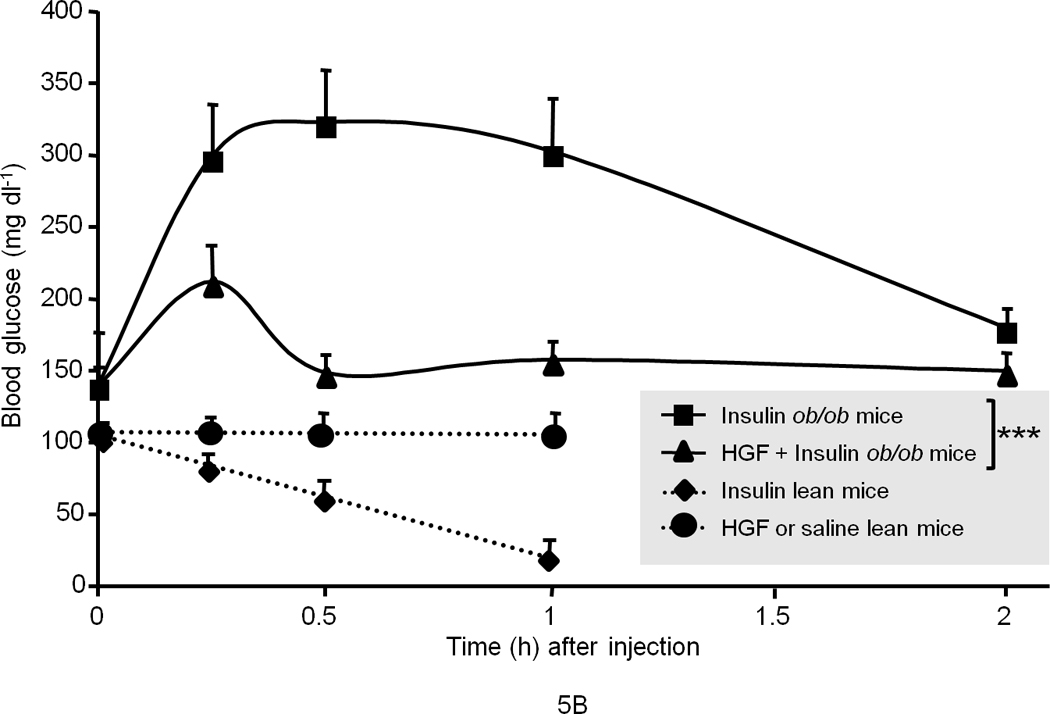

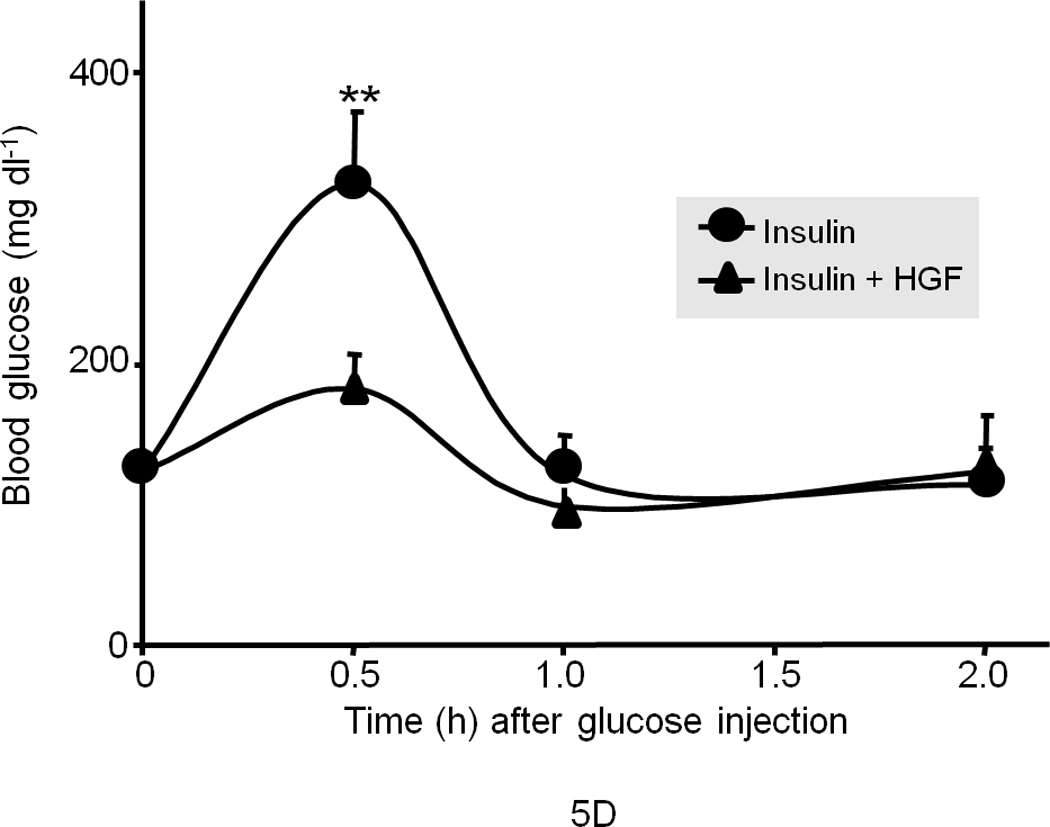

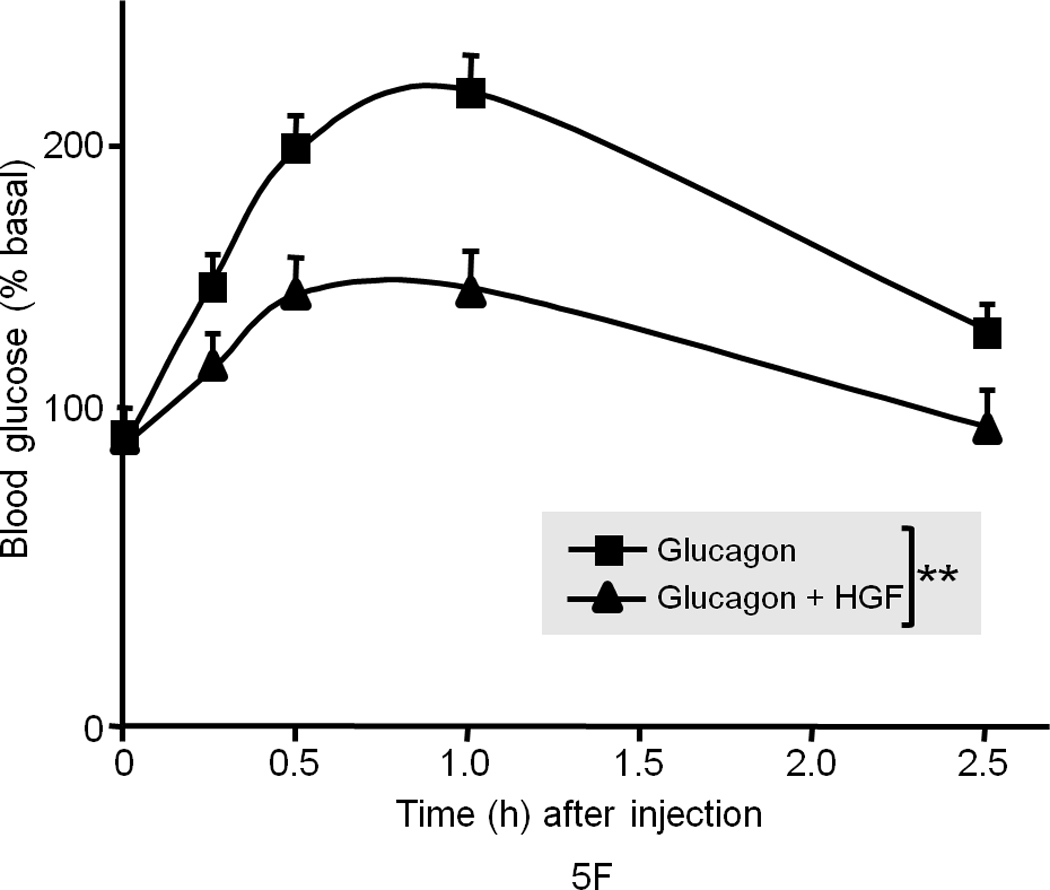
(a) Blood glucose level in fasted male ob/ob mice after injection of recombinant human HGF (0.5 µg g−1) in saline or saline control (n = 5 per group). The data were analyzed for P-values by 2-way ANOVA: ***P = 0.0001 between groups, P < 0.0001 within a group (i.e., time points), P = 0.0002 for interaction between the two groups. (b) Blood glucose level in fasted male ob/ob and lean mice (n = 5 per group) after injection of insulin (0.25 mU g−1 in saline) and/or HGF (as above). The P-values for ob/ob mice by 2-way ANOVA were ***P = 0.005 between and P < 0.0001 within time points and P < 0.0001 for interaction between the two groups. (c) A compilation of the data from (a) and (b) showing synergistic effects of HGF and insulin on blood glucose levels. (d, e) GTT in fasting ob/ob mice (n = 10 total) (d) or lean mice control (n = 15 total) (e) injected systemically with glucose (1.5 mg g−1) containing insulin (0.25 mU g−1) or glucose containing insulin plus HGF. P-values were: **P = 0.004 for ob/ob mice in (d) and for lean mice in (e), *P = 0.018 HGF vs. control and **P = 0.001 insulin vs. control by 2-way ANOVA. (f) Glucagon challenge in fasted lean mice (0.5 µg g−1 tail vein injection) plus or minus HGF. P-values were: **P = 0.0023 between groups, P < 0.0001 within a group (time points) and P = 0.046 for group interactions by 2-way ANOVA. Error bar represents mean ± s.e.m.
We next subjected the ob/ob mice to GTT with or without insulin treatment. Again, insulin (0.25 mU g−1) had no effect on regulating the blood glucose level in ob/ob mice. On the other hand, HGF had a modest yet significant effect when administered alone (data not shown), but co-treatment of insulin with HGF resulted in a significant improvement (Fig. 5d). In wild type lean mice, insulin at the same dose (0.25 mU g−1) markedly lowered blood glucose when subjected to GTT, while HGF by itself showed a modest yet significant effect (Fig. 5e) suggesting that HGF can promote glucose disposal.
The elevation in the level of endogenous blood glucose that we observed in ob/ob mice after injection with saline or insulin (described in Fig. 5a, b) peaked at approximately 400 mg dl−1 which is equivalent to the blood glucose level obtained when ob/ob or wild type mice are injected with 2 mg g−1 of exogenous glucose typically administered during a GTT. It is known that ob/ob mice, but not normal mice, have dysregulated hepatic glucose output and respond to stress (such as blood sampling) by releasing an abnormally large amount of glucose into the blood, a response that mimics the effects of glucagon16,17.
To test whether HGF suppresses glucagon-induced glucose output, we subjected the ob/ob mice (after an overnight fasting) to glucagon challenge (0.1 µg g−1) with or without HGF. HGF suppressed glucagon-induced blood glucose elevation in ob/ob mice similar to the results described in Figs. 5a and b (data not shown; see also below). We also challenged the wild type lean counterparts (in fasting state) with glucagon to induce hepatic glucose production (HGP) and found that HGF co-treatment with glucagon effectively dampened blood glucose elevation (Fig. 5f). It should be noted that glucagon only affects liver because glucagon receptor is expressed only on hepatocytes. In these studies we found that HGF does not prevent the process of glycogenolysis per se (as determined by PAS and liver glycogen content assays, data not shown) but may affect other components of HGP such as gluconeogenesis and glucose release.
To further explore the mechanism of HGF-induced suppression of blood glucose rise, we assessed Met activation and signaling following HGF injection in liver, adipose and skeletal muscle tissues. HGF administration primarily activated Met in the liver within 15 min. of injection, but it did not stimulate Met in adipose or skeletal muscle (Fig. 6a). This is perhaps due to the fact that injected HGF cannot reach these tissues because the liver picks up greater than 95% of systemically injected HGF, and the kidney absorbs the remainder18,19 as these tissues are Met-enriched (Supplementary Figure 8).
Figure 6. HGF administration to mice alters key gluconeogenic mediators in the liver.


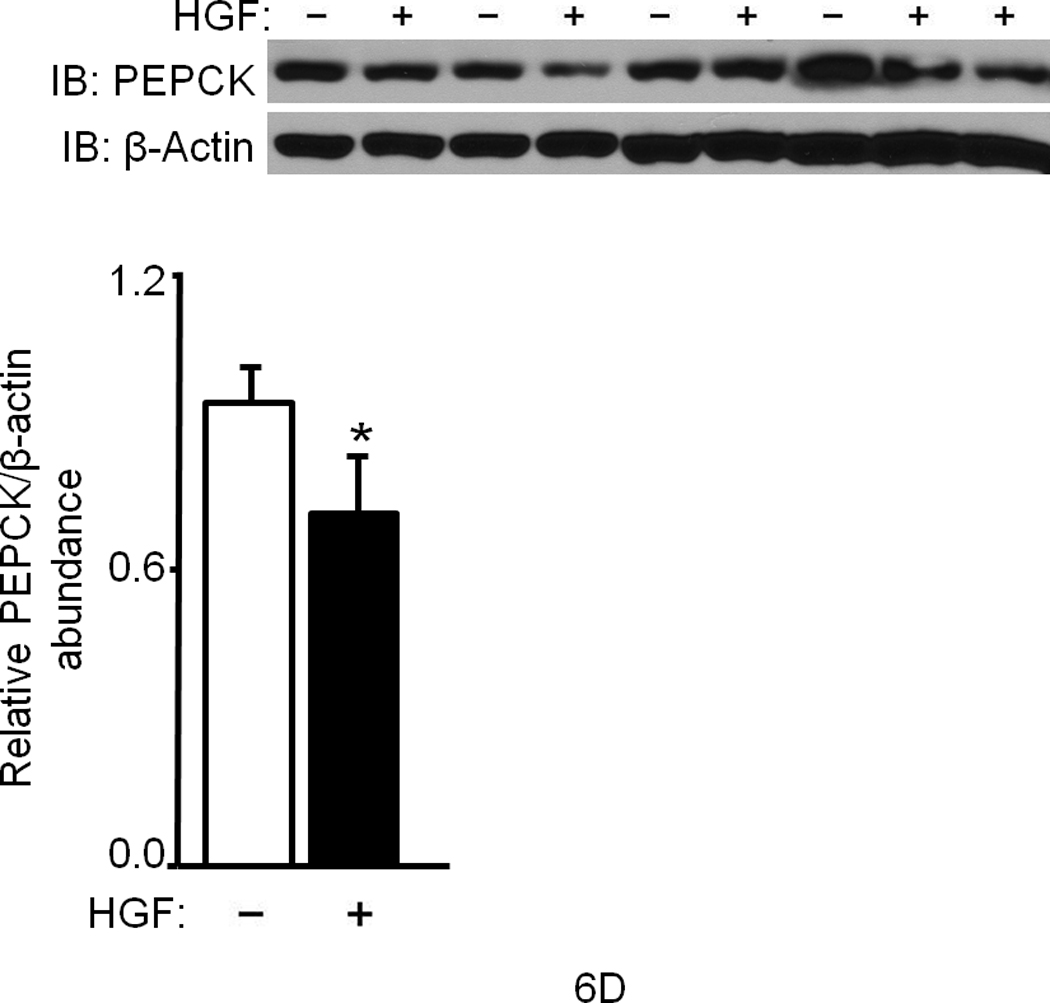
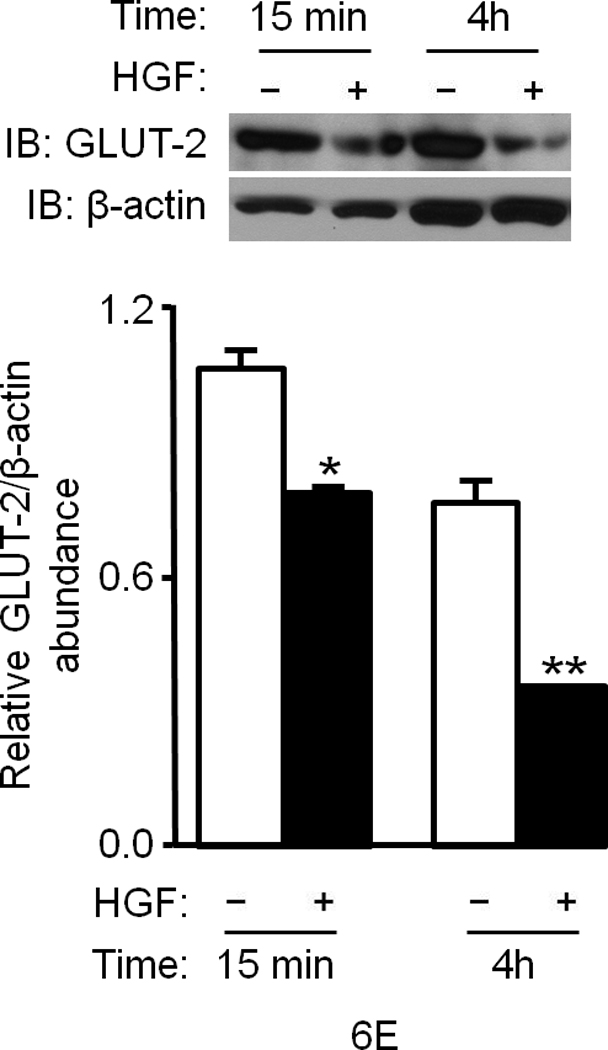


(a–f) Ob/ob and lean mice were injected systemically with HGF (a, b) or glucagon plus or minus HGF (c–f) and their tissues were analyzed for the indicated proteins by IB (a–e) or immunohistostaining (f). In (a), HGF treatment was for 15 min. and, in (c–f), 4 h. Bar graphs depict normalized values for a given protein as indicated. In (f), arrows point to staining for GLUT-2 protein. bar = approx. 50 µm. (g) Proposed model of Met–INSR crosstalk in hepatocytes. P denotes phosphotyrosine.
HGF treatment caused phosphorylation of hepatic Akt (Ser473) (Fig. 6b, Supplementary Figure 9) and FoxO1 (Thr24) within 15 min. (Fig. 6b). As mentioned, phosphorylation of FoxO1 promotes its exclusion from the nucleus. This causes its disengagement from target promoters and hence repression of gene transcription. Of note, we found that FoxO1 was hypophosphorylated in ob/ob mice under fed conditions suggesting that transcription of gluconeogenic target genes like phosphoenolpyruvate carboxykinase (PEPCK) and glucose-6-phosphatase (G6Pase) is ongoing in these animals. In contrast to ob/ob mice, wild type lean mice showed hyperphosphorylated FoxO1 in their livers (Fig. 6b) confirming that the expression of gluconeogenic target genes is down regulated. PEPCK and G6Pase are the key rate limiting enzymes in gluconeogenesis and glucose output, and their genes are transcriptionally driven by FoxO1. Analysis of hepatic tissues from lean mice treated with or without HGF by western blot showed a significant reduction in the level of G6Pase by HGF (P = 0.013) and by insulin (P = 0.002) (Fig. 6c). In ob/ob mice that had undergone glucagon challenge with or without HGF, HGF also significantly (P = 0.03) reduced hepatic PEPCK (Fig. 6d) and G6Pase protein abundance (data not shown). Additionally, we uncovered that treatment of ob/ob mice with HGF caused marked reduction in the level of hepatic GLUT-2 protein as assessed by western immunoblot (Fig. 6e) and by immunohistochemistry (Fig. 6f). The fact that HGF regulates GLUT-2 is a novel observation since this transporter protein (a.k.a. Facilitated Glucose Transporter-2 and Solute Carrier Family 2, member 2 [SLC2A2]) plays an important part in controlling the movement of glucose between liver and blood in a bidirectional manner (i.e., into and out of hepatocytes during the fed and fasted states, respectively).
The down regulation of PEPCK, G6Pase and GLUT-2 proteins by HGF confirmed our gene array data which showed that HGF injected into wild type mice suppresses PEPCK, G6Pase and GLUT-2 mRNAs in the liver (Supplementary Table 1). HGF injections also substantially modulated the mRNA abundances of pyruvate kinase, pyruvate carboxylase, lipase, fatty acid synthase, long chain fatty acyl-CoA synthetase and glyceraldehyde-3-phosphate dehydrogenase (Supplementary Table 1).
DISCUSSION
Our studies uncovered a novel function for Met tyrosine kinase in regulating hepatic glucose metabolism by directly interacting with and regulating the insulin receptor. These findings expand the existing knowledge base on the molecular action of insulin-INSR in glucose metabolism and hepatic insulin resistance. Mechanistic and biochemical studies revealed that interaction of Met with INSR leads to activation of INSR by Met via formation of a Met–INSR hybrid which subsequently recruits and activates IRS1 and especially IRS2 in response to HGF or insulin. Notably, hepatic IRS2 is believed to be the major regulator of blood glucose15. Met stimulation appears to result in preferential phosphorylation of Tyr895 sites (vs. Tyr612) on IRS1 and IRS2 (Fig. 1f) as compared to insulin which led to more robust activation of Tyr612 pointing to complementary mechanisms of action between the two growth factor/receptor pairs. The Tyr895 and Tyr612 sites of the IRSs engage the PI3K and MAPK pathways via p85, Grb2 and SHP2, respectively8, to promote cell growth and cell survival in addition to metabolic control. Based on our data, we propose that, in the liver (i.e., hepatocytes), Met cooperates with INSR leading to robust signal output by the Met–INSR complex to regulate glucose metabolism. Thus signal output by INSR alone in the absence of Met is relatively limited (see model in Fig. 6g). We propose that Met’s role in glucose metabolism in the liver is to promote hepatic glucose uptake and suppress glucose production and output from hepatocytes into the blood. As mentioned above, injected HGF only activated Met in the liver (and to a much lower degree in the kidney) but not in adipose tissue or skeletal muscle (see Fig. 6a). Liver and kidney are epithelial tissues and, as such, highly express Met, while adipose and skeletal muscle are mesenchymal tissues and are known to express relatively lower levels of Met. Indeed, Met and INSR are expressed at a similar level in the liver but INSR is more abundant in adipose tissue and skeletal muscle as compared to Met (Supplementary Figure 8). It is likely that, in vivo, HGF produced locally in the microenvironment of adipose and muscle tissues can reach adipocytes and myocytes (in a paracrine or autocrine manner) to activate Met and regulate their glucose metabolism. Others have reported that the 3T3-L1 adipocyte cell line and L6 myotube cells, a muscle-derived cell line, respond to exogenous HGF in vitro and exhibit enhanced glucose uptake via Gab-1–PI3K–GLUT-4 pathway without engaging IRS120,21. We too found that HGF is a potent activator of Gab1 and Akt in hepatocytes (Supplementary Figure 9). A recent report focusing on the role of Met in promoting cell motility described that IRS1 but not -2 is recruited to Met upon stimulation with IGF1 in cultures of mouse embryonic fibroblasts (which express very low levels of Met). This interaction required IRS1 to be tyrosine phosphorylated; however, IGF1 receptor (IGF1R) was apparently not associated with Met22. These data suggest that the Met–INSR–IRS cross-talk we describe here may be specific to hepatocytes which express high levels of Met, INSR, IRS1 and -2.
Studies have reported a role for HGF–Met in hepatic lipid metabolism. Administration of the antidiabetic agent pioglitazone (a ligand for peroxisome proliferator-activated receptor-γ [PPAR-γ]) induced Met expression which, the authors postulate, may subsequently attenuate steatosis23. We previously reported that PPAR-γ binds to the HGF gene proximal promoter and activates its expression24. Others have reported that HGF can ameliorate high fat diet–induced fatty liver25.
Our in vivo results suggest that HGF is a potent suppressor of hepatic glucose production and output in an insulin resistance setting and can potentially restore insulin responsiveness. This is further substantiated by findings from our gene array studies (Supplementary Table 1) in which we found that HGF administration to mice modulated hepatic mRNA expression of enzymes involved in glucose and lipid metabolism akin to insulin effects. It should be noted that the pronounced effects of HGF on dampening stress-induced hyperglycemia (described in Fig. 5a–c) could be due, at least in part, to HGF influencing glucose uptake in non-hepatic tissues such as kidney (which as mentioned earlier is rich in Met). The kidney is well known for its ability to regulate blood glucose homeostasis via gluconeogenesis and glucose output as well as renal glucose reabsorption. The latter involves transporter proteins like GLUT-2 and SGLT2 (sodium/glucose cotransporter [SLC5A2] )26. Thus, the kidney significantly contributes to hyperglycemia in the diabetic setting26. It is conceivable that HGF may have a therapeutic role in treating hyperglycemia in type 2 diabetes. Moreover, the HGF–Met signaling system also indirectly regulates glucose homeostasis by promoting beta cell proliferation, survival and function27. Thus further studies are warranted to investigate the efficacy and feasibility of HGF in the clinical management of diabetes.
METHODS
Methods and any associated references are available in the online version of the article at http://www.nature.com/naturemedicine/.
Note: Supplementary information is available on the Nature Medicine website.
Supplementary Material
ACKNOWLEDGEMENTS
We thank G.K. Michalopoulos and S. Strom (University of Pittsburgh) for providing us with primary rodent and human hepatocyte cultures. We also thank Amanda Eaker and Carla Johnson for their technical assistance. This study was supported by an R01 grant (R01NIAA001871301) awarded to R.Z. by the US National Institute of Health.
Footnotes
COMPETING FINANCIAL INTERESTS
The authors declare no financial interests.
AUTHOR CONTRIBUTIONS
Dr. Zarnegar developed the hypothesis, designed experimental approaches and interpreted data. Drs. Fafalios and Ma executed experiments, collected data and performed analyses. Dr. DeFrances helped with histological studies and data interpretation. Dr. Luo performed gene array studies. John Stoops and Dr. Xinping Tan performed mouse injection experiments, mouse tissue harvesting, immunohistostaining and many other technical assays.
REFERENCES
- 1.Zarnegar R, Michalopoulos GK. The many faces of hepatocyte growth factor: from hepatopoiesis to hematopoiesis. J Cell Biol. 1995;129:1177–1180. doi: 10.1083/jcb.129.5.1177. [DOI] [PMC free article] [PubMed] [Google Scholar]
- 2.Birchmeier C, Birchmeier W, Gherardi E, Vande Woude GF. Met, metastasis, motility and more. Nat Rev Mol Cell Biol. 2003;4:915–925. doi: 10.1038/nrm1261. [DOI] [PubMed] [Google Scholar]
- 3.Borowiak M, et al. Met provides essential signals for liver regeneration. Proc Natl Acad Sci U S A. 2004;101:10608–10613. doi: 10.1073/pnas.0403412101. [DOI] [PMC free article] [PubMed] [Google Scholar]
- 4.Corso S, Comoglio PM, Giordano S. Cancer therapy: can the challenge be MET? Trends Mol Med. 2005;11:284–292. doi: 10.1016/j.molmed.2005.04.005. [DOI] [PubMed] [Google Scholar]
- 5.Huh C-G, et al. Hepatocyte growth factor/c-met signaling pathway is required for efficient liver regeneration and repair. Proc Natl Acad Sci U S A. 2004;101:4477–4482. doi: 10.1073/pnas.0306068101. [DOI] [PMC free article] [PubMed] [Google Scholar]
- 6.De Meyts P. Insulin and its receptor: structure, function and evolution. Bioessays. 2004;26:1351–1362. doi: 10.1002/bies.20151. [DOI] [PubMed] [Google Scholar]
- 7.Lemmon MA, Schlessinger J. Cell signaling by receptor tyrosine kinases. Cell. 2010;141:1117–1134. doi: 10.1016/j.cell.2010.06.011. [DOI] [PMC free article] [PubMed] [Google Scholar]
- 8.Hanke S, Mann M. The phosphotyrosine interactome of the insulin receptor family and its substrates IRS-1 and IRS-2. Mol Cell Proteomics. 2009;8:519–534. doi: 10.1074/mcp.M800407-MCP200. [DOI] [PMC free article] [PubMed] [Google Scholar]
- 9.Johnston AM, Pirola L, Van Obberghen E. Molecular mechanisms of insulin receptor substrate protein-mediated modulation of insulin signalling. FEBS Lett. 2003;546:32–36. doi: 10.1016/s0014-5793(03)00438-1. [DOI] [PubMed] [Google Scholar]
- 10.Myers MG, Jr., White MF. Insulin signal transduction and the IRS proteins. Annu Rev Pharmacol Toxicol. 1996;36:615–658. doi: 10.1146/annurev.pa.36.040196.003151. [DOI] [PubMed] [Google Scholar]
- 11.Saltiel AR, Kahn CR. Insulin signalling and the regulation of glucose and lipid metabolism. Nature. 2001;414:799–806. doi: 10.1038/414799a. [DOI] [PubMed] [Google Scholar]
- 12.Gross DN, Wan M, Birnbaum MJ. The role of FOXO in the regulation of metabolism. Curr Diab Rep. 2009;9:208–214. doi: 10.1007/s11892-009-0034-5. [DOI] [PubMed] [Google Scholar]
- 13.Wang X, et al. A mechanism of cell survival: sequestration of Fas by the HGF receptor Met. Mol Cell. 2002;9:411–421. doi: 10.1016/s1097-2765(02)00439-2. [DOI] [PubMed] [Google Scholar]
- 14.Song E, et al. RNA interference targeting Fas protects mice from fulminant hepatitis. Nat Med. 2003;9:347–351. doi: 10.1038/nm828. [DOI] [PubMed] [Google Scholar]
- 15.Taniguchi CM, Ueki K, Kahn R. Complementary roles of IRS-1 and IRS-2 in the hepatic regulation of metabolism. J Clin Invest. 2005;115:718–727. doi: 10.1172/JCI23187. [Erratum appears in J Clin Invest. 2005 May;115(5):1388] [DOI] [PMC free article] [PubMed] [Google Scholar] [Retracted]
- 16.Surwit RS, et al. Alprazolam reduces stress hyperglycemia in ob/ob mice. Psychosom Med. 1986;48:278–282. doi: 10.1097/00006842-198603000-00013. [DOI] [PubMed] [Google Scholar]
- 17.Turner SM, Linfoot PA, Neese RA, Hellerstein MK. Sources of plasma glucose and liver glycogen in fasted ob/ob mice. Acta Diabetol. 2005;42:187–193. doi: 10.1007/s00592-005-0201-3. [DOI] [PubMed] [Google Scholar]
- 18.Appasamy R, et al. Hepatocyte growth factor, blood clearance, organ uptake, and biliary excretion in normal and partially hepatectomized rats. Lab Invest. 1993;68:270–276. [PubMed] [Google Scholar]
- 19.Liu ML, Mars WM, Zarnegar R, Michalopoulos GK. Uptake and distribution of hepatocyte growth factor in normal and regenerating adult rat liver. Am J Pathol. 1994;144:129–140. [PMC free article] [PubMed] [Google Scholar]
- 20.Bertola A, et al. Hepatocyte growth factor induces glucose uptake in 3T3-L1 adipocytes through A Gab1/phosphatidylinositol 3-kinase/Glut4 pathway. J Biol Chem. 2007;282:10325–10332. doi: 10.1074/jbc.M611770200. [DOI] [PubMed] [Google Scholar]
- 21.Perdomo G, et al. Hepatocyte growth factor is a novel stimulator of glucose uptake and metabolism in skeletal muscle cells. J Biol Chem. 2008;283:13700–13706. doi: 10.1074/jbc.M707551200. [DOI] [PMC free article] [PubMed] [Google Scholar]
- 22.DeAngelis T, Morrione A, Baserga R. Mutual interaction and reciprocal down-regulation between c-met and insulin receptor substrate-1. J Cell Physiol. 2010;224:658–663. doi: 10.1002/jcp.22164. [DOI] [PubMed] [Google Scholar]
- 23.Tomita K, et al. Pioglitazone prevents alcohol-induced fatty liver in rats through up-regulation of c-Met. Gastroenterology. 2004;126:873–885. doi: 10.1053/j.gastro.2003.12.008. [DOI] [PubMed] [Google Scholar]
- 24.Jiang JG, Johnson C, Zarnegar R. Peroxisome proliferator-activated receptor gamma-mediated transcriptional up-regulation of the hepatocyte growth factor gene promoter via a novel composite cis-acting element. J Biol Chem. 2001;276:25049–25056. doi: 10.1074/jbc.M101611200. [DOI] [PubMed] [Google Scholar]
- 25.Kosone T, et al. HGF ameliorates a high-fat diet-induced fatty liver. Am J Physiol Gastrointest Liver Physiol. 2007;293:G204–G210. doi: 10.1152/ajpgi.00021.2007. [DOI] [PubMed] [Google Scholar]
- 26.Marsenic O. Glucose control by the kidney: an emerging target in diabetes. Am J Kidney Dis. 2009;53:875–883. doi: 10.1053/j.ajkd.2008.12.031. [DOI] [PubMed] [Google Scholar]
- 27.Mellado-Gil J, et al. Disruption of hepatocyte growth factor/c-Met signaling enhances pancreatic beta-cell death and accelerates the onset of diabetes. Diabetes. 2011;60:525–536. doi: 10.2337/db09-1305. [DOI] [PMC free article] [PubMed] [Google Scholar]
Associated Data
This section collects any data citations, data availability statements, or supplementary materials included in this article.