Abstract
The goal of this paper is to propose a fast and reliable method of simultaneous estimation of conductivity and electrode contact impedances for a homogeneous 2-D disk. Magic Toeplitz matrix as the Neumann-to-Dirichlet map with finite width electrodes plays the central role in our linear model, called the gapZ model. This model enables testing of various hypotheses using the F-test, such as the uniformity of electrode impedances and their statistical significance. The gapZ model is compared with the finite element approximation, and illustrated and validated with a phantom tank experiment filled with saline. Further, this model was illustrated with the patient breast EIT data to identify bad contact electrodes.
Keywords: Boundary value problem, breast cancer, electrical impedance tomography, F-test, Laplace equation, Neumann-to-Dirichlet map
I. Introduction
ELECTRICAL impedance tomography (EIT) aims to reconstruct spatial conductivity and permittivity within the body by measuring currents and voltages on the periphery of the body. Basic formulation of EIT and its applications has been published elsewhere [1]–[3]. Several scientific centers, including Rensselaer Polytechnic Institute (RPI) [4] and Dartmouth College [5] concentrate on clinical application of EIT to breast imaging and cancer detection [6].
Two features of the EIT breast imaging make the problem of cancer detection challenging.
The presence of a layer of unknown conductivity at the skin–electrode interface. Due to the natural heterogeneity of the skin and variation of contact pressure the electrode contact impedance may vary from electrode to electrode. This variation introduces substantial biases and “contact artifacts” in the reconstruction of electric properties of the breast and makes detecting abnormalities difficult.
Since breast does not have rigid geometry, the boundary of the governing Laplace partial differential equation (PDE) is not well specified either in the planar design of RPI in which the breast is compressed between two plates [7], or in the Dartmouth circular design in which electrodes are configured radially around the circumference of the pendant breast [8]. An inaccurately specified boundary geometry results in high reproducibility error [9].
The presence of the surface impedance and its effect on the EIT image reconstruction is a well-known problem. Today, the varying electrode–skin contact impedance is listed as one of the most serious limitations of EIT for breast cancer detection [10]. Several techniques to reduce the unwanted surface impedance have been studied over the years, including application of skin hydrogel [11], or covering electrodes with a cotton fine grid [12]. A recent paper [13] compares several electrode–skin interface aids and their dependence on the current frequency. Despite some improvements the electrode contact impedance remains a challenging problem in clinical setting especially when it varies from electrode to electrode. It is, therefore, desirable to estimate the contact impedance at each electrode from the same data used for reconstruction. Unfortunately, this is difficult to achieve because simultaneous estimation of contact impedances and spatial conductivity and permittivity increases the ill-posedeness of the EIT problem. One potential solution is estimating contact impedance at each electrode by assuming that the tissue is homogeneous and then use those estimates for the full breast image reconstruction. A similar idea of the two-step EIT reconstruction based on an approximate solution to the Laplace PDE was pursued in a recent paper [7]. Simultaneous estimation of contact impedances and conductivity in a homogeneous tank based on the finite element approximation was studied in [14] and [15]. We, however, rely on the analytical solution of the homogeneous medium.
The analytical solution of Laplace equation in polar coordinates with Neumann boundary conditions on the plane with finite number of electrodes was derived in [16]. We use the Neumann-to-Dirichlet matrix that connects currents and voltages at the electrodes in the form of the generalized Ohm's law with circular geometry used for the EIT breast measurements. This matrix is called a Magic Toeplitz matrix since it possesses very peculiar properties [17]. This matrix plays the central role in our gapZ model for the simultaneous estimation of the background resistivity and contact impedance at each electrode.
The organization of this paper is as follows. In the next section, we review the mathematical formulation of the forward EIT problem with the two popular electrode models: the gap and complete electrode models. In Section III, the two electrode models are formulated for a 2-D homogeneous disk in polar coordinates and the analytical solution for the two versions of the gap model are derived in the matrix form. The gapZ model for the simultaneous estimation of the background resistivity and contact impedance is formulated in Section IV. Finally, the gapZ model is applied to a tank experiment phantom data in Section V.
II. General Formulation of Two Electrode Models
Although the general account of the EIT problem is presented in many papers, we need that formulation for derivation of the gap model with a finite number of electrodes and for interpretation of the complete electrode model that explains the voltage drop due to the contact impedance.
The goal of EIT is to reconstruct spatial conductivity σ = σ(s) within the body by injecting currents and measuring voltages (or applying voltages and measuring currents) at the electrodes located on the periphery of the body. Sometimes, the EIT problem is formulated in complex domain; in this paper, we restrict our consideration to real values. Here, s is a spatial coordinate vector; in 2-D we have s = (x, y) and in 3-D we have s = (x, y, z); for a homogeneous medium σ(s) = const. Throughout this paper boldface is used to indicate vectors and matrices. In this section, we specify the forward problem when the function σ is known.
It is assumed that there are L electrodes on the periphery of the body covering nonoverlapping surface areas Ei, i = 1, 2, . . . , L.
Potentials U1, U2, . . . , UL are applied at the electrodes such that . Within the body, the potential distribution is governed by the Laplace PDE written in a symbolic terms as
| (1) |
The task of the forward model is to find the potential function u = u(s) given σ = σ(s) using boundary conditions (BC) specified later. In all electrode models, it is assumed that there is no current flow on the boundary of the body between electrodes
| (2) |
where n is the normal vector on the surface of the body at point s, and ∂u/∂n denotes the projection of vector ∂u/∂s on n (a scalar function), or precisely
as the scalar product.
A. Gap Electrode Model
This model assumes that currents are injected into the body and the resulting voltages are measured at the same electrodes for reconstruction purpose. In the gap model, the BC is expressed in terms of the current density; namely, it is assumed that current density is constant over the electrode
| (3) |
where current Ii is controlled by the experiment. Note that in this model boundary conditions, (2) and (3) are expressed via the derivative of the solution function u. Such BC are called Neumann; note that in this case function u can be found up to a constant.
B. Complete Electrode Model
According to the complete electrode model
| (4) |
where Zi is the electrode contact (or surface) impedance, i = 1, 2, . . . , L [18]. It is common to assume that the contact impedance is constant over the area of the electrode but may be different across electrodes. The supplied potential is constant over the surface of the electrode because it is made of a highly conductive metal material. That is, the left-hand side of (4) does not depend on s. Note that
| (5) |
may be interpreted as the average voltage drop due to the electrode contact impedance, where |Ei| is the area of the electrode. We will use this interpretation later to recover the contact impedance from the data.
Model (1) together with BC (2) and (4) correctly reflects most engineering hardware designs and is the most comprehensive forward model of the electrical impedance problem [19].
The Laplace PDE with complete electrode model belongs to the case of mixed boundary condition PDE and is the most formidable mathematical problem with no general approach for solution even for homogeneous medium. On the other hand, the gap model has Neumann BC and can be solved fairly easy; this model will be used in our further development.
III. Homogeneous 2-D Disk
The analytical solution of the homogenous EIT problem may be used in several ways.
To obtain accurate background conductivity, especially useful for an abnormal mass detection, as deviation from the background conductivity. To improve the precision in estimating of the background conductivity resulting in increase of the statistical discrimination power.
To test the approximation to the PDE forward problem solution and to help in choosing the parameter values, such as the number of nodes in the finite element approximation or the number of terms in the series expansion.
To estimate the contact impedance {Zi, i = 1, 2, . . . , L} to be used in the full EIT reconstruction (see the next section).
To compare different electrode models without the complexity associated with the full EIT image reconstruction leading to an ill-posed inverse model.
To check the quality of measurements, especially important for clinical EIT data, where the homogeneity assumption is adequate as an initial guess.
The potential distribution on a homogeneous disk of radius R and conductivity σ = const with infinitesimal height is governed by the Laplace equation in polar coordinates, as a very special case of the general PDE (1)
| (6) |
where 0 ≤ r ≤ R is the distance from the center and 0 ≤ θ < 2π is the angle. As was mentioned earlier in this paper, it is assumed that all variables are real. For this case, the L nonoverlapping electrodes with half-width w (radians) are located on the circle of radius R at angle locations {θi, i = 1, 2, . . . , L}. Separation of variables [20] yields the solution expressed in Fourier series as
| (7) |
where coefficients an and bn are to be found from the BC, as discussed later. Different electrode models imply different Fourier coefficients but do not change the general form of this solution.
A. Gap Electrode Model
Moreover the current density is assumed constant over the electrode, [21]. Since the current density on the boundary of the domain is
a step function of the angle, the current flowing through the ith electrode is expressed as the integral
| (8) |
Note that this expression is true for any electrode model. Then using (7) and elementary trigonometry, we obtain
so that the current can be expressed as a Fourier series
| (9) |
The constant current density assumption leads to Neumann-type BC in the form
| (10) |
Note that since the BC is defined in terms of the derivative, the solution of the PDE is correct up to an arbitrary constant. As follows from (7), this constant is set to zero. Fourier coefficients an and bn are found from integration of both sides of (10) over (0, 2π) premulitiplied by cos(nθ) and sin(nθ). After some trigonometry [16], one obtains
with the gap solution
| (11) |
For reconstruction purposes (for conductivity, σ, estimation), the voltages are measured at the electrodes. We want to express the measured voltages via the injected currents to derive the Neumann-to-Dirichlet (NtD) map which can be viewed as Ohm's law on the homogeneous disk. As was mentioned in the previous section, two models regarding measured voltage may be considered. In the center-gap model, the measured voltage is equal to the potential function evaluated at the center of the electrode (point value), Ui = u(R, θi), which leads to the NtD map in the matrix form as
| (12) |
where A is the L × L symmetric matrix with the (i, j) element
| (13) |
where I and U are the L × 1 vectors of the injected currents and resulting voltages (we use boldface for vectors and matrices hereafter); hereafter, ρ = 1/σ is the resistivity of the medium.
In the ave-gap model, the measured voltage is the average potential over the electrode
which using (9) leads to the NtD map
| (14) |
where B is the L × L symmetric matrix with the (i, j) element
| (15) |
When the width of the electrodes becomes indefinitely small, the two matrices converge to
because limw→0 sin(nw)/n = w. This solution matches of that provided in [22] because
In a special case, when the electrodes are located at equal angles
| (16) |
which is usually the case, matrices A and B are symmetric circulants [23]. These matrices have rather remarkable properties and, therefore, were called the Magic Toeplitz matrices [17]
A linear combination of the Magic Toeplitz matrices is a Magic Toeplitz matrix.
The sum of elements in each row and column of a Magic Toeplitz matrix is the same.
The inverse of a Magic Toeplitz matrix is a Magic Toeplitz matrix.
The product of the two Magic Toeplitz matrices is a Magic Toeplitz matrix.
Matrix T is the Magic Toeplitz if and only if Tij = t|i–j and the sum of elements in each row and column is the same.
The n × n Magic Toeplitz matrix is defined by ⌈(n + 1)/2⌉ distinct elements, where ⌈⌉ denotes the closest larger integer.
Magic Toeplitz matrices are nonnegative definite, i.e., the eigenvalues are non-negative.
Magic Toeplitz matrices of the same size have the same eigenvectors.
Magic Toeplitz matrices commute, namely, if T1 and T2 are Magic Toeplitz matrices, then T1T2 = T2T1.
Property (2) means that if the sum of injected currents is zero, the sum of the resulting voltages is zero. Property (3) can be understood after expressing currents through voltages as I = σA−1U and I = σB−1U as in the Dirichlet-to-Neumann map.
A capacitance matrix connecting the vector of voltages with the vector of charges was derived in [24] for a general 2-D Laplace equation. It was proven that for an arbitrary geometry that matrix is symmetric and has properties #2 and #7. For a circular geometry and equidistant electrodes, this matrix is symmetric circulant.
IV. Statistical Model for Contact Impedance
One of the advantages of the analytical center-gap or avegap solution is that contact impedance at each electrode may be estimated without solving the forward problem. This may be especially helpful in medical applications when the contact impedances {Zl, l = 1, . . . , L} are first estimated assuming a homogeneous medium and then used in the full reconstruction.
As follows from (5), the effective (average) voltage on the 2-D homogeneous disk using (8) can be expressed as
This gives rise to the following definition.
Definition 1: The voltage drop on a homogeneous 2-D disk due to the ith electrode impedance is defined as ZiIi/(2Rw) with effective voltage Ui − ZiIi/(2Rw).
Since Ii/(2Rw) = Ji, the average current density, we can express the voltage drop as ZiJi. The idea of simultaneous estimation of the medium conductivity and electrode impedance is based on the substitution of real voltages with effective voltages in Ohm's law using either the center-gap model (12) or the avegap model (14). These models will be called center-gapZ and ave-gapZ models, respectively. Later, we describe the statistical models and their estimation.
Let us assume that K voltage patterns are used. For example, when using the full trigonometric pattern [25] we have K = L – 1. Then the data on voltage and current densities are expressed as L × K matrices U and J. If the center-gap model is used we arrive at a statistical model
| (17) |
where Z = diag(Z1, Z2, . . . , ZL) is a L × L diagonal matrix, and ε is the L × K matrix of random noise with zero mean, constant variance, and stochastically independent elements, and ρ = 1/σ is the resistivity of the medium. Using the least squares solution we can determine ρ and the contact impedance values simultaneously. Equivalently, model (17) can be represented as a linear statistical model [26], [27]
| (18) |
with ρ and Z1, Z2, . . . , ZL estimated from linear least squares as minimizers of the residual sum of squares
| (19) |
Model (18) can be represented as a standard linear regression model
where yLK×1 = vec(U), β(L+1)×1 = (ρ,Z1, . . . , ZL)′, the first column of matrix X is vec(AI) and the (j + 1)th column of matrix X is vec(Ej J), j = 1, 2, . . . , L; here vec is an operator which represents the matrix in a vector form. The last representation follows from the equation which implies .
In the special case, when all contact impedances are the same, Zj = Z we have a linear model with two unknown coefficients
| (20) |
where β1 = ρ, β2 = Z, x1 = vec(AI) and x2 = vec(J). In the ave-gapZ model, thematrix B is used instead of A.
These statistical models, called gapZ models, do not only simultaneously estimate medium conductivity and electrode surface impedances but also create a framework for addressing important practical questions from statistical perspective. For example, are contact impedances statistically different from zero? Are they statistically the same? Do any of the electrodes have significantly larger contact impedance? In the next section, we explore these questions with laboratory phantom.
V. Homogeneous Tank Experiment
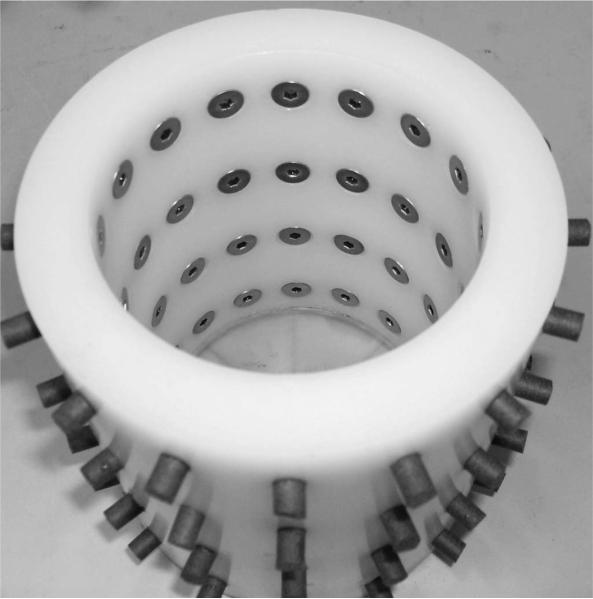
In this section, we describe a laboratory experiment with a tank filled with saline of approximate resistivity 10 Ωm. Our goal is to estimate the contact impedance at each electrode along with the medium resistivity as a function of 17 frequencies in the range of 10 kHz to 3.3 MHz using the ave-gapZ model and compare the results with the FEM approximate solution [28]. The empty tank is shown in Fig. 1. The diameter of the tank is 8.6 cm. In our experiment, only 16 electrodes at the bottom were used with the centers at 1.8-cm height. Homogeneous saline was filled to a height of 3.6 cm.
Fig. 1.
Cylinder tank with 16 electrodes in each plane used in homogeneous tank experiments (shown empty). The diameter of the tank is 8.6 cm. Saline of resistivity 10 m/S was filled at the height 3.6 from the bottom. The voltages are applied at polymer conductive buffer cylinders conected to round electrodes of diameter 1 cm at the bottom level, with the center 1.8 cm from the bottom.
Two models have been used for simultaneous estimation of resistivity and contact impedance using the least squares criterion separately for each frequency: the ave-gapZ model with 17 parameters, and an FEM with two parameters assuming that the contact impedance does not vary from electrode to electrode. We had convergence problems with the 3-D FEM approximation when all 16 contact impedances were unknown even when the Jacobian with respect to vector Z was computed exactly. Although the Newton-Gauss algorithm seemed to converge, for some frequencies we experienced divergency, but more importantly, different starting values produced different final iterations. This makes us to believe that previously reported simultaneous reconstruction of electrode impedances and conductivity based on the FEM approximation [14] may prone to instability.
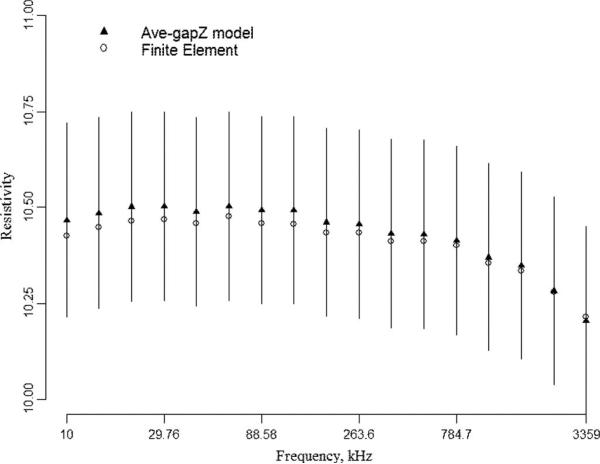
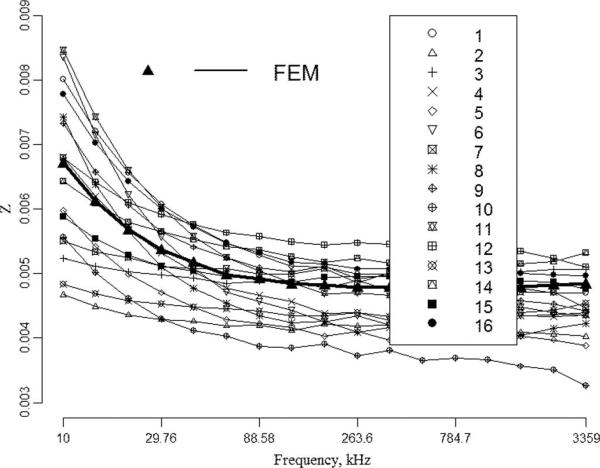
For each frequency, the FEM forward model was fit with a built-in nonlinear regression function nls in S+ (TIBCO Spotfire) with two unknown parameters (resistivity and contact impedance) using the finite difference approach to the Jacobian. The result of the ρ estimation along with 95% confidence interval is shown in Fig. 2. Sixteen contact impedances for the avegapZ models as a function of frequency are shown in Fig. 3. As follows from those graphs: 1) both models give similar results; 2) contact impedances vary across electrodes; and 3) contact impedances drop with frequency. A decrease of electrode–skin contact resistivity with frequency increase was also reported in [13]. For each frequency, we compute the average voltage drop as Z times median value of J/U; the voltage drop due to contact impedance is estimated to be approximately 11% of the applied voltage.
Fig. 2.
Resistivity ρ (Ωm) estimation using ave-gapZ model (18) and comparison with FEM approximation assuming constant electrode impedance. Verical bars show 95% confidence intervals.
Fig. 3.
Estimation of contact impedances Z (Ωcm2 ) using the gapZ model (18). The contact impedance obtained with FEM assumes that it is the same across electrodes.
The statistical significance of the contact impedance of each electrode was tested by the t-test that is the standard output of a linear model fit (the null hypothesis is that the contact impedance at electrode i is zero, H0 : Zi = 0). Although small, all contact impedances were statistically significant with p-value < 0.05.
As was mentioned before, the ave-gapZ model allows for various statistical tests. Perhaps the most important test is the zero-Z test: H0 : Z1 = Z2 = · · · = Z16 = 0 for each particular frequency. We use model (18) to test this hypothesis with the F-distribution [26], [27] (this test in the framework of EIT has been applied previously [16])
| (21) |
where QLS is the residual sum of squares (19), Q0 is the residual sum of squares under assumption that all Z are zero, ∥U−ρAI∥2, t is the number of linear equations in the hypothesis (in our case t = 16), N is the total number of observations, N = LK, and p is the total number of estimated parameters in the model (18), in our case p = 17. The tilde means that the random variable at the left-hand side of (21) has F-distribution with the specified degrees of freedom under the null hypothesis H0. For the 2-D disk tank data the p-values for all 17 frequencies are much less than 0.05, the threshold. We conclude that even though the Z-values are fairly small they are statistically different from zero.
Another important hypothesis to test is whether electrode impedances are the same, H0 : Z1 = Z2 = · · · = Z16 = Z. To test this hypothesis, we compute the residual sum of squares Q0 in the linear model with two parameters (20). Again P-values for all 17 frequencies were less than 0.05; we reject the hypothesis that all electrode impedances are the same. We attribute positive and statistically significant Zs with the presence of polymer buffers, see Fig. 1.
A. Validation of the gapZ Model
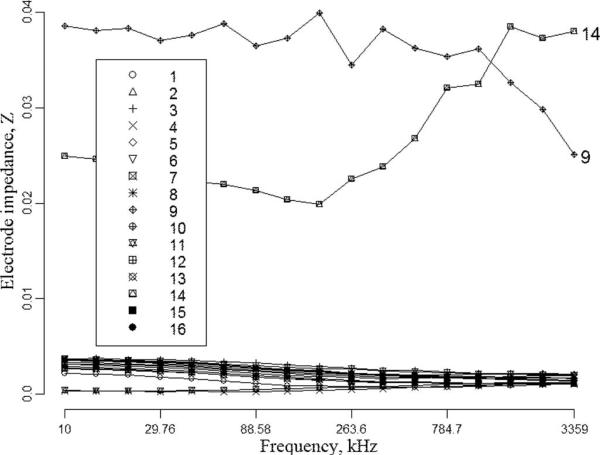
In order to validate the gapZ model, we conducted an EIT cylinder tank experiment filled with saline, similar to that described above, but with electrodes 9 and 14 partially covered by electrical tape. The goal of that experiment was to verify if the ave-gapZ model can identify those electrodes. The result of contact impedance estimation by the ave-gapZ model is depicted in Fig. 4. As we can see, the contact impedance of the covered electrodes is approximately ten times higher than that of the uncovered electrodes for all frequencies.
Fig. 4.
Estimation of bad electrode contact impedances using the ave-gapZ model with tank data in which electrodes 9 and 14 are partially covered by tape.
VI. Estimation of the Beast Contact Impedance
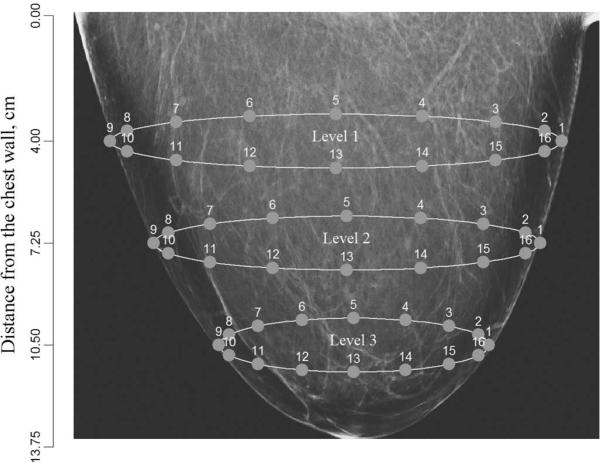
In this section, we apply our gapZ model to the patient breast measurement data using the Dartmouth EIT hardware [8]. The woman is in the lying position with 16 electrodes attached on the periphery of the pending breast. There are up to four levels of electrodes of diameter 1 cm. The first level is approximately 4 cm apart from the chest wall, the second level is at 7.25 cm, the third level is at 10.50 cm, etc. We illustrate the electrodes position in Fig. 5 using the mammogram image of the left breast of the normal patient. The breast is fairly homogeneous and was classified by the radiologist as “fatty.”
Fig. 5.
Dartmouth breast EIT hardware with three levels. There are 16 equidistant electrodes in each level. The real mammogram is used for this illustration. The gapZ model identified bad contacts at electrodes 6 and 7 in level 1 near the chest wall.
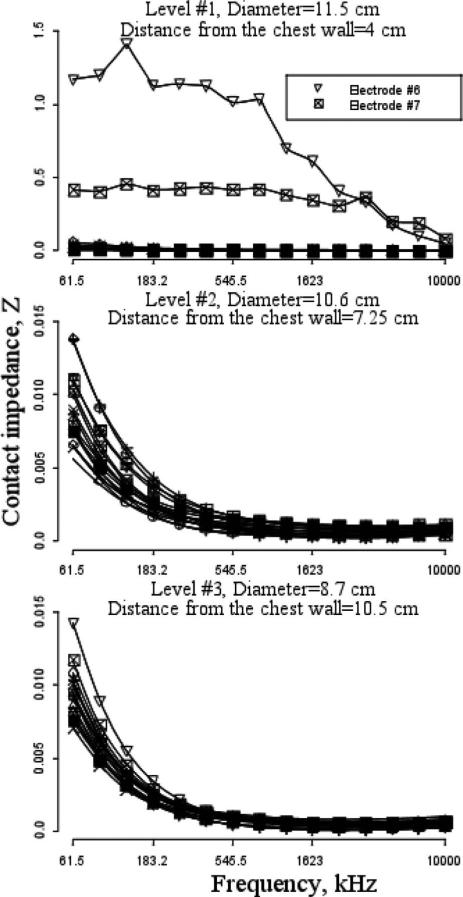
The results of the gapZ model for each of the three levels are presented in Fig. 6. Apparently there was a bad contact at electrodes 6 and 7 at level #1. Interestingly, the contact impedance is fairly small and fast approaches zero when current frequency increases. It makes us believe that image reconstruction with higher frequency is more robust with respect to the electrode contact impedance.
Fig. 6.
Estimation of contact impedance of the breast with 16 electrodes in three levels using the gapZ model. Contact on electrodes 6 and 7 in level 1 is bad.
VII. Summary and Discussion
We have derived Neumann-to-Dirichlet matrices for the center and ave-gap electrode models as the generalized Ohm's law on a disk. These matrices are symmetric circulants and possess very peculiar mathematical properties that led to their being called magic Toeplitz matrices. A new fast and reliable gapZ method for the simultaneous estimation of contact impedances and conductivity on the 2-D homogeneous disk has been developed using the magic Toeplitz matrix. This estimation is reduced to a linear statistical model and allows quick and important statistical hypothesis tests based on the general F-test, such as whether contact impedances are zero or constant across electrodes. The gapZ model was illustrated and validated with homogeneous tank data and in vivo EIT breast measurements. The gapZ linear model is especially convenient when various hypothesis are being tested, such as statistical significance, testing for bad electrodes, or constant contact impedance. The FEM approximation to the forward homogeneous EIT problem for simultaneous estimation conductivity and 16 contact impedances is unstable. Of course it does not mean that it will fail under other experimental conditions or mesh designs.
An important limitation of our approach is that it is 2-D. However, with Dartmouth design this limitation is less of an issue because electrodes are located on the same level plane around the breast.
We see the major application of the gapZ model in the identification of bad electrodes. Once the electrode contact impedances are checked, one can proceed with the full 3-D FEM breast image reconstruction.
Acknowledgments
This work was supported by the National Institutes of Health (NIH) under Grant CA130880.
Biography
 Eugene Demidenko (M'05) received the Ph.D. degree in statistics and computer science from the Academy of Sciences, Moscow, USSR, in 1977. He moved to the USA in 1992.
He is currently a Professor at the Section of Biostatistics and Epidemiology, Dartmouth Medical School and an Adjunct Professor at the Department of Mathematics and Thayer School of Engineering, Dartmouth College. He is the author of about 100 articles and three books in statistics, optimization, regression, and mixed models (two in Russian and one in English). He has broad interests in applied mathematics, statistics, optimization, computer science, econometrics, and biomathematics.
 Andrea Borsic (M'10) received the Ph.D. degree in electronic engineering from Oxford Brookes University, Oxford, U.K., working on regularization methods for inverse problems, with applications to imaging the electrical properties of the body.
After gradating he joined International Society of Matrix Biology (ISMB), a commercial partnership between the Polytechnic of Turin, Motorola, ST Microelectronics, SKF, and Telecom Italia, where he headed projects in the field of embedded systems and RFID technologies. In 2006, he joined Thayer School of Engineering at Dartmouth, where he is an Assistant Professor and pursues interests in biomedical imaging and inverse problems including breast cancer and prostate cancer detection using EIT and microwave imaging.
 Yuqing Wan received the B.E. degree in electrical engineering in Shanghai Jiao Tong University in Shanghai, China in 2007 and is currently woking toward the Ph.D. degree in biomedical engineering at Dartmouth College, Hanover, NH.
His current research interests include electrical impedance tomography, multimodal medical imaging system design, and its clinical applications.
 Ryan J. Halter (M'05) received the B.S. and M.S. degrees in engineering science and mechanics from The Pennsylvania State University, State College, in 1999 and 2001, respectively, and the Ph.D. degree in biomedical engineering from the Thayer School of Engineering at Dartmouth College, Hanover, NH, in 2006.
He conducted postdoctoral studies as the Norris Cotton Cancer Center, Lebanon, NH, from 2006 to 2008. He is an Assistant Professor of Engineering at Dartmouth College. His research interests are in the fields of medical device development and medical imaging. He primarily focuses on exploring the use of electrical impedance spectroscopy and tomography in clinical applications including cancer detection and imaging, surgical margin assessment, and traumatic brain injury monitoring.
 Alex Hartov (SM'89) received the BSEE degree with (high hons.) from Northeastern University, Boston, MA, in 1984 and the M.Sc. and Ph.D. degrees in biomedical engineering from Dartmouth College's Thayer School of Engineering, in 1988 and 1991, respectively.
He joined the Thayer School Faculty in 1996 and has been involved in projects covering various aspects of medical imaging. Among these are EIT for breast cancer screening, prostate cancer screening, image guided neurosurgery, fluorescence guided neurosurgery, and automated segmentation. Prior to returning to Graduate school Dr. Hartov worked for 6 years as an Electronics Engineer.
Contributor Information
Eugene Demidenko, Section of Biostatistics and Epidemiology, Department of Mathematics, Dartmouth College, Lebanon, NH 03756 USA (eugened@dartmouth.edu)..
Andrea Borsic, Thayer School of Engineering, Dartmouth College, Lebanon, NH 03756 USA.
Yuqing Wan, Thayer School of Engineering, Dartmouth College, Lebanon, NH 03756 USA.
Ryan J. Halter, Thayer School of Engineering, Dartmouth College, Lebanon, NH 03756 USA.
Alex Hartov, Thayer School of Engineering, Dartmouth College, Lebanon, NH 03756 USA.
References
- 1.Cheney M, Isaacson D, Newell JC. Electrical impedance tomography. SIAM Rev. 1999;41:85–101. [Google Scholar]
- 2.Brown BH. Electrical impedance tomography (EIT): A review. J. Med. Eng. Technol. 2003;27:97–108. doi: 10.1080/0309190021000059687. [DOI] [PubMed] [Google Scholar]
- 3.Bodenstein M, David M, Markstaller K. Principles of electrical impedance tomography and its clinical application. Crit. Care Med. 2009;37:713–724. doi: 10.1097/CCM.0b013e3181958d2f. [DOI] [PubMed] [Google Scholar]
- 4.Saulnier G, Liu N, Tamma CP, Xia H, Kao T-J, Newell J, Isaacson D. An electrical impedance spectroscopy system for breast cancer detection. Proc. IEEE European Molecular Biol. Conf. (EMBC) 2007 Aug.:4154–4157. doi: 10.1109/IEMBS.2007.4353251. [DOI] [PubMed] [Google Scholar]
- 5.Kerner TE, Paulsen KD, Hartov A, Soho SK, Poplack SP. Electrical impedance spectroscopy of the breast: Clinical imaging results in 26 subjects. IEEE Trans. Med. Imag. 2002 Jun.21(6):638–645. doi: 10.1109/tmi.2002.800606. [DOI] [PubMed] [Google Scholar]
- 6.Zou Y, Guo Z. A review of electrical impedance techniques for breast cancer detection. Med. Eng. Phys. 2003;25:79–90. doi: 10.1016/s1350-4533(02)00194-7. [DOI] [PubMed] [Google Scholar]
- 7.Boverman G, Isaacson D, Saulnier GJ, Newell JC. Methods for compensating for variable electrode contact in EIT. IEEE Trans. Biomed. Eng. 2009 Dec.56(12):2762–2772. doi: 10.1109/TBME.2009.2027129. [DOI] [PMC free article] [PubMed] [Google Scholar]
- 8.Hartov A, Kerner TE, Markova MT, Osterman KS, Paulsen KD. Dartmouth's next generation EIS system: Preliminary hardware considerations. Physiol. Meas. 2001;22:25–30. doi: 10.1088/0967-3334/22/1/304. [DOI] [PubMed] [Google Scholar]
- 9.Kolehmainen V, Lassas M, Ola P. Electrical impedance tomography problem with inaccurately known boundary and contact impedances. IEEE Trans. Med. Imag. 2008 Oct.27(10):1404–1414. doi: 10.1109/TMI.2008.920600. [DOI] [PubMed] [Google Scholar]
- 10.Sree SV, Ng EY-K, Acharya U R, Tan W. Breast imaging systems: A review and comparative study. J. Mech. Med. Biol. 2010;10:5–34. [Google Scholar]
- 11.McAdams ET, Jossinet J, Lackermeier A, Risacher R. Factors affecting electrode-gel-skin interface impedance in electrical impedance tomography. Med. Biomed. Eng. Comput. 1996;34:397–408. doi: 10.1007/BF02523842. [DOI] [PubMed] [Google Scholar]
- 12.Ji Z, Dong X, Shi X, You F, Fe F, Liu R. Novel electrode-skin interface for breast electrical impedance scanning. Med. Biomed. Eng. Comput. 2009;47:1045–1053. doi: 10.1007/s11517-009-0516-2. [DOI] [PubMed] [Google Scholar]
- 13.Yin Y, Ji Z, Zhang W, Wang N, Fu F, Liu R, You F, Shi Z, Dong X. Comparison of three kinds of electrode-skin interfaces for electrical impedance scanning. Ann. Biomed. Eng. 2010;38:2032–2039. doi: 10.1007/s10439-010-0053-z. [DOI] [PubMed] [Google Scholar]
- 14.Vilhunen T, Kaipio JP, Vauhkonen PJ, Savolainen T, Vauhkonen M. Simulteneous reconstruction of electrode contact impedances and internal electrical properties: I. Theory. Meas. Sci. Technol. 2002;13:1848–1854. [Google Scholar]
- 15.Heikkinen LM, Vilhunen T, West R, Vauhkonen M. Simulteneous reconstruction of electrode contact impedances and internal electrical properties: II. Laboratory experiments. Meas. Sci. Technol. 2002;13:1855–1861. [Google Scholar]
- 16.Demidenko E, Hartov A, Paulsen K. Statistical estimation of resistance/conductance by electrical impedance tomography measurements. IEEE Trans. Med. Imag. 2004 Jul.23(7):829–838. doi: 10.1109/TMI.2004.827965. [DOI] [PubMed] [Google Scholar]
- 17.Demidenko E. Separable Laplace equation, magic Toeplitz matrix, and generalized Ohm's law. Appl. Math. Comput. 2006;181:1313–1327. [Google Scholar]
- 18.Paulson K, Brekon W, Pidcock M. Electrode modeling in electrical impedance tomography. SIAM J. Appl. Math. 1992;52:1023–1040. [Google Scholar]
- 19.Cheng K-S, Isaacson D, Newell JC, Gisser DG. Electrode models for electric current computed tomography. IEEE Trans. Biomed. Eng. 1989 Sep.36(9):918–924. doi: 10.1109/10.35300. [DOI] [PMC free article] [PubMed] [Google Scholar]
- 20.Isaacson D. Distinguishability of conductivities by electric current computed tomography. IEEE Trans. Med. Imag. 1986 Jun.MI-5(2):91–95. doi: 10.1109/TMI.1986.4307752. [DOI] [PubMed] [Google Scholar]
- 21.Choi MH, Kao T-J, Isaacson D, Saulnier GJ, Newell JC. A reconstruction algorithm for breast cancer imaging with electrical impedance tomography in mammography geometry. IEEE Trans. Biomed. Eng. 2007 Apr.54(4):700–710. doi: 10.1109/TBME.2006.890139. [DOI] [PMC free article] [PubMed] [Google Scholar]
- 22.Pidcock MK, Kuzuoglu M, Leblebicioglu K. Analytic and semi-analytic solutions in electrical impedance tomography: I. Two-diemsional problems. Physiol. Meas. 1995;16:77–90. doi: 10.1088/0967-3334/16/2/001. [DOI] [PubMed] [Google Scholar]
- 23.Gray RM. Toeplitz and Circulant Matrices: A Review. Now; Boston, MA: 2006. [Google Scholar]
- 24.Fang W, Cumberbatch E. Matrix properties of data from electrical capacitance tomography. J. Eng. Math. 2005;51:127–146. [Google Scholar]
- 25.Cheney M, Isaacson D, Newell JC, Simske S, Goble J. NOSER an algorithm for solving the inverse conductivity problem. Int. J. Imag. Syst. Technol. 1990;2:66–75. doi: 10.1002/ima.1850020203. [DOI] [PMC free article] [PubMed] [Google Scholar]
- 26.Draper NR, Smith H. Applied Regression Analysis. 3rd ed. Wiley; New York: 1998. 1994. [Google Scholar]
- 27.Searle SR. Linear Models. Wiley; New York: 1971. [Google Scholar]
- 28.Borsic A, Hartov A, Paulsen KD, Manwaring P. 3D electric impedance tomography reconstruction on multi-core computing platforms. Proc. IEEE Eng. Med. Biol. Soc., 30th Annu. Int. Conf. 2008:1175–1177. doi: 10.1109/IEMBS.2008.4649371. [DOI] [PubMed] [Google Scholar]


