

Abstract
Pharmacological approaches to treat breast cancer metastases in the brain have been met with limited success. In part, the impermeability of the blood brain barrier (BBB) has hindered delivery of chemotherapeutic agents to metastatic tumors in the brain. BBB-permeable chemotherapeutic drugs are being developed, and noninvasively assessing the efficacy of these agents will be important in both preclinical and clinical settings. In this regard, dynamic contrast enhanced (DCE) and diffusion weighted imaging (DWI) are magnetic resonance imaging (MRI) techniques to monitor tumor vascular permeability and cellularity, respectively. In a rat model of metastatic breast cancer, we demonstrate that brain and bone metastases develop with distinct physiological characteristics as measured with MRI. Specifically, brain metastases have limited permeability of the blood brain barrier (BBB) as assessed with DCE and an increased apparent diffusion coefficient (ADC) measured with DWI compared to the surrounding brain. Microscopically, brain metastases were highly infiltrative, grew through vessel co-option, and caused extensive edema and injury to the surrounding neurons and their dendrites. By comparison, metastases situated in the leptomenengies or in the bone had high vascular permeability and significantly lower ADC values suggestive of hypercellularity. On histological examination, tumors in the bone and leptomenengies were solid masses with distinct tumor margins. The different characteristics of these tissue sites highlight the influence of the microenvironment on metastatic tumor growth. In light of these results, the suitability of DWI and DCE to evaluate the response of chemotherapeutic and anti-angiogenic agents used to treat co-opted brain metastases, respectively, remains a formidable challenge.
Keywords: magnetic resonance imaging, apparent diffusion coefficient, brain metastasis, vessel co-option, dynamic contrast enhancement, breast cancer, biomarker
Introduction
Breast cancer is one of the leading causes of cancer mortality worldwide, and advances in treating primary tumors of the breast have significantly improved patient outcome in recent decades [1]. Surgical, biological and chemotherapeutic agents along with advances in early detection methods have prolonged survival of patients with breast cancer. However, an unfortunate consequence of the improved survival is the increased incidence of breast cancer metastases, and most patients will ultimately succumb to metastatic disease [2, 3]. Although there has been some progress in reducing the development of new metastatic lesions, treatment of existing metastatic breast cancer has been largely ineffective [4]. Therefore, due to the increasing burden of breast cancer metastases, a better understanding of metastatic tumor colonization is important. In this regard, animal models of metastatic disease have been used to test treatment strategies in preclinical settings and have shed light on the complex nature of metastatic tumor formation and progression.
Breast cancer preferentially metastasizes to the lung, liver, bone, lymph nodes, and brain [5]. The central nervous system (CNS) is unique among these organs in that it is considered a sanctuary site for metastases [6]. In animal models of metastatic breast cancer to the brain, tumor cells preferentially grow through co-option of the existing vasculature [7, 8]. As a result, the co-opted brain vasculature remains relatively impermeable compared to metastatic sites in other organs [9]. Thus, delivery of biological and chemotherapeutic drugs to metastases has proven problematic [9, 10]. Moreover, the lack of neovascularization in co-opted tumors precludes the use of angiogenesis inhibitors to restrict tumor growth [11]. As a consequence, treatment of human breast cancer brain metastases has been largely ineffective [12-14]. BBB-permeable variants of chemotherapeutic agents are one approach to circumvent the limited vascular accessibility [10]. By comparison, extracerebral breast cancer metastases typically manifest as solid tumor masses. Considerable progress has been made in the treatment of extracerebral metastases using both chemotherapeutic [15] and anti-angiogenic therapies [16] due to the vascular accessibility of these tumors to the drugs.
MRI is the most widely used modality to evaluate treatment efficacy in tumors of the brain. Conventionally, tumor dimensions or volumes are considered primary endpoints as specified by the Response Evaluation Criteria in Solid Tumors (RECIST) guidelines [17]. However, advanced MRI techniques, including diffusion-weighted imaging (DWI) and dynamic contrast enhanced (DCE) MRI, complement volumetric measures by probing physiological features not appreciated by size alone. The apparent diffusion coefficient (ADC) measured with DWI has shown promise as a biomarker of chemotherapy and is sensitive to a tumor response days to weeks before a change in volume [18]. ADC is a marker of tumor cellularity in both humans [18] and rodent models [19] and is therefore an indicator of apoptosis and necrosis following effective cytotoxic therapy. Likewise, DCE is a biomarker of vascular changes that occur the absence of changes in tumor size [20]. DCE measures the vascular permeability that is altered by successful anti-angiogenic therapy. Although these MR metrics have yet to be fully validated [21], both techniques have demonstrated considerable promise in primary brain tumors. However, there has been a relative paucity of DCE and ADC measurements in metastatic brain tumors, despite the fact that the incidence of brain metastases outnumbers primary brain tumors by a factor of 10 [2].
We applied DWI and DCE MRI in a rat model of metastatic breast cancer [22] to determine the ADC and DCE features of metastatic breast tumors in the brain. Moreover, we sought to evaluate the potential differences between metastatic tumors situated in either the brain or bone since they are known to have significant microstructural differences. The results demonstrate that the microenvironments of metastatic tumors impart divergent microscopic growth patterns, and these features relate to distinct physiological and structural differences as measured by DCE and ADC MRI, respectively. Compared to metastatic sites in the bone, in which tumors developed as solid, expansive masses with high vascular permeability, the co-opted brain metastases had a limited permeability to gadolinium contrast agent. Moreover, brain metastases were associated with extensive interstitial edema in the infiltrated parenchyma. Microscopic evidence of acute injury in the form of beaded axons and dendrites was observed, and the subsequent degeneration of injured neurons was a likely cause of the continual elevations of ADC with prolonged growth. The results indicate that there may be significant challenges in using these ADC and DCE MRI to evaluate promising therapies in preclinical models.
Materials and Methods
Tumor Cell Line
MDA-MB-231-BR-eGFP cells (a gift from Dr. Diane Palmieri [6]) were cultured with DMEM growth media (Invitrogen, Carlsbad, CA) containing 10 % fetal bovine serum and 1 % penicillin streptomycin antibiotics at 37° C in a 5% CO2 conditioned incubator [22].
Animal Procedures
All studies were approved by the Animal Care and Use Committee at our institution. Twelve, 6 to 8 week old NIH-rnu rats (Charles River, Wilmington, MA) received 106 MDA-MB-231-BR-eGFP (231BR) cells by intracardiac (IC) injection. Rats were anesthetized with 2-3% isofluorane in 100 % O2. A 200 μl suspension of 106 tumor cells in 10 units/ml heparin in PBS was delivered into the left ventricle through a 27-gauge needle under real time ultrasound guidance using a 14 MHz linear probe (Acuson Sequoia C256, Siemens Medical Solutions, Malvern, PA). Rats underwent MRI prior to injection (baseline), 1 day post-injection, and weekly thereafter for 5 weeks. Rats were anesthetized with isofluorane delivered through a nosecone. Body temperature was maintained at 37° C using a circulating warm water pad. Animals were euthanized after the final imaging session or if they exhibited any evidence of significant weight loss (> 20 %), neurological changes such as paraplegia, or apparent pain or weakness in limbs.
Magnetic Resonance Imaging
In vivo MRI was performed on a 7 T Bruker Biospec (Billirica, Ma) using a 40 mm quadrature volume coil (Doty Scientific, Columbia, SC). For diffusion weighted imaging, a multiple-echo spin-echo sequence was used to acquire three non-weighted images and 15 diffusion-weighted images [23] with a b-value of 1000 s/mm2 and parameters: △ = 10 ms, δ = 4 ms, TR = 2250 ms, and TE = 20 ms. For DCE-MRI, T1-weighted gradient echo images (TR = 600 ms, TE = 10 ms) were acquired with variable flip angles (5, 10, 20, 30, 45, 60, 75, and 90) prior to and 13 minutes after the start of the dynamic series. Dynamic T1-weighted images were acquired during a bolus injection of 0.3 mmol/kg Gadolinium-dimeglemine (Gd-DTPA, Magnevist, Bayer-Schering Pharma, NJ) through the lateral tail-vein with the following parameters: TR = 600 ms, TE = 10 ms, flip angle = 60°, and temporal resolution = 12 s. Sixty time-points were acquired and the injection occurred on the 9th time-point. All datasets were acquired with 15 axial slices at a thickness of 0.5 mm and a matrix size of 128 × 128, yielding an in-plane resolution of 234 μm2.
Data Analysis
Images were reconstructed using custom software written in Matlab (Mathworks, Natick, MA). Parametric maps of the diffusion tensor, including the apparent diffusion coefficient (ADC=λ1+λ2+λ3)/3), were computed where λ1, λ2, and λ3 represent the eigenvalues following tensor diagonalization. DCE-MRI analysis was performed by calculating the pre-injection T1 relaxation time constant on a pixel-by-pixel basis from the variable flip-angle gradient echo images [24]. The signal intensity of the dynamic T1-weighted imaging series was converted to the change in T1 (△T1 = TR/ln(1-Si/S0), where S0 is the pre-injection signal intensity and Si is the post-injection change in intensity at the ith time-point. △T1 was subsequently converted to concentration of contrast agent[25] ([Gd]=△T1/r1 in mM) [26] where r1 is the relaxivity of Gd-DTPA in blood plasma at 7 Tesla (3.3 (mmol/L)−1·s−1) [27]. A non-model-based approach was used for visualization and quantification. Maps of the initial area under the gadolinium curve (IAUGC) were derived by integrating [Gd] for the first 90 seconds (8 timepoints) following the bolus injection.
T2-weighted images were registered to a common template using AIR 5.2.5 [28] and transformations were applied to the ADC and IAUGC90 parametric maps. Both brain and bone metastases underwent a region of interest (ROI) analysis and were manually circumscribed on T2-weighted images at each time point. A subset of brain metastases were not visible on T2-weighted or ADC images, but focal enhancement was seen on IAUGC90 maps, and these lesions were manually circumscribed on the post-contrast T1 maps. Metastases that were obviously meningeal were not included in the quantitative analysis. The largest diameter (LD) was derived from the circumscribed tumors using the Feret’s diameter measurement in ImageJ.
Functional diffusion maps (fDM) were created according to established methods [19]. Two successive ADC measurements in 4 control animals were used to derive the fDM threshold. A whole-brain mask was created by manually tracing the brain on the registered and averaged ADC maps, with regions near the ventricles and brain surface excluded. The pixel-by-pixel scatter plots from the two time-points yielded a mean ADC of 0.77 ×10⁻³ mm2/s and a 95 % confidence interval of ± 0.39 ×10⁻³ mm2/s. Brain metastases were first segmented at week 4 and used for the subsequent comparison between week 4 and week 5. Voxels with an ADC increase greater than the fDM threshold between baseline and week 4 were segmented, and only individual metastases larger than 275 μm3 (20 interconnected voxels) at week 4 were included. Twenty-four brain metastases survived the segmentation and were used for the subsequent fDM analysis. Four bone metastases were visible on T2-weighted images at week 4 and were manually segmented for inclusion in the fDM analysis. The fDM analysis consisted of calculating the fractional volume of voxels greater than or less than the fDM threshold separately for each tumor.
Histopathology
Perfusion-fixed brains were excised, immersed in 4 % paraformaldehyde overnight, cryoprotected in a sucrose gradient, frozen in liquid nitrogen, and sectioned at a thickness of eight microns. Immunofluorescence and hematoxylin and eosin (H&E) staining was performed as previously described [22]. Primary antibodies included anti-human CD44 (Abcam) or anti-human β1-integrin (Abcam) to identify MB231 cells and anti-rat Tusc5 (Genway), SMI31 (Covance), and MAP2 (Invitrogen) to identify endothelial cells, neurofilamants, and microtubules, respectively. Briefly, slides were rinsed with phosphate buffered saline (PBS), incubated with blocking serum for 5 min, and incubated with the primary antibody (1:200 dilution) at 4° C overnight. Sections were washed 3× with PBS, incubated with the secondary antibody (1:200 dilution) for 30 minutes at room temperature, rinsed 3× in PBS, and cover-slipped with VectaShield with 4′,6-diamidino-2-phenylindole (DAPI). Slides were imaged using brightfield or fluorescence microscopy (Zeiss Axio, Carl Zeiss Microimaging GmbH, Germany). Two percent Evans Blue dye was injected intravenously in a single animal containing both leptomenengial and parenchymal brain metastases just prior to euthanasia and perfusion fixation. Histological sections were prepared and extravasated dye was directly imaged using an excitation wavelength of 540 nm [29].
Statistical Analysis
Statistical analysis was performed using Prism (GraphPad Software, La Jolla, CA). A Student’s t-test was used to compare ADC, IAUGC90, and fDM values between brain and bone metastases or between brain metastases and the normal appearing brain. A Pearson’s coefficient was used to correlate ADC, IAUGC90, and LD values. A one-way ANOVA was used to assess the temporal progression of tumor ADC and volumes, and if the overall model was significant, individual post-hoc tests were performed using a Bonferroni correction for multiple comparisons. A one-sample t-test was used to compare fDM volume fractions to the theoretical value of 5 %. A p-value of 0.05 (two-tailed) was considered significant for all tests.
Results
Intracardiac delivery of MDA-MB-231BR-eGFP cells resulted in metastatic lesions developing within both the brain and bone by 4 weeks post injection. Metastases developing in these two different sites displayed disparate morphologies. Out of 12 animals receiving 231BR cells, 164 brain metastases were identified in 7 animals at week 5 as hyperintensities on the T2-weighted (Fig. 1A). No distinction was made between metastases within the brain parenchyma or leptomenengial metastases based on the MR images. Brain lesions displayed increased diffusivity compared to the surrounding cortex as shown by the ADC maps (Fig 1A). On brightfield and fluorescent microscopy, brain metastases displayed a clear co-opted morphology, with nearly all breast cancer cells growing within a few cell layers of the existing vasculature. These co-opted metastases were associated with cytotoxic edema or necrosis visualized as enlargement of the extracellular space surrounding the tumor cells. Bone metastases were evident on T2-weighted images as masses with high signal intensity compared to the surrounding muscle and appearing to originate from within the trabecular marrow spaces (Fig. 1B). Eleven bone metastases were observed in the temporal bone and mandibular joint on the MR images in 5 animals, since these regions were observable in the acquisition of brain MRI. ADC values of bone metastases were comparable to the normal brain. Histologically, bone metastases were hypercellular, solid masses with well-circumscribed margins.
Figure 1. Diffusion MRI and microscopic morphology of 231BR brain and bone metastases.

Brain metastases (A) had greater T2-weighted signal intensity and ADC compared to the surrounding brain, indicative of edema, whereas bone metastases (B) had ADC values comparable to the normal brain and were identifiable as masses with greater T2-weighted signal intensity compared to the surrounding muscle. The microscopic structure of brain metastases demonstrated growth by co-option of the existing vasculature, as nearly all tumor cells were closely associated with the vascular endothelial cells. By comparison, bone metastases developed as hypercellular solid masses with minimal infiltrating borders. Scale bars indicate 500 μm.
Metastatic sites in the brain and bone exhibited different physiological characteristics. Permeability was assessed using the semi-quantitative parameter initial area under the gadolinium curve (IAUGC90) derived from DCE-MRI. In co-opted brain metastases, there was limited or no extravasation of a low molecular weight gadolinium contrast agent (Fig. 2A) and indicated a relatively intact blood brain barrier (BBB). A fraction of brain metastases were not observable on T2-weighted images or ADC maps, but exhibited substantial leakage of gadiolinium chelate in what appeared to be within the brain parenchyma on MR images (Fig. 2B). Microscopic examination revealed that many of these metastatic lesions were situated in the leptomenengies or sulci of the cerebellum. The morphology of tumors residing in these regions were similar to those of the bone and were hypercellular masses without evidence of co-opting extracerebral vessels. The example in figure 2B did not invade the parenchyma, but occasionally, metastases spanned both environments with an infiltrative morphology in the parenchyma and a solid mass-like morphology outside of the parenchyma. Metastases situated in the meninges (Fig. 2C) or the bone (Fig. 2D) were highly permeable as evidenced by the substantial leakage of intraveneous gadolinium chelate and had ADC values comparable to the normal brain. Both of these metastatic sites promoted the development of hypercellular masses.
Figure 2. Metastatic site determines the growth pattern and differential ADC and DCE characteristics of 231BR metastases.

231BR metastases developing in the brain parenchyma (A) had extensive edema detected as increases in T2-weighted signal intensity and ADC, but the BBB was largely impermeable to Gd-DTPA in most of the brain metastases. Brain metastases displayed extensive increases in the extracellular space surrounding the co-opted metastatic foci. In comparison, metastases situated in the ventricles or sulci (B) developed as solid masses and were isointense with the surrounding brain on T2-weighted and ADC maps, but these tumors were highly permeable to Gd-DTPA as shown on the IAUGC90 maps. Likewise, metastatic sites in the meninges (C) and bone (D) promoted the growth of solid tumors with highly permeable vasculature. Scale bars indicate 200 μm.
A quantitative region of interest analysis (Table 1) was performed on all 164 brain metastases and 11 bone metastases manually identified on the T2-weighted images at 5 weeks post-injection (Fig. 3). Metastases situated in the brain had significantly greater ADC values (1.30 ± 0.22 μm2/ms; mean ± s.d.) compared to either the normal brain (0.77 ± 0.04 μm2/ms; p < 0.0001) or bone metastases (0.94 ± 0.06 μm2/ms; p < 0.0001). Brain metastasis had significantly lower IAUGC90 (0.03 ± 0.03 [Gd]*s) than bone metastases (0.19 ± 0.03 [Gd]*s; p < 0.0001) and significantly greater IAUGC90 than that of the normal brain (0.008 ± 0.003 [Gd]*s; p = 0.006). ADC and IAUGC90 had a significant inverse correlation (Table 2) in brain metastases (R2=0.369; p<0.0001) but not in bone metastases (R2=7.0 × 10⁻⁶; p = 0.99). Brain metastases size (largest diameter) had a significant, but low correlation with ADC (R2=0.065; p = 0.001) and was not correlated with IAUGC90 (R2=6.0 ×10⁻⁶; p=0.98). The size of bone metastases was significantly correlated with permeability (R2=0.793; p < 0.0001) but not with ADC (R2=0.086; p = 0.38).
Table 1.
Summary parameters and statistical comparisons between brain and bone metastases.
| Count | ADC | IAUGC90 | LD | |
|---|---|---|---|---|
| Brain | 164 | 1.30 ± 0.22 | 0.03 ± 0.03 | 1.67 ± 0.39 |
| Bone | 11 | 0.94 ± 0.06 | 0.19 ± 0.03 | 2.28 ± 0.93 |
| T-value * | - | 5.61 | 16.15 | 4.42 |
| p-value * | - | < 0.0001 | < 0.0001 | < 0.0001 |
Values indicate mean ± standard deviation. Units: ADC (× 10−3mm2/s), IAUGC90 ([Gd]*s), LD-Largest Diameter (mm).
T and p-values based on a two-sample t-test comparing brain and bone metastases.
Figure 3. Diffusion and permeability characteristics of 231BR brain and bone metastases.

Brain metastases had significantly greater ADC values (A) than normal brain tissue or bone metastases. In contrast, bone metastases had approximately a 6-fold greater permeability (B) compared to brain metastases. The scatter plot of all metastases (C) demonstrates a wide variability in ADC and IAUGC90 values among all brain metastases, with a significant inverse relationship between the two values. Bone metastases were also heterogeneous for IAUGC90. The values from the muscle and normal brain demonstrate the consistency of IAUGC90 and ADC measurements, respectively.
Table 2.
Correlation of MRI indices of metastases at week 5 post-injection.
Values indicate R2.
p = .001;
p < 0.0001.
In a slice-matched ADC and histological section, several large metastases were readily identified on both images (Fig. 4 A & B). However, the edema detected with ADC underestimated the extent of tumor infiltration. Moreover, many smaller metastases were seen on the histological section that were not observed on the ADC map. This is likely a consequence of the relative size of a MRI voxel (234×234×500 μm) compared to the histological section (8 μm thick) but is also complicated by both T2-weighted images and ADC maps being sensitive to the increased edema surrounding the metastatic cells, and not the cells themselves. The edema is visible on histological sections as increases in the extracellular space surrounding the co-opted MB231 cells (Fig. 4C). Compared to neurofilament staining (SMI31) for axons, MAP2 staining of dendrites qualitatively demonstrated a decrease in fluorescent intensity in the dendrites surrounding the infiltrating tumor cells (Fig. 5 A & B). Moreover, MAP2-stained dendrites demonstrated a beaded morphology suggestive of acute injury (Figs. 5 C & D). Correspondingly, decreased neuronal cell density was observed in the central region of the metastases (Fig. 5E) compared to the periphery and normal brain (Fig. 5F). In the animal administered intravenous Evans blue, dye extravasation was seen in a leptomenengial metastasis (Fig. 5G), but not in the infiltrative, parenchymal portion of the same tumor or in a separate lesion (Fig. 5H).
Figure 4. MRI underestimates co-opted tumor number and extent.

An ADC map (A) and a slice-matched histological section (B) are shown. The histological section demonstrated a greater number of micrometastases and a larger extent of infiltrating lesions than were seen on the ADC map. ADC is sensitive to edema shown histologically as increased extracellular space adjacent to infiltrating tumor cells (C). Scale bars indicate 2 mm in B and 500 μm in C.
Figure 5. Neuronal injury and loss in co-opted 231BR brain metastases.

MAP2 staining displayed extensive beading in dendrites in lesions (A & B) indicative of acute injury, whereas staining for the phosphorylated form of neurofilaments (SMI31) did not show a similar pattern. Panel B is an enlargement of panal A. At high magnification (C & D) the beading phenomenon appeared as focal enlargements on continuous dendrites (arrows). Compared to the periphery of the lesion (E), the number of neuronal cell bodies was decreased in the metastatic core (F). Solid metastases in the ventricles (G), but not co-opted cells in the brain (G & H) incorporated intraveneously injected Evan’s blue dye. Scale bars indicate 100 μm in A, E, F, G, & H, and 20 μm in B, C, & D.
Brain and bone metastases exhibited differential growth kinetics from weeks 3 to 5 (Fig. 6). Specifically, the ADC values of bone metastases were not significantly different throughout weeks 3 to 5 (F = 2.47; p = 0.12). In contrast, the ADC measured in brain metastases continued to increase through time (F=32.0; p < 0.0001), increasing significantly from week 3 to week 4 (t=6.0; p < 0.001) and from week 4 to week 5 (t=3.2; p < 0.01). Both brain (F = 15.56; p < 0.0001) and bone (F=5.76; p = 0.013) metastases exhibited significant increases in volume over the 2 weeks studied.
Figure 6. Differential growth kinetics of metastases situated in the brain or bone.
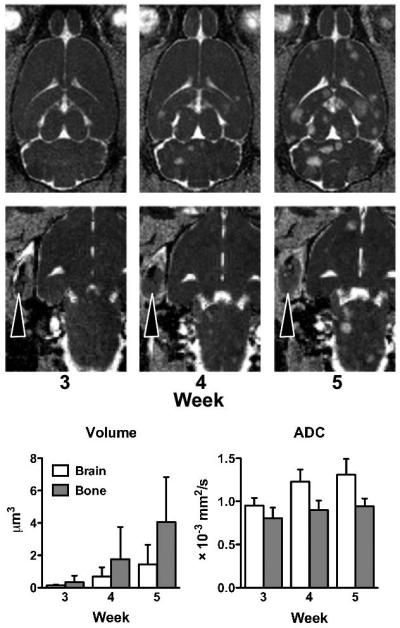
Brain metastases, depicted on ADC maps, increase in both size and the number from weeks 3 to 5 post-injection. The MRI-defined tumor margins expanded at a greater rate in bone metastases than in brain metastases. The ADC of bone metastases remained stable over the course of disease, but the ADC of brain metastases continued to increase over time.
The functional diffusion map method of analysis was performed to identify the ADC changes on a pixel-by-pixel basis (Fig. 7). Brain metastases were first segmented from week 4 images. Pixels with a significant increase in ADC at week 4 compared to pre-injection values were included and interconnected pixels greater than 275 μm3 were considered as individual tumors (Fig. 7A). The 24 separate brain metastases surviving the segmentation exhibited a significantly greater positive than negative fDM fraction from weeks 4 to 5 (t = 5.8; p < 0.0001). Whereas the positive fDM fraction was significantly greater than the theoretical 5 % change expected from two successive measurements (t = 5.3, p < 0.0001), the negative fDM fraction was significantly less than 5 % (t = 5.03, p < 0.0001). In the 4 bone metastases present at week 4 (Fig. 7B), by comparison, the positive or negative fDM fractions from weeks 4 to 5 were not significantly different from one another (t = 2.3; p = 0.10), nor were they significantly different than the theoretical 5 % (pos fDM: t = 2.9, p = 0.06; neg fDM: t = 0.06, p = 0.96).
Figure 7. Functional diffusion maps (fDM) demonstrate the spatial changes in developing metastases.

Metastases were segmented as voxels having a significant increase in ADC (positive fDM; red) on week 4 compared to baseline (A). These regions were evaluated for fDM changes from week 4 to week 5. The fraction of positive-shifted voxels increased across all metastases shown for a single animal. Bone metastases were manually segmented at week 4 (B), and ADC values were stable from week 4 to 5. Across all animals (C), brain metastases (n = 23) exhibited increased fractional volumes of positive ADC changes but with significant heterogeneity. By comparison, bone metastases (n = 4) did not have significant changes with fDM analysis.
Discussion
Noninvasively assessing cancer therapies is important for patient management and as outcome measures in clinical trials and preclinical drug development. In primary tumors of the brain, DCE-MRI and ADC have shown increased sensitivity to the effects of anti-angiogenic and chemotherapeutic agents, respectively, compared to measurements of tumor volume. However, their application to metastatic tumors in the brain has received considerable less attention despite the greater incidence of brain metastases, in part, because brain metastases have a poor response to existing pharmacologic treatments. Preclinical models of metastatic disease have provided a platform for the development and testing of newer treatment strategies, and MRI of such models is equally well suited to accelerate discovery. Therefore, we examined the natural progression of DCE-MRI and ADC in a rat model of breast cancer metastases to the brain and bone to determine the utility of these techniques in preclinical drug discovery. Our results demonstrate substantially different pathologies and physiologies of metastases situated in either the brain or bone. Metastases in the bone were highly permeable and had stable ADC values over time, reflecting the microscopic morphology of well-vascularized, solid tumor masses. These properties make treatments with anti-angiogenic and chemotherapeutic agents feasible, and DCE-MRI and ADC are amenable to monitor the efficacy of such treatments, respectively. In MDA-MB-231 breast cancer bone metastases treated with anti-angiogenic therapy, permeability changes were evident with no change in cellularity, as measured with ADC, as expected [30, 31]. By comparison, in both animal[32] and human[33] prostate cancer metastases to the bone, ADC was an indicator of responsiveness to cytotoxic therapy.
In the current study and others, MB231BR brain metastases grew through co-option of the existing vasculature. DCE-MRI demonstrated that the BBB had limited, although heterogeneous permeability in co-opted tumors, consistent with previous reports [34, 35]. The permeability of MB231 brain metastases has been previously evaluated in mice using post-mortem analyses of tracer uptake [9, 10]. Despite the differences in technique, the 3.5-fold increase in permeability in brain metastases compared to the normal brain as measured with DCE MRI is consistent with those studies. Moreover, the co-opted growth of brain metastases caused extensive edema of the invaded parenchyma in the form of enlarged extracellular spaces. As a consequence of the additional free water content, ADC measurements were elevated in metastases compared to the surrounding normal brain. High ADC values were also reported in human cerebral metastases originating from the lung or breast [36, 37]. In the current study, ADC increased with continued tumor growth as measured with both an ROI analysis and a pixelwise fDM analysis. Since ADC increases are typically associated with tumor cell apoptosis and necrosis following cytotoxic therapy, the increased ADC with normal tumor growth may limit the ability of DWI to monitor effective cytotoxic therapy in co-opted tumors in the brain.
The MDA-MB-231BR “brain-seeking” breast cancer cells preferentially metastasize to the brains of rats and mice following delivery to the peripheral circulation[38], although previous work has shown that bone metastases are equally possible [22, 39]. Our results and those of others [40] have demonstrated that highly vascularized tissues, such as the brain, promote the co-opted growth pattern of breast cancer micrometastases[7, 8]. Although co-opted tumor growth is independent of angiogenesis [11], and angiogenesis is often associated with insufficient oxygen supply, it is tempting to relate vessel co-option as means of maintaining partial pressure of oxygen. However, vessel co-option of MB-231BR cells appears to be regulated by molecular cues in the basement membrane, including β1-integrin, which promotes infiltrative and invasive growth[7, 41]. As demonstrated in this study, although different microenvironments are equally hospitable for tumor cell replication, these same microenvironments cause vastly different pathologies and physiologies measured with microscopy and MRI, respectively.
The finding that co-opted breast cancer brain metastases causes injury to the surrounding neurons is important. Previous studies with the same breast cancer cell line demonstrated a lack of caspase-3-positive, apoptotic cells surrounding metastases[42]. As shown in figure 5, neuronal densities were decreased in metastases, and MAP2 stained sections depicted a beaded morphology of dendrites. Beading is a consequence of acute hypoxic or excitotoxic injury in dendrites[43], but it is unknown whether the injury shown herein is a consequence of either, or both, mechanisms. Excitotoxic injury is most often associated with excessive release of the excitatory neurotransmitter glutamate. It has been implicated in the invasiveness and neuronal injury associated with gliomas [44, 45], and although MB-231 cells release glutamate [46], it is unknown whether they do so in sufficient concentrations to promote neuronal injury and death [47]. An alternative mechanism of neuronal injury may be caused by the physical nature of co-opted growth, which is known to occlude vessels [48] or induce vascular remodeling [49]. These physical changes could reduce blood flow and create ischemic conditions, and this is consistent with the notion that hypoxia induces death in neurons but promotes invasiveness of MB-231 cells [50]. The effects of metastatic growth on the integrity and functionality of neurons certainly warrants further investigation.
Both T2-weighted and ADC images are sensitive to the consequences of tumor growth in the brain (edema) and are not a direct marker of tumor cells, despite the demonstrated correlation between cellularity and ADC for solid tumors of the brain and body [51, 52]. Consequently, these MRI indices clearly underestimate the extent and number of brain lesions compared to corresponding histological sections (Fig. 4). Volumetric measurements made according to the RECIST criteria have been used as outcome measures in clinical trials of breast cancer metastases in the brain [12, 14], lung [53], liver [53], and bone [41]. However, more sensitive techniques are needed to accurately monitor the extent of highly invasive tumors of the brain[54]. The sensitivity, or lack thereof, of MRI to infiltrative lesions is also a consideration when assessing the issue of tumor dormancy [55], as co-opted micrometastases may be undetectable with MRI due to the low cellular density and minimal edema. Among the potential methods to improve sensitivity, intravascular superparamagnetic iron oxide nanoparticle based MRI contrast agents have shown promise in detecting BBB-impermeable brain tumors[56].
An important consideration of all preclinical models is the applicability to the human situation. Regarding the MRI outcome measurements, both DCE-MRI and DWI have been shown to be similarly effective in numerous animal models and humans cancers. Aside from the considerations of improved signal-to-noise ratio and therefore higher resolution of preclinical MRI, DCE-MRI and DWI are directly translatable to clinically relevant field strengths of 1.5 T and 3 T compared to the 7 T animal scanner used in the current study. ADC measurements are independent of field strength and have been widely applied to the study of cancers. DCE-MRI has benefits to being performed at lower field strengths, owing to the increased longitudinal (r1) relaxivity of gadolinium agents at lower magnetic fields. However, the use of either model-based or model-free approaches to analyze DCE-MRI data is the subject of debate [25]. While substantial efforts have been made to obtain quantitative measurements of transfer coefficients and permeability using pharmacokinetic modeling, these model-based approaches are not without certain assumptions and limitations. On the other hand, model-free measurements, such as the IAUGC90 used in the current study, are a non-specific combination of vascular permeability, blood flow, and fractional interstitial volumes, and therefore have their own limited interpretability. Nonetheless, our intention in the current study was to demonstrate the relative permeability of metastases within two different sites detected within the same animal. Therefore IAUGC90 is adequately suited for that purpose. The inter-tumor heterogeneity of IAUGC90 measurements are likely the result of true physiological differences, since the control measurements in the muscle were highly consistent among animals. Since model-free DCE measurements are often sufficient in clinical situations, the results of the current study are directly relevant to brain metastases in humans.
Conclusions
The results in the current study demonstrate that breast cancer metastases growing through vessel co-option in the brain exhibit increases in ADC (and fDM) that are typically interpreted as a clinical treatment effect (i.e., cytotoxic killing) in primary brain tumors. The changes in the current study are associated with injury to the surrounding neurons suggestive of acute hypoxia, excitotoxicity, or both, as a result of tumor expansion. The clinical applications of such findings are that using ADC to monitor patients with metastatic disease in the brain in therapeutic trials would first require validation in imaging-based clinical trials. Moreover, neuroprotective strategies may be added to chemotherapeutic regimes in the treatment of metastatic breast cancer in the brain in order to minimize collateral damage to the infiltrated brain tissue. Finally, we demonstrated the limited degree of BBB disruption in breast cancer brain metastases, and this may preclude the use of anti-angiogenic drugs in co-opted tumors of the brain.
Acknowledgements
This study was supported by the Intramural Research Program of the Clinical Center at the National Institutes of Health. We thank Molly Resnick for assistance with data analysis.
Abbreviations
- ADC
apparent diffusion coefficient
- BBB
blood brain barrier
- CNS
central nervous system
- DCE
dynamic contrast enhanced
- DWI
diffusion weighted imaging
- IAUGC
Initial area under the gadolinium curve
- MRI
magnetic resonance imaging
- MAP2
microtubule associated protein 2
- RECIST
Response Evaluation Criteria in Solid Tumors (RECIST)
- ROI
region of interest
References
- 1.Tkaczuk KH. Review of the contemporary cytotoxic and biologic combinations available for the treatment of metastatic breast cancer. Clinical therapeutics. 2009;31(Pt 2):2273–89. doi: 10.1016/j.clinthera.2009.11.011. [DOI] [PubMed] [Google Scholar]
- 2.Gril B, et al. Translational research in brain metastasis is identifying molecular pathways that may lead to the development of new therapeutic strategies. Eur J Cancer. 2010;46(7):1204–10. doi: 10.1016/j.ejca.2010.02.033. [DOI] [PMC free article] [PubMed] [Google Scholar]
- 3.Steeg PS, Theodorescu D. Metastasis: a therapeutic target for cancer. Nature clinical practice. 2008;5(4):206–19. doi: 10.1038/ncponc1066. [DOI] [PMC free article] [PubMed] [Google Scholar]
- 4.Weil RJ, et al. Breast cancer metastasis to the central nervous system. Am J Pathol. 2005;167(4):913–20. doi: 10.1016/S0002-9440(10)61180-7. [DOI] [PMC free article] [PubMed] [Google Scholar]
- 5.Nicolson GL. Organ specificity of tumor metastasis: role of preferential adhesion, invasion and growth of malignant cells at specific secondary sites. Cancer Metastasis Rev. 1988;7(2):143–88. doi: 10.1007/BF00046483. [DOI] [PubMed] [Google Scholar]
- 6.Palmieri D, et al. The biology of metastasis to a sanctuary site. Clin Cancer Res. 2007;13(6):1656–62. doi: 10.1158/1078-0432.CCR-06-2659. [DOI] [PubMed] [Google Scholar]
- 7.Carbonell WS, et al. The vascular basement membrane as “soil” in brain metastasis. PLoS One. 2009;4(6):e5857. doi: 10.1371/journal.pone.0005857. [DOI] [PMC free article] [PubMed] [Google Scholar]
- 8.Kienast Y, et al. Real-time imaging reveals the single steps of brain metastasis formation. Nat Med. 2010;16(1):116–22. doi: 10.1038/nm.2072. [DOI] [PubMed] [Google Scholar]
- 9.Lockman PR, et al. Heterogeneous blood-tumor barrier permeability determines drug efficacy in experimental brain metastases of breast cancer. Clin Cancer Res. 2010;16(23):5664–78. doi: 10.1158/1078-0432.CCR-10-1564. [DOI] [PMC free article] [PubMed] [Google Scholar]
- 10.Thomas FC, et al. Uptake of ANG1005, a novel paclitaxel derivative, through the blood-brain barrier into brain and experimental brain metastases of breast cancer. Pharm Res. 2009;26(11):2486–94. doi: 10.1007/s11095-009-9964-5. [DOI] [PMC free article] [PubMed] [Google Scholar]
- 11.Leenders WP, et al. Antiangiogenic therapy of cerebral melanoma metastases results in sustained tumor progression via vessel co-option. Clin Cancer Res. 2004;10(18 Pt 1):6222–30. doi: 10.1158/1078-0432.CCR-04-0823. [DOI] [PubMed] [Google Scholar]
- 12.Lin NU, et al. Phase II trial of lapatinib for brain metastases in patients with human epidermal growth factor receptor 2-positive breast cancer. J Clin Oncol. 2008;26(12):1993–9. doi: 10.1200/JCO.2007.12.3588. [DOI] [PMC free article] [PubMed] [Google Scholar]
- 13.Luu TH, et al. A phase II trial of vorinostat (suberoylanilide hydroxamic acid) in metastatic breast cancer: a California Cancer Consortium study. Clin Cancer Res. 2008;14(21):7138–42. doi: 10.1158/1078-0432.CCR-08-0122. [DOI] [PMC free article] [PubMed] [Google Scholar]
- 14.Trudeau ME, et al. Temozolomide in metastatic breast cancer (MBC): a phase II trial of the National Cancer Institute of Canada - Clinical Trials Group (NCIC-CTG) Ann Oncol. 2006;17(6):952–6. doi: 10.1093/annonc/mdl056. [DOI] [PubMed] [Google Scholar]
- 15.Morris PG, McArthur HL, Hudis CA. Therapeutic options for metastatic breast cancer. Expert opinion on pharmacotherapy. 2009;10(6):967–81. doi: 10.1517/14656560902834961. [DOI] [PubMed] [Google Scholar]
- 16.Marty M, Pivot X. The potential of anti-vascular endothelial growth factor therapy in metastatic breast cancer: clinical experience with anti-angiogenic agents, focusing on bevacizumab. Eur J Cancer. 2008;44(7):912–20. doi: 10.1016/j.ejca.2008.01.005. [DOI] [PubMed] [Google Scholar]
- 17.Eisenhauer EA, et al. New response evaluation criteria in solid tumours: revised RECIST guideline (version 1.1) Eur J Cancer. 2009;45(2):228–47. doi: 10.1016/j.ejca.2008.10.026. [DOI] [PubMed] [Google Scholar]
- 18.Moffat BA, et al. Functional diffusion map: a noninvasive MRI biomarker for early stratification of clinical brain tumor response. Proc Natl Acad Sci U S A. 2005;102(15):5524–9. doi: 10.1073/pnas.0501532102. [DOI] [PMC free article] [PubMed] [Google Scholar]
- 19.Moffat BA, et al. The functional diffusion map: an imaging biomarker for the early prediction of cancer treatment outcome. Neoplasia. 2006;8(4):259–67. doi: 10.1593/neo.05844. [DOI] [PMC free article] [PubMed] [Google Scholar]
- 20.Barrett T, et al. MRI of tumor angiogenesis. J Magn Reson Imaging. 2007;26(2):235–49. doi: 10.1002/jmri.20991. [DOI] [PubMed] [Google Scholar]
- 21.Sargent DJ, et al. Validation of novel imaging methodologies for use as cancer clinical trial end-points. Eur J Cancer. 2009;45(2):290–9. doi: 10.1016/j.ejca.2008.10.030. [DOI] [PMC free article] [PubMed] [Google Scholar]
- 22.Song HT, et al. Rat model of metastatic breast cancer monitored by MRI at 3 tesla and bioluminescence imaging with histological correlation. Journal of translational medicine. 2009;7:88. doi: 10.1186/1479-5876-7-88. [DOI] [PMC free article] [PubMed] [Google Scholar]
- 23.Hasan KM, Parker DL, Alexander AL. Comparison of gradient encoding schemes for diffusion-tensor MRI. J Magn Reson Imaging. 2001;13(5):769–80. doi: 10.1002/jmri.1107. [DOI] [PubMed] [Google Scholar]
- 24.Wang HZ, Riederer SJ, Lee JN. Optimizing the precision in T1 relaxation estimation using limited flip angles. Magn Reson Med. 1987;5(5):399–416. doi: 10.1002/mrm.1910050502. [DOI] [PubMed] [Google Scholar]
- 25.Yankeelov TE, Gore JC. Dynamic Contrast Enhanced Magnetic Resonance Imaging in Oncology: Theory, Data Acquisition, Analysis, and Examples. Current medical imaging reviews. 2009;3(2):91–107. doi: 10.2174/157340507780619179. [DOI] [PMC free article] [PubMed] [Google Scholar]
- 26.Parker GJ, et al. Probing tumor microvascularity by measurement, analysis and display of contrast agent uptake kinetics. J Magn Reson Imaging. 1997;7(3):564–74. doi: 10.1002/jmri.1880070318. [DOI] [PubMed] [Google Scholar]
- 27.Noebauer-Huhmann IM, et al. Gadolinium-based magnetic resonance contrast agents at 7 Tesla: in vitro T1 relaxivities in human blood plasma. Investigative radiology. 2010;45(9):554–8. doi: 10.1097/RLI.0b013e3181ebd4e3. [DOI] [PubMed] [Google Scholar]
- 28.Woods RP, et al. Automated image registration: II. Intersubject validation of linear and nonlinear models. Journal of computer assisted tomography. 1998;22(1):153–65. doi: 10.1097/00004728-199801000-00028. [DOI] [PubMed] [Google Scholar]
- 29.Hawkins BT, Egleton RD. Fluorescence imaging of blood-brain barrier disruption. Journal of neuroscience methods. 2006;151(2):262–7. doi: 10.1016/j.jneumeth.2005.08.006. [DOI] [PubMed] [Google Scholar]
- 30.Bauerle T, et al. Drug-induced vessel remodeling in bone metastases as assessed by dynamic contrast enhanced magnetic resonance imaging and vessel size imaging: a longitudinal in vivo study. Clin Cancer Res. 2010;16(12):3215–25. doi: 10.1158/1078-0432.CCR-09-2932. [DOI] [PubMed] [Google Scholar]
- 31.Bauerle T, et al. Imaging anti-angiogenic treatment response with DCE-VCT, DCE-MRI and DWI in an animal model of breast cancer bone metastasis. Eur J Radiol. 2010;73(2):280–7. doi: 10.1016/j.ejrad.2008.10.020. [DOI] [PubMed] [Google Scholar]
- 32.Lee KC, et al. An imaging biomarker of early treatment response in prostate cancer that has metastasized to the bone. Cancer Res. 2007;67(8):3524–8. doi: 10.1158/0008-5472.CAN-06-4236. [DOI] [PubMed] [Google Scholar]
- 33.Lee KC, et al. A feasibility study evaluating the functional diffusion map as a predictive imaging biomarker for detection of treatment response in a patient with metastatic prostate cancer to the bone. Neoplasia. 2007;9(12):1003–11. doi: 10.1593/neo.07954. [DOI] [PMC free article] [PubMed] [Google Scholar]
- 34.Blasberg RG, et al. Local blood-to-tissue transport in Walker 256 metastatic brain tumors. J Neurooncol. 1984;2(3):205–18. doi: 10.1007/BF00253272. [DOI] [PubMed] [Google Scholar]
- 35.Zhang RD, et al. Differential permeability of the blood-brain barrier in experimental brain metastases produced by human neoplasms implanted into nude mice. Am J Pathol. 1992;141(5):1115–24. [PMC free article] [PubMed] [Google Scholar]
- 36.Duygulu G, et al. Intracerebral metastasis showing restricted diffusion: correlation with histopathologic findings. Eur J Radiol. 2010;74(1):117–20. doi: 10.1016/j.ejrad.2009.03.004. [DOI] [PubMed] [Google Scholar]
- 37.Krabbe K, et al. MR diffusion imaging of human intracranial tumours. Neuroradiology. 1997;39(7):483–9. doi: 10.1007/s002340050450. [DOI] [PubMed] [Google Scholar]
- 38.Yoneda T, et al. A bone-seeking clone exhibits different biological properties from the MDA-MB-231 parental human breast cancer cells and a brain-seeking clone in vivo and in vitro. J Bone Miner Res. 2001;16(8):1486–95. doi: 10.1359/jbmr.2001.16.8.1486. [DOI] [PubMed] [Google Scholar]
- 39.Song HT, et al. Quantitative T(2)* imaging of metastatic human breast cancer to brain in the nude rat at 3 T. NMR in biomedicine. 2010 doi: 10.1002/nbm.1596. [DOI] [PMC free article] [PubMed] [Google Scholar]
- 40.Palmieri D, et al. Her-2 overexpression increases the metastatic outgrowth of breast cancer cells in the brain. Cancer Res. 2007;67(9):4190–8. doi: 10.1158/0008-5472.CAN-06-3316. [DOI] [PubMed] [Google Scholar]
- 41.Charles N, Holland EC. The perivascular niche microenvironment in brain tumor progression. Cell Cycle. 2010;9(15):3012–21. doi: 10.4161/cc.9.15.12710. [DOI] [PMC free article] [PubMed] [Google Scholar]
- 42.Fitzgerald DP, et al. Reactive glia are recruited by highly proliferative brain metastases of breast cancer and promote tumor cell colonization. Clin Exp Metastasis. 2008;25(7):799–810. doi: 10.1007/s10585-008-9193-z. [DOI] [PMC free article] [PubMed] [Google Scholar]
- 43.Park JS, Bateman MC, Goldberg MP. Rapid alterations in dendrite morphology during sublethal hypoxia or glutamate receptor activation. Neurobiol Dis. 1996;3(3):215–27. doi: 10.1006/nbdi.1996.0022. [DOI] [PubMed] [Google Scholar]
- 44.Rzeski W, Turski L, Ikonomidou C. Glutamate antagonists limit tumor growth. Proc Natl Acad Sci U S A. 2001;98(11):6372–7. doi: 10.1073/pnas.091113598. [DOI] [PMC free article] [PubMed] [Google Scholar]
- 45.Takano T, et al. Glutamate release promotes growth of malignant gliomas. Nat Med. 2001;7(9):1010–5. doi: 10.1038/nm0901-1010. [DOI] [PubMed] [Google Scholar]
- 46.Seidlitz EP, et al. Cancer cell lines release glutamate into the extracellular environment. Clin Exp Metastasis. 2009;26(7):781–7. doi: 10.1007/s10585-009-9277-4. [DOI] [PubMed] [Google Scholar]
- 47.Ye ZC, Sontheimer H. Glioma cells release excitotoxic concentrations of glutamate. Cancer Res. 1999;59(17):4383–91. [PubMed] [Google Scholar]
- 48.Brat DJ, Van Meir EG. Vaso-occlusive and prothrombotic mechanisms associated with tumor hypoxia, necrosis, and accelerated growth in glioblastoma. Lab Invest. 2004;84(4):397–405. doi: 10.1038/labinvest.3700070. [DOI] [PubMed] [Google Scholar]
- 49.Dome B, et al. Alternative vascularization mechanisms in cancer: Pathology and therapeutic implications. Am J Pathol. 2007;170(1):1–15. doi: 10.2353/ajpath.2007.060302. [DOI] [PMC free article] [PubMed] [Google Scholar]
- 50.Indelicato M, et al. Role of hypoxia and autophagy in MDA-MB-231 invasiveness. J Cell Physiol. 2010;223(2):359–68. doi: 10.1002/jcp.22041. [DOI] [PubMed] [Google Scholar]
- 51.Hayashida Y, et al. Diffusion-weighted imaging of metastatic brain tumors: comparison with histologic type and tumor cellularity. AJNR Am J Neuroradiol. 2006;27(7):1419–25. [PMC free article] [PubMed] [Google Scholar]
- 52.Sugahara T, et al. Usefulness of diffusion-weighted MRI with echo-planar technique in the evaluation of cellularity in gliomas. J Magn Reson Imaging. 1999;9(1):53–60. doi: 10.1002/(sici)1522-2586(199901)9:1<53::aid-jmri7>3.0.co;2-2. [DOI] [PubMed] [Google Scholar]
- 53.Prasad SR, et al. Radiological measurement of breast cancer metastases to lung and liver: comparison between WHO (bidimensional) and RECIST (unidimensional) guidelines. Journal of computer assisted tomography. 2003;27(3):380–4. doi: 10.1097/00004728-200305000-00014. [DOI] [PubMed] [Google Scholar]
- 54.Shelton LM, et al. A novel pre-clinical in vivo mouse model for malignant brain tumor growth and invasion. J Neurooncol. 2010;99(2):165–76. doi: 10.1007/s11060-010-0115-y. [DOI] [PubMed] [Google Scholar]
- 55.Heyn C, et al. In vivo MRI of cancer cell fate at the single-cell level in a mouse model of breast cancer metastasis to the brain. Magn Reson Med. 2006;56(5):1001–10. doi: 10.1002/mrm.21029. [DOI] [PubMed] [Google Scholar]
- 56.Leenders W, et al. Vascular endothelial growth factor-A determines detectability of experimental melanoma brain metastasis in GD-DTPA-enhanced MRI. Int J Cancer. 2003;105(4):437–43. doi: 10.1002/ijc.11102. [DOI] [PubMed] [Google Scholar]