Abstract
Understanding the forces that stabilize membrane proteins in their native states is one of the contemporary challenges of biophysics. To date, estimates of side chain partitioning free energies from water to the lipid environment show disparate values between experimental and computational measures. Resolving the disparities is particularly important for understanding the energetic contributions of polar and charged side chains to membrane protein function because of the roles these residue types play in many cellular functions. In general, computational free energy estimates of charged side chain partitioning into bilayers are much larger than experimental measurements. However, the lack of a protein-based experimental system that uses bilayers against which to vet these computational predictions has traditionally been a significant drawback. Moon & Fleming recently published a novel hydrophobicity scale that was derived experimentally by using a host-guest strategy to measure the side chain energetic perturbation due to mutation in the context of a native membrane protein inserted into a phospholipid bilayer. These values are still approximately an order of magnitude smaller than computational estimates derived from molecular dynamics calculations from several independent groups. Here we address this discrepancy by showing that the free energy differences between experiment and computation become much smaller if the appropriate comparisons are drawn, which suggests that the two fields may in fact be converging. In addition, we present an initial computational characterization of the Moon & Fleming experimental system used for the hydrophobicity scale: OmpLA in DLPC bilayers. The hydrophobicity scale used OmpLA position 210 as the guest site, and our preliminary results demonstrate that this position is buried in the center of the DLPC membrane, validating its usage in the experimental studies. We further showed that the introduction of charged Arg at position 210 is well tolerated in OmpLA and that the DLPC bilayers accommodate this perturbation by creating a water dimple that allows the Arg side chain to remain hydrated. Lipid head groups visit the dimple and can hydrogen bond with Arg, but these interactions are transient. Overall, our study demonstrates the unique advantages of this molecular system because it can be interrogated by both computational and experimental practitioners, and it sets the stage for free energy calculations in a system for which there is unambiguous experimental data.
Keywords: Membrane proteins, protein stability, thermodynamics, computation, solvation, phospholipid bilayers
1.1 Introduction
The thermodynamics of lipid-protein interactions is a fundamental driving force for processes involving membrane proteins and membrane-active peptides. For those residues of a membrane protein buried within the membrane and facing the lipid acyl chains, it is essential to quantify and understand the microscopic origin of the solvation energies of side chains that interact with lipids. The vast majority of these residues are hydrophobic residues for which solvation in lipid is favorable and solvation in water is highly unfavorable. Enrichment of these residues on lipid-facing membrane protein surfaces is therefore an obvious driving force for membrane protein insertion. However, polar and charged amino acid groups can also be located in membrane proteins in positions that are exposed to the lipid bilayer, and interactions of charged side chains with phospholipids have been shown to be essential for the gating of some ion channels [1–7]. The interactions of these residue types with the lipid acyl chains are undoubtedly unfavorable, but there remain large questions in the field regarding how unfavorable these free energies actually are, as well as how the membrane adjusts to accommodate them.
The case of the Arg side chain is particularly interesting because of the role that this residue plays in voltage sensing [1–7]. Molecular dynamics calculations by several independent groups using different bilayers, different force fields, and distinct molecular systems have converged on values of +13–20 kcal mol−1 as the free energy cost of placing a charged Arg side chain at the bilayer center [8–15]. This number is about an order of magnitude larger than experimental measures of partitioning charged Arg from water to hydrophobic environments. For example, the free energy change for partitioning of an Arg side chain from water into octanol in the Wimley & White (WW) scale ( ) costs a mere +0.66 kcal mol−1 [16, 17]. One explanation for this discrepancy may be that the relaxation properties of water-saturated octanol are quite different from a phospholipid bilayer. Indeed simulations suggest that water-saturated octanol can form structural arrangements, such as inverted micelles, that are inaccessible to a phospholipid bilayer in aqueous solution [18–20]. The simulation results are also inconsistent with translocation-mediated insertion experiments, which predict a relatively small (~2.5 kcal mol−1) penalty for moving an Arg residue from the end of a transmembrane helix, where it is presumably in a polar environment, to the middle of the helix [21]. However, as Schow et al. [14] and Gumbart et al. [22] recently discussed, comparison of simulation and translocon data is complicated by lack of knowledge of the details of peptide partitioning in and out of the translocon.
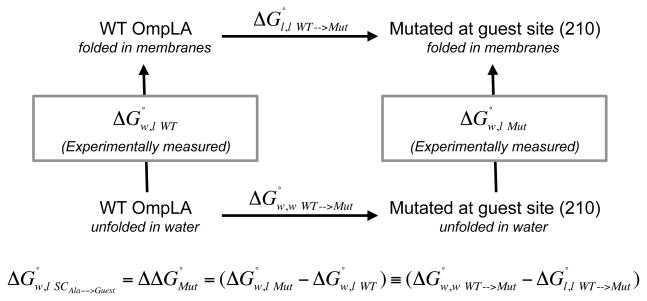
Recently, Moon & Fleming (MF) published a new experimentally derived hydrophobicity scale employing a host-guest strategy based on a native membrane protein folded into a phospholipid bilayer [23, 24]. The host was the E. coli transmembrane protein, outer membrane phospholipase A (OmpLA), and the guest site was position 210 located on the lipid-facing surface of the β-barrel very near the middle of the bilayer. The setup for derivation of their hydrophobicity scale is shown in the thermodynamic cycle in Figure 1. Moon & Fleming measured water to bilayer folding free energy changes, and , of wild type (WT) and mutated OmpLA, respectively. These measurements comprise the vertical directions of this cycle. The difference between these two experimental measurements represents the free energy change due to the mutation at position 210, , which also equals the water to lipid partitioning free energy change of the guest side chain relative to the WT host side chain (Ala), . Therefore, the fundamental measurements in these experiments reveal free energies of transfer relative to alanine. Additionally, since only the side chain (and not the backbone) changes between the host and guest, this difference reflects contributions from only the side chain atoms. Defined this way, Moon & Fleming found that partitioning into lipid of an Arg side chain (relative to Ala) to cost only +3.71 kcal mol−1. The absolute transfer free energy change from water to the bilayer for each side chain, , can be obtained by taking into account the free energy change of alanine side chain insertion, , using the nonpolar solvation parameter derived in the same study [24]. The MF value for Arg side chain partitioning into lipid, then becomes +2.14 kcal mol−1. While this value is over triple that observed for an Arg side chain in the WW water/octanol system ( ), it is still a small number when uncautiously compared to the published molecular dynamics studies. Even with this new scale, there still appears to be a large disparity between experimental and computational estimates of water to lipid side chain partitioning free energy changes.
Figure 1.
Thermodynamic cycle underlying the Moon & Fleming [24] Hydrophobicity Scale. Moon & Fleming measured water to bilayer folding free energy changes, and , of wild-type (WT) and OmpLA side chain variants at position 210, respectively. These measurements comprise the vertical directions of this cycle. The difference between these two experimental measurements represents the free energy change due to the mutation at position 210, , which also equals the water to lipid partitioning free energy change of the guest side chain relative to the WT host side chain (Ala), . The horizontal directions of this cycle represent the free energy changes due to mutation within the folded states in lipid , or within the unfolded states in water, .
Here we address this discrepancy using two strategies. In the first, we reconsider the comparison of experiment and computation using the potential of mean force values published by Dorairaj & Allen [8]. By constructing a comparison that emphasizes the similarities of these two systems, we find that the disagreement between experiment and computation becomes much smaller. Still, the numbers do not completely converge, and we postulate that these residual differences may be a reflection of the very distinct protein scaffolds employed in the two studies, which we could not address with the available data.
We therefore pursued a second approach in which we carried out molecular dynamics calculations that directly correspond to the Moon & Fleming experimental system, OmpLA in DLPC bilayers [24]. Such calculations also allow us to address some molecular level questions related to how this system manifests the thermodynamic transfer free energies. In particular we were interested to know: How well matched is OmpLA to the DLPC bilayers in which the experiments were possible? Since the MF scale was based on substitutions at position 210, are DLPC bilayers thick enough to keep the OmpLA variants at position 210 within the hydrocarbon region of the bilayer? Since it is so long, is the side chain Arg at position 210 buried in the DLPC bilayers, or does it snorkel up to the head group region? Does the protein somehow distort its structure to accommodate burial of a charged Arg in the membrane? Similarly, how much is the bilayer distorted by the protein? Does Arg at OmpLA position 210 remain hydrated? And finally, does the bilayer become thinner and/or do phosphate groups of the lipid head groups partition into the membrane to interact with Arg at position 210 as observed in previous molecular dynamics investigations of other membrane proteins? Our preliminary results demonstrate OmpLA in DLPC bilayers to be computationally accessible and well behaved, and we conclude that this molecular system has unique advantages because both computational and experimental practitioners can interrogate it to address the broad question of side chain energetics in membranes.
2.1 Materials and Methods
2.1.1 Comparison between Dorairaj & Allen data with the Moon & Fleming Scale
To construct the most appropriate comparison, there are two adjustments to the data in the two studies that must be carried out. The first is to obtain an equivalent bilayer depth; the second is to represent equivalent side chain energies for both systems. We thank Professor Toby Allen for providing the data in Fig. 3 of Dorairaj & Allen [8] in which the potential of mean force (PMF) for the guest residue Arg in a poly-Leu host is plotted as a function of distance from the center of a DPPC phospholipid bilayer (Fig S1A).
We accomplished our first task of obtaining an equivalent bilayer depth by replotting the abscissa in the data of Dorairaj & Allen in the form of distance from the phosphate plane using experimental interbilayer phosphate distances [25]. Shown in Supplementary Fig. 1B, each phosphate plane indexes at zero and the maximum value in the DPPC bilayer equals 19 Å at the center of the bilayer. We made a similar plot using the OmpLA 210R trajectory in DLPC (described below). In DLPC, the central bilayer position equaled 15 Å, consistent with the smaller hydrophobic thickness for this bilayer [26, 27]. To find the corresponding position on the Dorairaj & Allen PMF, we removed the central 8 Å section of values of those data that represented more deeply buried positions along the bilayer z-axis. We then overlaid the centrally truncated Dorairaj & Allen data upon the experimental free energy values presented in Fig. 3 of Moon & Fleming [24] to obtain Supplementary Fig. 1C.
The second adjustment required for an appropriate comparison between these two studies arises from differences in the reference free energies. The Dorairaj & Allen PMF reflects the free energy cost of introducing an Arg side chain into the bilayer relative to Leu, , whereas the free energies of transfer measured in the Moon & Fleming (Supplementary Fig. 1C and ref [24] Fig. 3) reflect the cost of Arg side chain relative to Ala, eg. . Since Leu and Ala side chains have markedly different free energies of transfer from water to the bilayer, these differences could exaggerate any disagreements between the two studies. We reconciled this by noting that Moon & Fleming also measured the energetics of Leu partitioning as a function of bilayer thickness [24]. We used those values ( from MF) to calculate the free energy cost of Arg relative to Leu ( ) by taking the difference between the values at each depth. These are the experimental data shown and fitted to a gaussian function in Fig. 2.
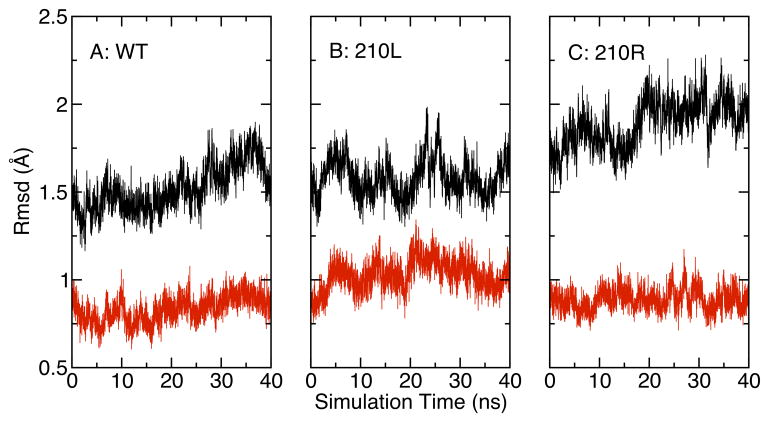
Figure 3.
OmpLA CA RMSD variation as a function of simulation time. The reference protein was the X-ray crystal structure 1QD5. (A) Wild type protein, (B) 210L substituted protein, (C) 210R substituted protein. RMSD values for the entire protein including water-soluble loops are shown in black; RMSD values for transmembrane β-barrel residues alone are shown in red.
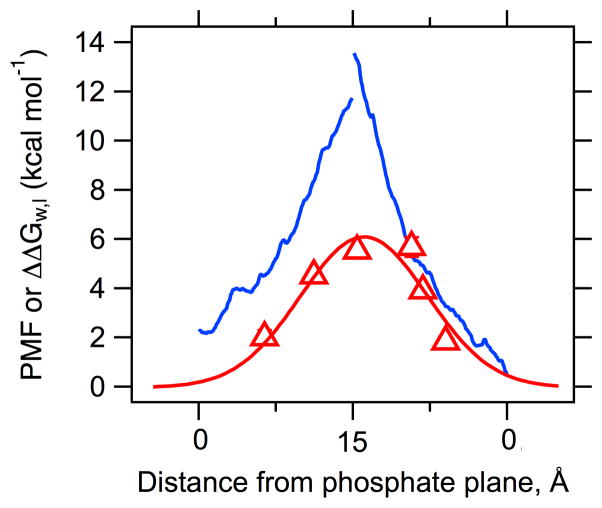
Figure 2.
Experimental and computational values of Arg side chain partitioning into bilayers are converging when an appropriate comparison is constructed. The blue lines are the centrally truncated PMF data of Dorairaj & Allen [8]; the red triangles represent the Leu→Arg free energies of transfer measured by Moon & Fleming [24] with error bars that are not visible because they are smaller than the points; the red line is a Gaussian fit through this data. See the Methods and Supplementary Fig 1 for details.
The overlay of the centrally truncated Dorairaj & Allen data and the Leu referenced MF data for Arg are shown in Fig. 2. The bilayer depth coordinates in the Dorairaj & Allen data are center of mass for the poly-Leu helix (Toby Allen, personal communication), which corresponds to the CA position for each residue in OmpLA. The mean CA positions in OmpLA were determined by molecular dynamics as described below.
2.1.2 Molecular dynamics simulations of OmpLA in DLPC
Molecular dynamics simulations were conducted at 310 K at a constant pressure of 1 atm using the NAMD 2.7 software [28]. The CHARMM 22 [29] and CHARMM 36 force fields [30] were used for protein and lipid atoms, respectively, with the TIP3P model for water [31]. The smooth particle mesh Ewald method [32] was used to calculate electrostatic interactions, and the short-range, real-space interactions were truncated at 12 Å by using a switching function. A multiple-time step algorithm [33, 34] was used to integrate the equations of motion. All bond lengths involving hydrogen atoms were held fixed using the SHAKE algorithm [35]. A Langevin dynamics scheme was used for thermostatting, and Nose–Hoover–Langevin pistons were used for pressure control [36, 37]. Molecular graphics and simulation analyses were performed using the VMD 1.8.7 software package and the Python MD Analysis libraries [38] [39].
The bilayer membrane was manually constructed with 128 2,3 dilauroyl-D-glycero-1-phosphatidylcholine (DLPC) molecules. Water was added to fill the simulation cell and water molecules in the hydrocarbon region were removed. The final water to phospholipid ratio was 90:1. The system was gradually heated to 310 K, equilibrated for 2 ns with a 1 fs time step followed by equilibration for 35 ns with a 2 fs time step. An additional 20 ns simulation at 310 K was collected for analysis. After equilibration the approximate simulation cell size was 65 × 65 × 112 Å.
The starting protein structure was derived from the X-ray crystal model 1QD5 [40]. Residue 210A was mutated to Arg using VMD and the protein was inserted into the DLPC bilayer. Overlapping lipid and water molecules were removed and the system was neutralized with 0.2 M KCl. The final lipid to protein ratio was 106:1. This system was gradually heated to 310 K and equilibrated as described below. To ensure that all three protein-membrane systems investigated here had the same protein/lipid ratios, the OmpLA 210L substituted protein-membrane system was constructed by mutating 210R to Leu in the context of the 210R/DLPC equilibrated system and changing one water molecule to a potassium ion to neutralize the system. The wild type (WT) protein-membrane system was constructed by mutating the OmpLA 210L/DLPC system back to the wild type Ala residue at position 210. All three protein-membrane systems were gradually heated to 310 K with protein backbone atoms constrained after mutation of the 210 site. The constraints were then removed, and the systems were each equilibrated for 2 ns using a 1 fs time step and for 5 – 15 ns with a 2 fs time step. Additional 40 ns trajectories of each system were collected for analysis using 12-processor Macintosh Pro computers or computing resources available through TeraGrid at the Texas Advanced Computing Center.
The 210R configuration was built several times with different initial rotamers, including one that pointed “down”. The final rotamer obtained in all simulations and shown here has the guanidinium group oriented “up” (as in Fig. 7). We attribute this preferred orientation to side chain steric constraints present in the OmpLA scaffold.
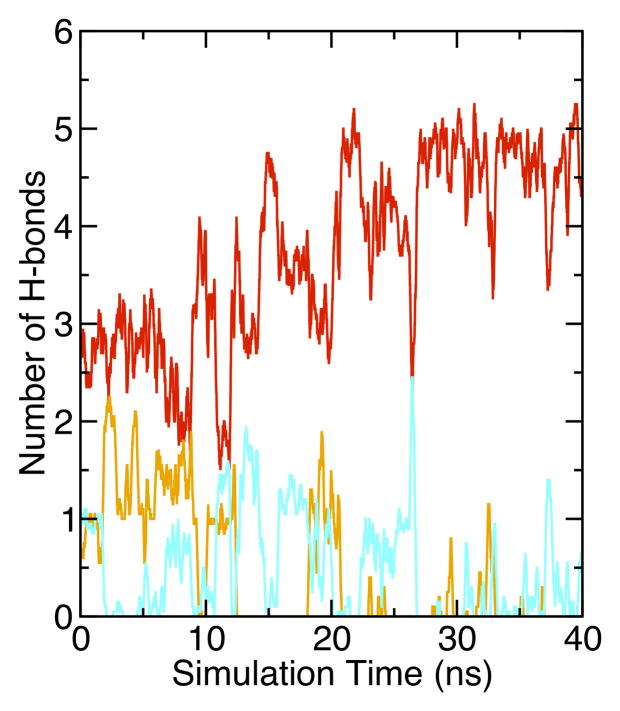
Figure 7.
The 210R side chain is predominantly hydrogen bonded to water with occasional hydrogen bonds to lipid head group phosphate or carbonyl oxygen. Time dependences of hydrogen bonds formed between NH1, NH2, or NE atoms of the 210R side chain to water, phosphate or carbonyl oxygens are shown in red, orange and cyan, respectively.
3.1 Results and Discussion
3.1.1 Experimental and calculated free energies of transfer for charged Arg in a membrane are converging
It is important that the appropriate comparisons be drawn in order to reconcile experiment and computational values of Arg side chain partitioning. In all published molecular dynamics studies, the PMF gradients for charged Arg side chains and analogues have shown a steep dependence on depth in the bilayer peaking at the center with the most unfavorable free energy [8–15, 22, 41]. Similarly, we expect that the extent of Arg burial will depend on the bilayer thickness when the Arg side chain is placed at the center of a given bilayer. Since the molecular dynamics studies to date employ DMPC [9–11, 41], DPPC [8], POPC [10, 14] or DOPC [10, 13] lipid bilayers, it is not surprising that these PMF values did not correspond closely to the experimental free energies of transfer measured in the OmpLA/DLPC system.
To compare the free energy of Arg transfer in the MF scale to the PMF values of Dorairaj & Allen, we used a portion of the data from Dorairaj & Allen to construct an “equivalent bilayer depth” (see Methods and Supplementary Fig 1 for details). We then changed the reference point for the experimental MF values from Ala to Leu so that both studies would represent partitioning energies for side chains of Arg relative to Leu, e.g. , since these are the relevant values in the Dorairaj & Allen study. Fig. 2 shows the center-truncated PMF values for reported by Dorairaj & Allen and the depth-dependent experimental measured by MF [24]. Note that both data sets were adjusted from their original forms so that they would have a common reference side chain over the membrane thickness of a DLPC bilayer (See Methods and Supplementary Fig. 1 for details). A Gaussian fit to the MF experimental data as a function of CA bilayer depth returns a value of 6.2 kcal mol−1 as the maximum energetic cost for partitioning an Arg side chain relative to Leu, , at position z = 0 in the center of the bilayer. This free energy value is about half of the two maxima in the (center truncated) asymmetric Dorairaj & Allen profile (11.7 and 13.5 kcal mol−1). This comparison is much more favorable than the casual (and incorrect) one between the simply reported values of water-to-bilayer transfer free energies reported by Dorairaj & Allen (+17 kcal mol−1) and MF (+2.1 kcal mol−1) [24]. Still they do not exactly converge, and we speculate that this may reflect differences between the two molecular systems used: a poly-Leu helix with a single Arg guest residue has a different architecture than a 31.6 kDa transmembrane β-barrel.
3.1.2 OmpLA/DLPC is a well-behaved and computationally tractable molecular system
To more directly address the question of side chain partitioning energetics, we constructed a molecular dynamics system of OmpLA in DLPC membranes. DLPC lipids have smaller hydrophobic thicknesses than most biological lipids and have not been extensively studied using molecular dynamics. However they are gaining prominence in folding studies [42, 43]. Saturated C12 and even C10 lipid chains are naturally occurring chain lengths in gram negative bacteria [44] [45], and even though the OmpLA protein used as the scaffold of the MF thermodynamic studies [24] comes from E. coli, whose lipid chain lengths tend towards C14 and C16 in the outer membranes, Burgess et al. demonstrated that OmpLA and eight other outer membrane proteins from E. coli showed the fastest folding kinetics and highest folding efficiencies when short chain lipids were used in folding assays in vitro [42]. In addition, DLPC was the only lipid environment that supported reversible, path-independent folding studies of OmpLA despite an exhaustive search that included many different lipid types and superstructures (CP Moon & KG Fleming, manuscript in preparation). Moreover, DLPC bilayers supported reversible folding of the E. coli PagP outer membrane protein in one study [46]. Understanding how outer membrane proteins are accommodated in these membranes is thus of general interest for the folding community.
We were therefore motivated by all these reasons to use molecular dynamics to simulate DLPC lipid bilayers in order to gain insight into the molecular details of these outer membrane proteins when folded in DLPC membranes. We performed 40 ns of all-atom molecular dynamics trajectories of OmpLA and two variants, Ala210Leu (210L) and Ala210Arg (210R) in all atom DLPC bilayers. The simulations were completely unconstrained and carried out at 37°C to match the experimental temperature.
We evaluated structural metrics related to the protein by monitoring the root mean square deviations (RMSD) of CA atoms as compared to the crystal structure (1QD5) [40]. Overall, all three OmpLA sequences we studied are stable in the DLPC membrane in the time scale of the simulations. However, they do display individual differences in their structural fluctuations as indicated in Figure 3. The wild type OmpLA has the smallest backbone structural deviations with the β-barrel residues showing only approximately 0.8 Å RMSD and an overall RMSD of ~1.5 Å. These results are similar to previous results obtained during the simulation of wild type OmpLA in POPC bilayer membranes using the GROMOS force field [47]. The 210L variant has larger deviations in the barrel region (~1 Å) and this is reflected in the all residue values as well. The 210R variant exhibits a β-barrel region with small RMSD deviations but much larger excursions of extra-membranous loop regions (~2 Å).
3.1.3 OmpLA’s aromatic belt of tryptophan residues is well matched by DLPC bilayers
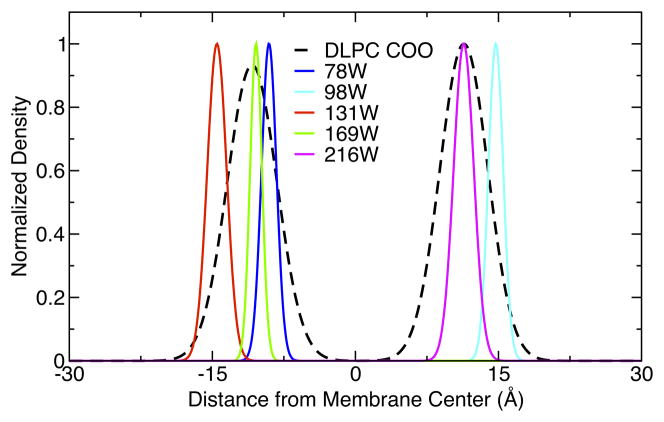
We sought to determine how well matched the hydrophobic region of OmpLA was to the DLPC bilayers. Since it is widely accepted that tryptophan girdles anchor membrane proteins in a lipid bilayer [48–51], we used OmpLA’s interfacial tryptophan distribution of lipid-facing Trp residues as a guide to determine where the interfacial region of the bilayer should ideally interact with the protein. Fig. 4 shows the average CA positions of residues 78, 98, 131, 169 and 216 plotted as a function of distance from the bilayer center. These are overlaid upon the carbonyl oxygen distributions of the DLPC bilayer. The distributions are consistent with these lipid-facing Trp residues at the interfacial bilayer region and indicate that there does not appear to be significant hydrophobic mismatch of OmpLA in DLPC. The peak to peak distance between the lipid carbonyl oxygens is 23 Å which is exactly the hydrophobic thickness of a dataset of 24 bacterial outer membrane proteins reported by by Lomize et al. [52]. Moreover, as shown below in Fig. 5, the mean bilayer thickness is not affected by the presence of any of the protein variants studied here, further supporting the conclusion that OmpLA is well matched to hydrophobic thickness of the DLPC bilayer [53]. One aspect to note is that the overall match occurs despite the disruption of some lipid molecules that directly interact with the protein as discussed below (Figures 6D, 7 and 8C).
Figure 4.
Transmembrane distributions show that the lipid-facing tryptophan residues of OmpLA are located at the interfacial region of the membrane. The average CA positions of tryptophan residues 78, 98, 131, 169 and 216 are plotted as a function of distance from the bilayer center. These are overlaid upon the carbonyl oxygen distributions of the DLPC bilayer. OmpLA has four additional Trp residues not included in this plot that face the barrel interior or are located in water-soluble loops.
Figure 5.
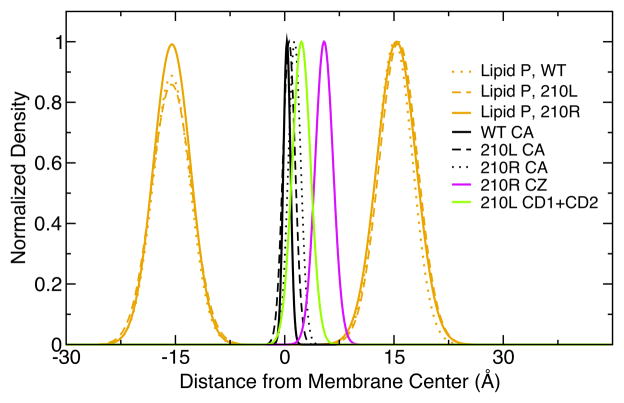
Transmembrane distributions of atomic species as a function of distance from the DLPC membrane center show that position 210 in OmpLA is buried in the center of the membrane. The time averaged densities of each atom type in one Å slices along the membrane normal (z direction) were calculated from 40 ns trajectories and normalized to the maximum density slice. The data from three OmpLA simulations (WT, 210L, 210R) in DLPC membranes are included.
Figure 6.
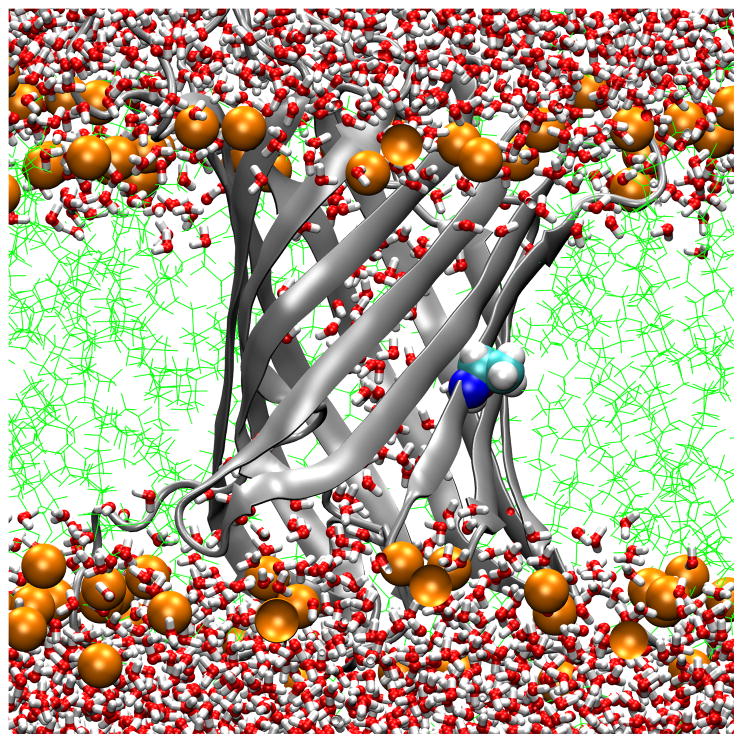
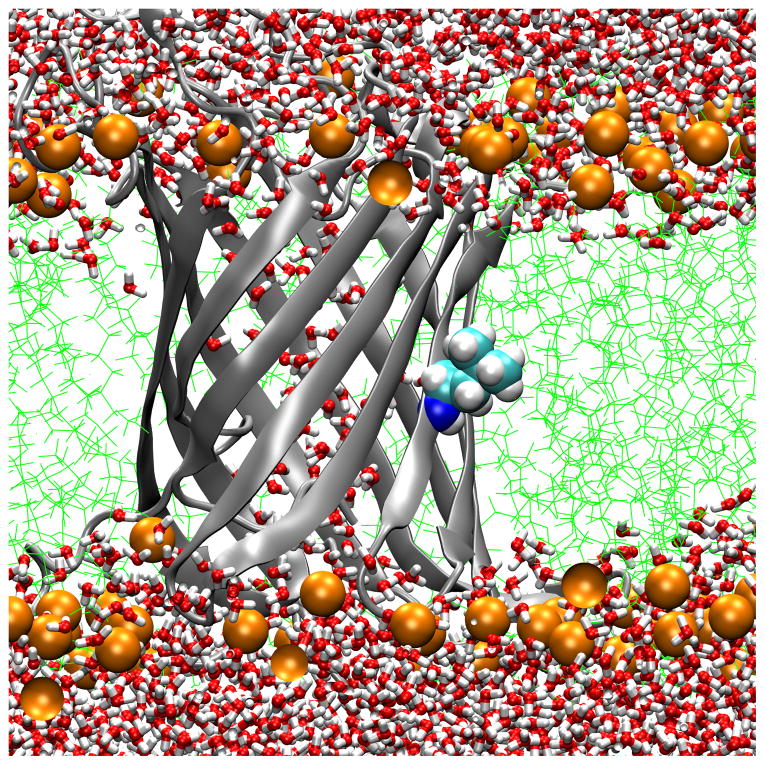
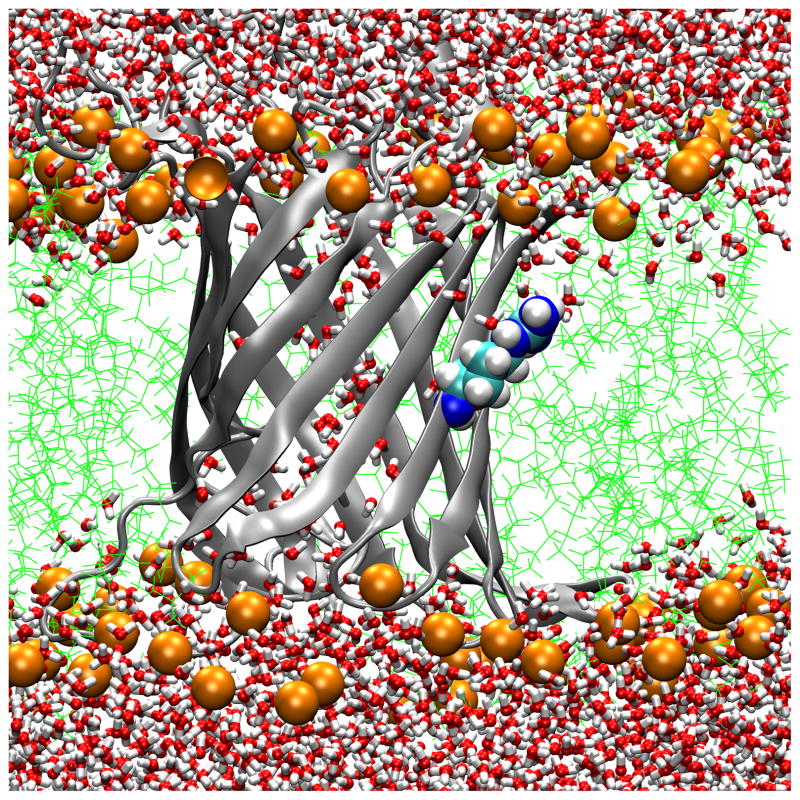
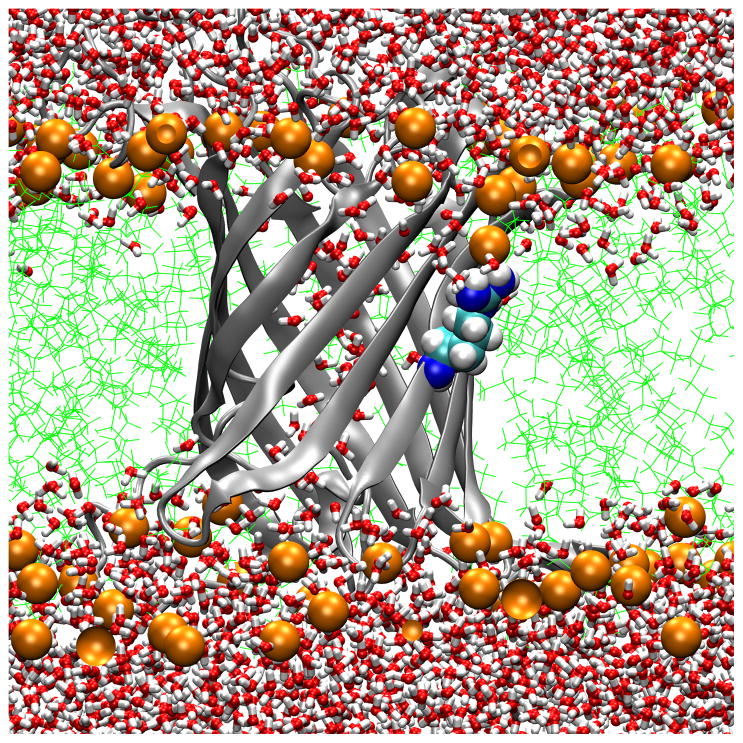
Transmembrane water distributions of OmpLA/DLPC membrane systems show that the environment is dehydrated for 210A and 210L and that a water dimple forms for 210R. (A) WT; (B) 210L; (C) a snapshot of 210R protein showing only water in the water dimple; (D) a snapshot of 210R showing water and a phosphate atom in the water dimple. These are snapshots of typical trajectory configurations with OmpLA as a ribbon diagram and residue 210 as spheres. Phosphate atoms are shown as orange spheres, lipid hydrocarbon as green lines and water as red/white bonds.
Figure 8.
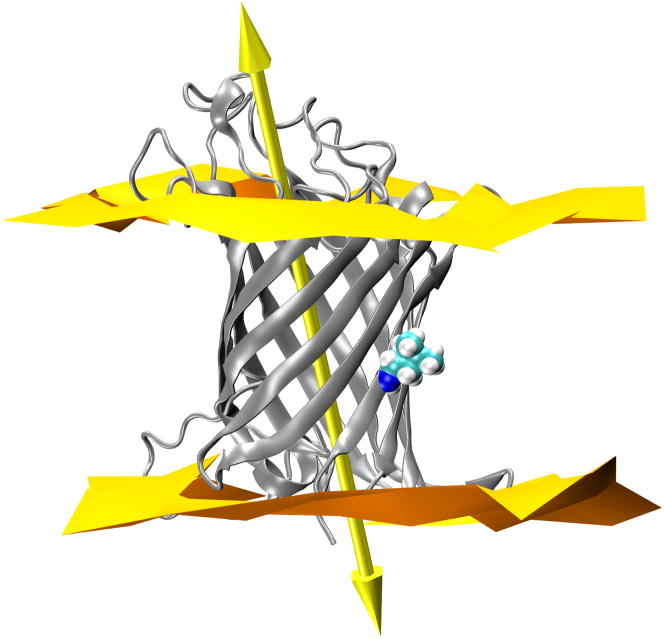
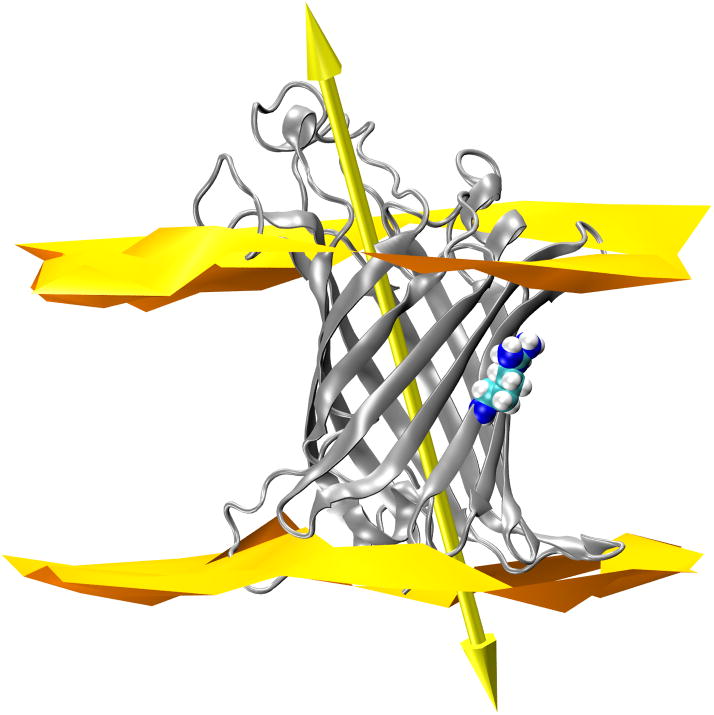
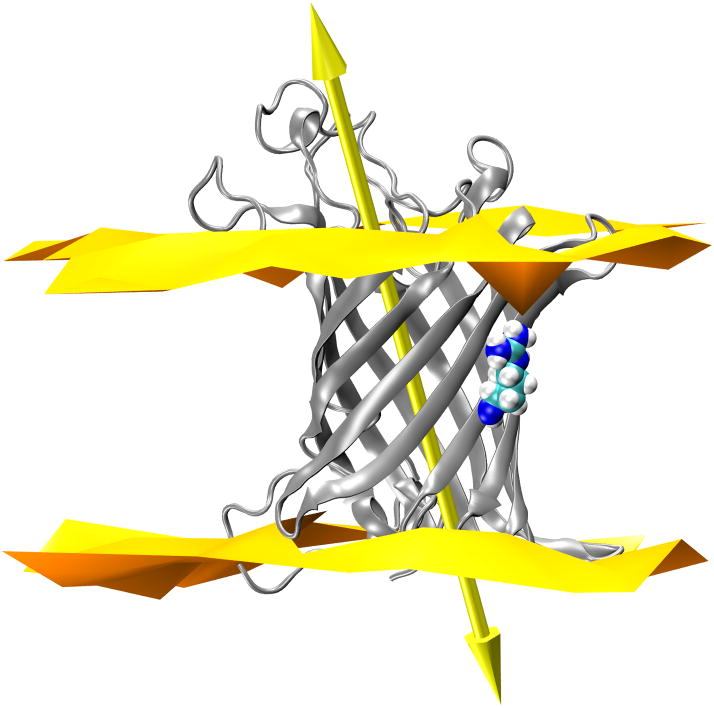
OmpLA principal axis does not tilt upon substitution to Arg at 210. (A) 210L substituted OmpLA; (B) a snapshot of 210R OmpLA with the water dimple; (C) a snapshot of 210R OmpLA with the water dimple and a visit by a phosphate. In each panel OmpLA is shown as a ribbons diagram with residue 210 as spheres and the principal axis as a double-headed arrow. The lipid bilayer head group regions are represented by two-dimensional Delaunay triangulations of the lipid phosphate positions. WT OmpLA tilts are the same and are not shown.
3.1.4 Position 210 is within the hydrocarbon region of the membrane – even when it is mutated to Arg
The Moon & Fleming hydrophobicity scale was derived using a host-guest strategy to measure the free energies of transfer of amino acid side chains from water to the interior of the bilayer. The guest site was position 210 on OmpLA, which was chosen because the crystal structure suggested that this CA is in the center of the hydrophobic region of the protein opposite the enzyme active site. This was important because enzyme activity was one of the criteria used to demonstrate native folding [40, 54–56]. The wild type residue is Ala, which is surely buried in the membrane. However, most amino acids are larger and longer than Ala, which raises the question: How buried are other amino acids at that site? We addressed this question by evaluating the atomic distributions for key atoms in the system.
First, Fig. 5 shows that the transmembrane CA positions are nearly identical for all three variants. The CA for the WT and 210L proteins are located 0.4 Å from the center of the DLPC bilayer as defined as the mid-point between the two lipid phosphate positions, and the CA for the 210R variant is offset by 1 Å away from this value in a direction that moves the Arg side chain slightly closer to the nearest phosphate plane. This mean deviation is quite small and this means that neither variant causes the protein to significantly slide up or down along the bilayer normal. Second, a comparison of the bilayer phosphate distributions in Fig. 5 shows that the presence of neither the protein itself nor the charged Arg variant in the bilayer has a significant effect on the mean thickness of the DLPC membrane. The peak to peak lipid phosphate distance is 31 Å and this distance agrees with the experimental value for DLPC bilayers determined by X-ray scattering [26]. Third, the distribution of hydrophobic leucine side chain in the 210L OmpLA variant, as defined by leucine atoms CD1 and CD2, is well within the hydrophobic region of the bilayer. Finally, despite the slight shifting of the 210R CA atom, the guanidinium group of the arginine in 210R, defined by the CZ atom, is also well below the mean position of lipid phosphate planes. Overall these atomic positions validate the experimental system in its ability to query the free energy of partitioning from water to the hydrocarbon region of the lipid bilayer.
A second method to validate the idea that DLPC membranes provide a hydrophobic region thick enough to ensure that substitutions at position 210 of OmpLA remain in a hydrophobic environment is to examine the water distributions. Fig. 6 Panels A and B show the water and lipid phosphate distributions in snapshots of trajectories for the WT and 210L protein systems. In both cases the side chains of residue 210 are well within the hydrophobic region and dehydrated. While we have not yet simulated other aliphatic side chains, we expect similar results for the remaining hydrophobic residues. In contrast, OmpLA 210R induces the creation of a water dimple that enables the side chain to remain hydrated. This will be discussed in more detail below.
3.1.5 Arg at position 210 in OmpLA is accommodated by the formation of a water dimple in the membrane
We next investigated how the system responds to the introduction of the charged Arg residue at position 210. Previous molecular dynamics studies showed that both the protein and the lipid membrane could alter their structures in response to a charged mutation. Johansson & Lindahl showed that a poly-Leu helix distorts in response to the introduction of an aspartic acid residue in a DMPC bilayer [41], and all studies demonstrated that Arg side chains remain hydrated and accomplish this by dragging water down into the bilayer. This phenomenon appears to be independent of the molecular scaffold for the guanidinium group because water penetration has been observed in membrane simulations of poly-leucine helix host peptides with Arg residues [8, 14, 22], charged guanidinium ions [14], as well as a larger side chain analogue of Arg [13]. We refer to this penetration as a water dimple to differentiate it from other internal or transient bilayer defects. Lipid head groups can accompany the water dimple down into the bilayer and interact directly with the guanidinium group. In the S4 helix, which contains multiple Arg residues, the bilayer can thin sufficiently in the vicinity of the guanidinium groups to allow all of the charges to remain hydrated [57].
While position 210 provides a hydrophobic environment for those residues whose solvation energetics favor dehydration, we found markedly different behavior in the case of OmpLA 210R. In contrast to Fig. 6 Panels A and B, Fig 6 Panels C and D show that 210R induces the formation of a water dimple in the bilayer so that the 210R side chain can remain hydrated. This occurs within the initial equilibration time, and the early formation of the dimple in 210R systems was reproduced three times (data not shown). Although both water (Fig. 6 Panel C) and lipid head group oxygens (Fig. 6 Panel D) can serve as hydrogen bond acceptors, water is the predominant hydrogen bond acceptor over the course of these trajectories, as observed in Fig. 7. A lipid head group intermittently samples the water dimple and can form direct hydrogen bonds with the guanidinium group, but these are transient interactions (Fig. 7). We observed three different lipids to participate in such interactions during a 40 ns simulation of 210R.
In all three OmpLA variants, we also observed that the central cavity of OmpLA contains water molecules (Fig. 6). This is not an artifact of these bilayers as it was previously noted in a simulation carried out in POPC [47]. Although it may appear from these images that OmpLA has a transmembrane channel, this is not the case because there is a “cap” in the loop region on top of the protein as shown in Fig. 6. Moreover, this internal water should not affect any conclusions with respect to the usage of 210 for thermodynamic studies because this host residue is facing lipid, not the central cavity of OmpLA.
3.1.6 OmpLA does not distort or tilt to allow 210R to snorkel up to the surface
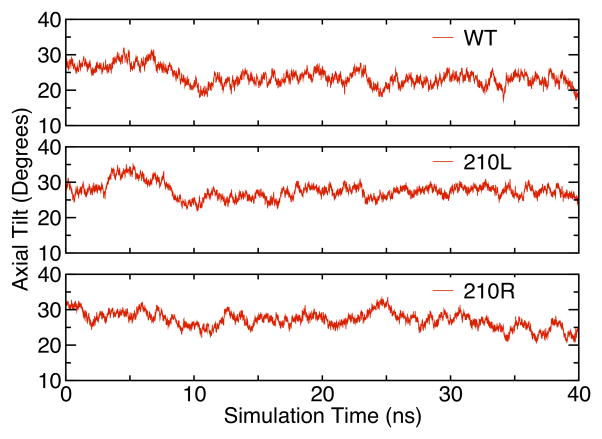
Our simulations show that the position 210 CA carbons in all three variants have nearly identical depths over this simulation time (Fig. 5). The systems are thus anchored along the bilayer in a similar way whether or not Arg is present. However, it could be imagined that the introduction of a charged Arg side chain on its lipid-facing surface might cause the barrel to tilt in order for the charged side chain to snorkel up to water. The CA depths would be insensitive to this if the pivot point was near this residue. To address this tilting possibility, we determined the tilt angle of the OmpLA β-barrel by calculating the angle between the principal axis of the protein and the normal to the membrane plane as shown by the large arrow in Fig. 8. The time evolution of the tilt angle is shown in Fig. 9 for all three variants where it can be observed that these angles vary between 20° and 30° in all protein systems. The angle of OmpLA in the membrane appears to be stable for both the wild type and the 210L variant. The tilt angle of the 210R variant shows a slight trend to a smaller angle after ~25 ns however we do not think this is related to the Arg side chain snorkeling up to the phosphate plane because this occurrence is coincident with the increased fluctuation of the loop regions as indicated by the RMSD plot in Fig. 3. In fact, the β-barrel region of the 210R variant protein does not appear to significantly change position in the bilayer as shown in Fig. 5. Moreover, a decreased tilt angle for the 210R β-barrel would have the ironic consequence of increased burial of the Arg side chain in the membrane.
Figure 9.
The protein principal axis tilt angles (as depicted in Figure 8) as a function of simulation time. The principal axes of each protein were calculated from trajectories of the respective OmpLA species in DLPC membranes.
4.1 Conclusions
In conclusion, we have shown that OmpLA in DLPC bilayers is a computationally tractable molecular system for addressing the broad question of side chain partitioning into phospholipid bilayers. OmpLA is well matched to the hydrophobic thickness of the DLPC bilayer and its disposition in the membrane is stable over tens of nanoseconds of simulation. One of the most important questions we are able to address by the simulation of OmpLA variants in membranes is how the system accommodates a charged group such as arginine in the hydrophobic region of the membrane. As in most previous simulations of the membrane partitioning of Arg analogs and Arg-containing peptides, a water dimple forms in the OmpLA 210R DLPC simulation to maintain hydration of the guanidinium group. Lipid head groups sample this defect and can directly interact with the guanidinium group but do not form persistent interactions. The observation of such a readily formed water dimple suggests that mutations with multiple Arg residues might be able to share this bilayer defect and that the free energy of partitioning multiple, closely spaced Arg residues should be nonadditive. Indeed this has been observed in the OmpLA system [24] and predicted by molecular dynamics simulations of multiple arginine side chains in DOPC lipids [58].
Previous simulations of Arg partitioning into membranes have employed molecular systems for which there are no direct experimental measurements of insertion energetics. OmpLA is unique in that it is readily amenable to both experimental and computational investigations, and the combined application of experimental and computational tools to this system should have wide applicability to both fields. The atomic simulations provide a level of detail that is not accessible to experiment and – in OmpLA - they can be validated against experimental macroscopic measurements.
Supplementary Material
Supplementary Figure 1
Panel A shows the data from Dorairaj & Allen that is replotted here for comparison; Panel B shows the data with the abscissa changed to distance from the phosphate plan; Panel C (blue) shows the Dorairaj & Allen data with the central 8 Å removed; overlaid in red are the data from Moon & Fleming, Figure 3.
Acknowledgments
This work was supported in part by the National Science Foundation through TeraGrid resources provided by the Texas Advanced Computing Center at the University of Texas at Austin and by grants from the National Science Foundation (MCB0919868 to KGF and CHE-0750175 to DJT) and the National Institutes of Health (R01 GM079440 to KGF, T32 GM008403 to the JHU Program in Molecular Biophysics, and 1P01 GM86685 to DJT).
Abbreviations
Footnotes
Database linking and Accession numbers
PDB ID: 1QD5
Publisher's Disclaimer: This is a PDF file of an unedited manuscript that has been accepted for publication. As a service to our customers we are providing this early version of the manuscript. The manuscript will undergo copyediting, typesetting, and review of the resulting proof before it is published in its final citable form. Please note that during the production process errors may be discovered which could affect the content, and all legal disclaimers that apply to the journal pertain.
Literature Cited
- 1.Jiang Y, Lee A, Chen J, Cadene M, Chait BT, MacKinnon R. The open pore conformation of potassium channels. Nature. 2002;417:523–526. doi: 10.1038/417523a. [DOI] [PubMed] [Google Scholar]
- 2.Lee SY, Lee A, Chen J, MacKinnon R. Structure of the KvAP voltage-dependent K+ channel and its dependence on the lipid membrane. P Natl Acad Sci USA. 2005;102:15441–15446. doi: 10.1073/pnas.0507651102. [DOI] [PMC free article] [PubMed] [Google Scholar]
- 3.Ramu Y, Xu Y, Lu Z. Enzymatic activation of voltage-gated potassium channels. Nature. 2006;442:696–699. doi: 10.1038/nature04880. [DOI] [PubMed] [Google Scholar]
- 4.Schmidt D, Jiang QX, MacKinnon R. Phospholipids and the origin of cationic gating charges in voltage sensors. Nature. 2006;444:775–779. doi: 10.1038/nature05416. [DOI] [PubMed] [Google Scholar]
- 5.Tombola F, Pathak MM, Isacoff EY. How does voltage open an ion channel? Annu Rev Cell Dev Biol. 2006;22:23–52. doi: 10.1146/annurev.cellbio.21.020404.145837. [DOI] [PubMed] [Google Scholar]
- 6.Zhang L, Sato Y, Hessa T, von Heijne G, Lee JK, Kodama I, Sakaguchi M, Uozumi N. Contribution of hydrophobic and electrostatic interactions to the membrane integration of the Shaker K+ channel voltage sensor domain. P Natl Acad Sci USA. 2007;104:8263–8268. doi: 10.1073/pnas.0611007104. [DOI] [PMC free article] [PubMed] [Google Scholar]
- 7.Xu Y, Ramu Y, Lu Z. Removal of phospho-head groups of membrane lipids immobilizes voltage sensors of K+ channels. Nature. 2008;451:826–829. doi: 10.1038/nature06618. [DOI] [PMC free article] [PubMed] [Google Scholar]
- 8.Dorairaj S, Allen TW. On the thermodynamic stability of a charged arginine side chain in a transmembrane helix. Proc Natl Acad Sci U S A. 2007;104:4943–4948. doi: 10.1073/pnas.0610470104. [DOI] [PMC free article] [PubMed] [Google Scholar]
- 9.Johansson AC, Lindahl E. Position-resolved free energy of solvation for amino acids in lipid membranes from molecular dynamics simulations. Proteins. 2008;70:1332–1344. doi: 10.1002/prot.21629. [DOI] [PubMed] [Google Scholar]
- 10.Johansson AC, Lindahl E. The role of lipid composition for insertion and stabilization of amino acids in membranes. The Journal of chemical physics. 2009;130:185101. doi: 10.1063/1.3129863. [DOI] [PubMed] [Google Scholar]
- 11.Johansson AC, Lindahl E. Titratable amino acid solvation in lipid membranes as a function of protonation state. The journal of physical chemistry B. 2009;113:245–253. doi: 10.1021/jp8048873. [DOI] [PubMed] [Google Scholar]
- 12.Li L, Vorobyov I, Allen TW. Potential of mean force and pKa profile calculation for a lipid membrane-exposed arginine side chain. The journal of physical chemistry B. 2008;112:9574–9587. doi: 10.1021/jp7114912. [DOI] [PubMed] [Google Scholar]
- 13.MacCallum JL, Bennett WF, Tieleman DP. Distribution of amino acids in a lipid bilayer from computer simulations. Biophys J. 2008;94:3393–3404. doi: 10.1529/biophysj.107.112805. [DOI] [PMC free article] [PubMed] [Google Scholar]
- 14.Schow EV, Freites JA, Cheng P, Bernsel A, von Heijne G, White SH, Tobias DJ. Arginine in Membranes: The Connection Between Molecular Dynamics Simulations and Translocon-Mediated Insertion Experiments. J Membrane Biol. 2011;239:35–48. doi: 10.1007/s00232-010-9330-x. [DOI] [PMC free article] [PubMed] [Google Scholar]
- 15.Vorobyov I, Li L, Allen TW. Assessing atomistic and coarse-grained force fields for protein-lipid interactions: the formidable challenge of an ionizable side chain in a membrane. The journal of physical chemistry B. 2008;112:9588–9602. doi: 10.1021/jp711492h. [DOI] [PubMed] [Google Scholar]
- 16.White SH, Wimley WC. Hydrophobic interactions of peptides with membrane interfaces. Biochimica et biophysica acta. 1998;1376:339–352. doi: 10.1016/s0304-4157(98)00021-5. [DOI] [PubMed] [Google Scholar]
- 17.Wimley WC, Creamer TP, White SH. Solvation energies of amino acid side chains and backbone in a family of host-guest pentapeptides. Biochemistry. 1996;35:5109–5124. doi: 10.1021/bi9600153. [DOI] [PubMed] [Google Scholar]
- 18.Best SA, Merz KM, Reynolds CH. Free Energy Perturbation Study of Octanol/Water Partition Coefficients: Comparison with Continuum GB/SA Calculations. J Phys Chem B. 1999;103:714–726. [Google Scholar]
- 19.DeBolt SE, Kollman PA. Investigation of Structure, Dynamics, and Solvation in 1-Octanol and Its Water-Saturated Solution: Molecular Dynamics and Free-Energy Perturbation Studies. J Am Chem Soc. 1995;117:5316–5340. [Google Scholar]
- 20.MacCallum JL, Tieleman DP. Structures of neat and hydrated 1-octanol from computer simulations. Journal of the American Chemical Society. 2002;124:15085–15093. doi: 10.1021/ja027422o. [DOI] [PubMed] [Google Scholar]
- 21.Hessa T, White SH, von Heijne G. Membrane insertion of a potassium-channel voltage sensor. Science. 2005;307:1427. doi: 10.1126/science.1109176. [DOI] [PubMed] [Google Scholar]
- 22.Gumbart J, Chipot C, Schulten K. Free-energy cost for translocon-assisted insertion of membrane proteins. P Natl Acad Sci USA. 2011;108:3596–3601. doi: 10.1073/pnas.1012758108. [DOI] [PMC free article] [PubMed] [Google Scholar]
- 23.Moon CP, Fleming KG. Using tryptophan fluorescence to measure the stability of membrane proteins folded in liposomes. Methods Enzymol. 2011;492:189–211. doi: 10.1016/B978-0-12-381268-1.00018-5. [DOI] [PMC free article] [PubMed] [Google Scholar]
- 24.Moon CP, Fleming KG. Side-chain hydrophobicity scale derived from transmembrane protein folding into lipid bilayers. P Natl Acad Sci USA. 2011 doi: 10.1073/pnas.1103979108. [DOI] [PMC free article] [PubMed] [Google Scholar]
- 25.Kucerka N, Nagle JF, Sachs JN, Feller SE, Pencer J, Jackson A, Katsaras J. Lipid bilayer structure determined by the simultaneous analysis of neutron and X-ray scattering data. Biophysical journal. 2008;95:2356–2367. doi: 10.1529/biophysj.108.132662. [DOI] [PMC free article] [PubMed] [Google Scholar]
- 26.Kucerka N, Liu YF, Chu NJ, Petrache HI, Tristram-Nagle S, Nagle JF. Structure of fully hydrated fluid phase DMPC and DLPC lipid bilayers using X-ray scattering from oriented multilamellar arrays and from large unilamellar vesicles. Biophysical Journal. 2005;88:245A–245A. doi: 10.1529/biophysj.104.056606. [DOI] [PMC free article] [PubMed] [Google Scholar]
- 27.Lewis BA, Engelman DM. Lipid bilayer thickness varies linearly with acyl chain length in fluid phosphatidylcholine vesicles. J Mol Biol. 1983;166:211–217. doi: 10.1016/s0022-2836(83)80007-2. [DOI] [PubMed] [Google Scholar]
- 28.Phillips JC, Braun R, Wang W, Gumbart J, Tajkhorshid E, Villa E, Chipot C, Skeel RD, Kale L, Schulten K. Scalable molecular dynamics with NAMD. J Comput Chem. 2005;26:1781–1802. doi: 10.1002/jcc.20289. [DOI] [PMC free article] [PubMed] [Google Scholar]
- 29.MacKerell AD, Bashford D, Bellott M, Dunbrack RL, Evanseck JD, Field MJ, Fischer S, Gao J, Guo H, Ha S, Joseph-McCarthy D, Kuchnir L, Kuczera K, Lau FTK, Mattos C, Michnick S, Ngo T, Nguyen DT, Prodhom B, Reiher WE, Roux B, Schlenkrich M, Smith JC, Stote R, Straub J, Watanabe M, Wiorkiewicz-Kuczera J, Yin D, Karplus M. All-atom empirical potential for molecular modeling and dynamics studies of proteins. J Phys Chem B. 1998;102:3586–3616. doi: 10.1021/jp973084f. [DOI] [PubMed] [Google Scholar]
- 30.Klauda JB, Venable RM, Freites JA, O’Connor JW, Tobias DJ, Mondragon-Ramirez C, Vorobyov I, MacKerell AD, Jr, Pastor RW. Update of the CHARMM all-atom additive force field for lipids: validation on six lipid types. The journal of physical chemistry B. 2010;114:7830–7843. doi: 10.1021/jp101759q. [DOI] [PMC free article] [PubMed] [Google Scholar]
- 31.Jorgensen WL, Chandrasekhar J, Madura JD, Impey RW, Klein ML. Comparison of simple potential functions for simulating liquid water. J Chem Phys. 1983;79:926–935. [Google Scholar]
- 32.Darden T, York D, Pedersen L. Particle Mesh Ewald - an N.Log(N) Method for Ewald Sums in Large Systems. J Chem Phys. 1993;98:10089–10092. [Google Scholar]
- 33.Grubmuller H, Heller H, Windemuth A, Schulten K. Generalized Verlet Algorithm for Efficient Molecular Dynamics Simulations with Long-range Interactions. Molecular Simulation. 1991;6:121–142. [Google Scholar]
- 34.Tuckerman M, Berne BJ, Martyna GJ. Reversible Multiple Time Scale Molecular-Dynamics. J Chem Phys. 1992;97:1990–2001. [Google Scholar]
- 35.Ryckaert JP, Ciccotti G, Berendsen HJC. Numerical Integration of the Cartesian Equations of Motion of a System with Constraints: Molecular Dynamics of n-alkanes. J Comput Phys. 1977;23:327–341. [Google Scholar]
- 36.Feller SE, Zhang YH, Pastor RW, Brooks BR. Constant-Pressure Molecular-Dynamics Simulation - the Langevin Piston Method. J Chem Phys. 1995;103:4613–4621. [Google Scholar]
- 37.Martyna GJ, Tobias DJ, Klein ML. Constant-Pressure Molecular-Dynamics Algorithms. J Chem Phys. 1994;101:4177–4189. [Google Scholar]
- 38.Humphrey W, Dalke A, Schulten K. VMD: Visual molecular dynamics. J Mol Graphics. 1996;14:33. doi: 10.1016/0263-7855(96)00018-5. [DOI] [PubMed] [Google Scholar]
- 39.Michaud-Agrawal N, Denning EJ, Woolf TB, Beckstein O. MD Analysis: A toolkit for the analysis of molecular dynamics simulations. J Comput Chem. 2011 doi: 10.1002/jcc.21787. [DOI] [PMC free article] [PubMed] [Google Scholar]
- 40.Snijder HJ, Ubarretxena-Belandia I, Blaauw M, Kalk KH, Verheij HM, Egmond MR, Dekker N, Dijkstra BW. Structural evidence for dimerization-regulated activation of an integral membrane phospholipase. Nature. 1999;401:717–721. doi: 10.1038/44890. [DOI] [PubMed] [Google Scholar]
- 41.Johansson AC, Lindahl E. Amino-acid solvation structure in transmembrane helices from molecular dynamics simulations. Biophysical Journal. 2006;91:4450–4463. doi: 10.1529/biophysj.106.092767. [DOI] [PMC free article] [PubMed] [Google Scholar]
- 42.Burgess NK, Dao TP, Stanley AM, Fleming KG. Beta-barrel proteins that reside in the Escherichia coli outer membrane in vivo demonstrate varied folding behavior in vitro. J Biol Chem. 2008;283:26748–26758. doi: 10.1074/jbc.M802754200. [DOI] [PMC free article] [PubMed] [Google Scholar]
- 43.Stanley AM, Fleming KG. The process of folding proteins into membranes: Progress and challenges. Archives of Biochemistry & Biophysics. 2008;469:46–66. doi: 10.1016/j.abb.2007.09.024. [DOI] [PubMed] [Google Scholar]
- 44.van der Ley P, Steeghs L. Lessons from an LPS-deficient Neisseria meningitis mutant. Journal of Endotoxin Research. 2003;9:124–128. doi: 10.1179/096805103125001522. [DOI] [PubMed] [Google Scholar]
- 45.Goldman RC, Doran CC, Kadam SK, Capobianco JO. Lipid A precursor from Pseudomonas aeruginosa is completely acylated prior to addition of 3-deoxy-D-manno-octulosonate. J Biol Chem. 1988;263:5217–5223. [PubMed] [Google Scholar]
- 46.Huysmans GH, Baldwin SA, Brockwell DJ, Radford SE. The transition state for folding of an outer membrane protein. Proc Natl Acad Sci U S A. 2010;107:4099–4104. doi: 10.1073/pnas.0911904107. [DOI] [PMC free article] [PubMed] [Google Scholar]
- 47.Baaden M, Meier C, Sansom MS. A Molecular Dynamics Investigation of Mono and Dimeric States of the Outer Membrane Enzyme OMPLA. J Mol Biol. 2003;331:177–189. doi: 10.1016/s0022-2836(03)00718-6. [DOI] [PubMed] [Google Scholar]
- 48.Killian JA, von Heijne G. How proteins adapt to a membrane-water interface. Trends in biochemical sciences. 2000;25:429–434. doi: 10.1016/s0968-0004(00)01626-1. [DOI] [PubMed] [Google Scholar]
- 49.Norman KE, Nymeyer H. Indole localization in lipid membranes revealed by molecular simulation. Biophysical journal. 2006;91:2046–2054. doi: 10.1529/biophysj.105.080275. [DOI] [PMC free article] [PubMed] [Google Scholar]
- 50.Tieleman DP, Forrest LR, Sansom MS, Berendsen HJ. Lipid properties and the orientation of aromatic residues in OmpF, influenza M2, and alamethicin systems: molecular dynamics simulations. Biochemistry. 1998;37:17554–17561. doi: 10.1021/bi981802y. [DOI] [PubMed] [Google Scholar]
- 51.Yau WM, Wimley WC, Gawrisch K, White SH. The preference of tryptophan for membrane interfaces. Biochemistry. 1998;37:14713–14718. doi: 10.1021/bi980809c. [DOI] [PubMed] [Google Scholar]
- 52.Lomize AL, Pogozheva ID, Lomize MA, Mosberg HI. Positioning of proteins in membranes: a computational approach. Protein Sci. 2006;15:1318–1333. doi: 10.1110/ps.062126106. [DOI] [PMC free article] [PubMed] [Google Scholar]
- 53.Kandasamy SK, Larson RG. Molecular dynamics simulations of model trans-membrane peptides in lipid bilayers: A systematic investigation of hydrophobic mismatch. Biophysical Journal. 2006;90:2326–2343. doi: 10.1529/biophysj.105.073395. [DOI] [PMC free article] [PubMed] [Google Scholar]
- 54.Stanley AM, Chauwang P, Hendrickson TL, Fleming KG. Energetics of Outer Membrane Phospholipase A (OMPLA) Dimerization. J Mol Biol. 2006;358:120–131. doi: 10.1016/j.jmb.2006.01.033. [DOI] [PubMed] [Google Scholar]
- 55.Stanley AM, Fleming KG. The role of a hydrogen bonding network in the transmembrane beta-barrel OMPLA. J Mol Biol. 2007;370:912–924. doi: 10.1016/j.jmb.2007.05.009. [DOI] [PubMed] [Google Scholar]
- 56.Stanley AM, Treubodt AM, Chauwang P, Hendrickson TL, Fleming KG. Lipid chain selectivity by outer membrane phospholipase A. J Mol Biol. 2007;366:461–468. doi: 10.1016/j.jmb.2006.10.055. [DOI] [PubMed] [Google Scholar]
- 57.Krepkiy D, Mihailescu M, Freites JA, Schow EV, Worcester DL, Gawrisch K, Tobias DJ, White SH, Swartz KJ. Structure and hydration of membranes embedded with voltage-sensing domains. Nature. 2009;462:473–U168. doi: 10.1038/nature08542. [DOI] [PMC free article] [PubMed] [Google Scholar]
- 58.Maccallum JL, Bennett WF, Tieleman DP. Transfer of arginine into lipid bilayers is nonadditive. Biophysical journal. 2011;101:110–117. doi: 10.1016/j.bpj.2011.05.038. [DOI] [PMC free article] [PubMed] [Google Scholar]
Associated Data
This section collects any data citations, data availability statements, or supplementary materials included in this article.
Supplementary Materials
Supplementary Figure 1
Panel A shows the data from Dorairaj & Allen that is replotted here for comparison; Panel B shows the data with the abscissa changed to distance from the phosphate plan; Panel C (blue) shows the Dorairaj & Allen data with the central 8 Å removed; overlaid in red are the data from Moon & Fleming, Figure 3.


