

Abstract
Chromosomal inversions allow genetic divergence of locally adapted populations by reducing recombination between chromosomes with different arrangements. Divergence between populations (or hybridization between species) is expected to leave signatures in the neutral genetic diversity of the inverted region. Quantitative expectations for these patterns, however, have not been obtained. Here, we develop coalescent models of neutral sites linked to an inversion polymorphism in two locally adapted populations. We consider two scenarios of local adaptation: selection on the inversion breakpoints and selection on alleles inside the inversion. We find that ancient inversion polymorphisms cause genetic diversity to depart dramatically from neutral expectations. Other situations, however, lead to patterns that may be difficult to detect; important determinants are the age of the inversion and the rate of gene flux between arrangements. We also study inversions under genetic drift, finding that they produce patterns similar to locally adapted inversions of intermediate age. Our results are consistent with empirical observations, and provide the foundation for quantitative analyses of the roles that inversions have played in speciation.
Keywords: chromosomal inversions, coalescent models, local adaptation, recombination, genetic variation
1. Introduction
Chromosomal inversions have been important to evolutionary biology for decades (reviewed in [1,2]). As genetic markers, inversions have served the study of balanced polymorphisms [3], geographical clines [4] and meiotic drive [5]. Perhaps, the most important property of chromosomal inversions is their potential to create reproductive isolation. The observation of polymorphisms within species and fixed differences between closely related species led to the suggestion that chromosomal rearrangements play a causative role in speciation [3,4]. Heterokaryotypic individuals (chromosomal heterozygotes) of some species have problems in meiosis that could generate a reproductive barrier between populations fixed for different arrangements. Based on this feature, White [6,7] proposed his ‘stasipatric’ mode of speciation in which inversions drive reproductive isolation. That hypothesis, however, relies on strong assumptions about population structure, genetic drift and/or alternative forces (such as meiotic drive) to account for the spread of underdominant inversions [8,9]. Moreover, not all inversions are structurally underdominant [10], rendering them useless as reproductive barriers.
Alternatively, inversions can facilitate speciation because they are potent recombination modifiers [11–13]. Recombination in heterokaryotypes is severely reduced, causing associations between sets of alleles inside of the inversion [14,15]. For this reason, alternative chromosomal arrangements can play a key role in facilitating speciation. When alternative arrangements have been established in diverging populations, they may protect the inverted region from introgression and allow the accumulation of alleles that contribute to reproductive isolation [11,12,16]. Their effects on recombination may also be key to how inversions become established in the first place. Dobzhansky [3] suggested that inversions evolve because they reduce recombination between genes with epistatic interactions. Even without epistasis, local adaptation can favour reduced recombination between alleles adapted to the same habitat or genetic background [17,18]. Migration or hybridization is essential in this process: inverted chromosomes gain a fitness advantage because they keep locally adapted alleles together. By reducing recombination, inversions preserve the divergence between populations in the presence of gene flow, which can set the stage for speciation [19]. The hypothesis that reduced recombination in inversions plays a role in speciation is consistent with some lines of empirical evidence [20–23].
Intuition suggests that these different mechanisms that might drive the evolution of inversions will leave distinctive signatures in the DNA. For example, if an inversion spread because it carried favourable alleles, two key patterns might be expected. First, neutral genetic diversity within chromosomal arrangements is likely to be low when compared with the divergence between them. Second, marked peaks of divergence might be found around the breakpoints and at sites close to the selected loci. Patterns consistent with these predictions have been found in Drosophila pseudoobscura [24], Rhagoletis pomonella [25] and Anopheles gambiae [26]. Evidence for selection on loci inside the inversion has also been inferred from strong linkage disequilibria between the inversion and genetic markers putatively linked to selected genes (e.g. in Drosophila melanogaster [27]).
Selection could also target inversions directly, rather than alleles that they carry. The breakpoints of an inversion alter the DNA sequence and may be targets of selection by changing reading frames or expression patterns [28–30]. We expect that direct selection on the breakpoints will produce divergence between arrangements but no additional peaks of divergence inside of the rearranged region. This is the pattern seen in the inversion polymorphism O3+4/OST in Drosophila subobscura, which has strong geographical clines suggestive of selection and high divergence between arrangements throughout the length of the rearrangement [31]. In other cases, however, no apparent signature of selection has been found (e.g. in Anopheles funestus [32] and A. gambiae [33]). These previous observations suggest that patterns can be found in linked neutral genetic data, but also highlight the fact that we do not have quantitative predictions for those patterns that would enable tests of alternative hypotheses.
When are inversions expected to hold neutral divergence between chromosome arrangements? Reduced recombination in heterokaryotypes decreases the rate at which a gene lying within an inversion moves onto a standard chromosome, and vice versa. This gene flux between chromosome arrangements (a result of double recombination events and gene conversion [34,35]) has genetic consequences that are similar to migration between populations. Consequently, inversions are expected to show some of the same patterns of neutral genetic diversity seen in subdivided populations. Using a coalescent approach, Navarro et al. [36] found that an inversion maintained by selection as a balanced polymorphism in one population will show reduced diversity for a substantial period (less than N generations) after it becomes established. Divergence between the two arrangements is also expected to accumulate with time, especially near the breakpoints where the gene flux rate is very strongly reduced. Although this result suggests that inversions under direct divergent selection would show similar patterns, no expectations have been obtained for inversions that carry loci under divergent selection. We also lack predictions for a basic null model of neutral inversions.
Motivated by these gaps in the theory, and with the aim of developing expectations for the patterns observed in nature, here we develop coalescent models of chromosomal inversions. We consider two populations that exchange migrants or hybridize; these could be diverging populations of a single species or two hybridizing species (in either primary or secondary contact). We assume that this genetic exchange has been going on for a long period. Our results therefore do not apply to cases of recent secondary contact, although the models could be adapted to study that situation.
We consider three alternative scenarios. The first we refer to as locally adapted breakpoints. Here, the chromosomal lesion caused by an inversion is under selection with opposing direction in two populations that exchange migrants. Local adaptation might result from different environmental conditions experienced by the two populations or hybridizing species. Alternatively, it could result from interactions with genetic differences between the populations at other parts of the genome. Our second model is of locally adapted alleles segregating at loci within an inversion. Motivated by the model of Kirkpatrick & Barton [18], this scenario considers an inversion that has spread in one of two populations because it captures two alleles that are locally adapted. Both of these first two models are relevant to discussions about the roles the inversions play in genetic isolation between species. Our third model is of a selectively neutral inversion that has spread by random genetic drift. This model provides an appropriate null model for comparison with the first two models. Perhaps surprisingly, we find that drift can generate patterns that resemble those resulting from the first two models.
Our aim is to provide intuition for the patterns of neutral diversity around inversions in divergent populations. We therefore focus on the expected coalescence time at a selectively neutral site for a pair of chromosomes; this quantity is proportional to the expected neutral genetic diversity or divergence [37].
2. Models and results
We are interested in the coalescent patterns of neutral sites (e.g. a nucleotide or a microsatellite) in a chromosome region that is polymorphic for an inversion. There are two chromosome arrangements that we refer to as standard (S) and inverted (I). In homokaryotypes, the rate of recombination between the breakpoints (that is, the map length of the inversion) is r. Gene flux, denoted ϕ, is defined as probability that a gene in a heterokaryotype recombines from a standard chromosome to an inversion or vice versa (by double recombination or gene conversion). We consider two populations of equal and constant size N. Mating within each population is random, and deviations from Hardy–Weinberg equilibrium are assumed negligible. Migration (or hybridization) between the populations occurs at rate m, and we assume that rate has been constant for much longer than N generations. Selection favours arrangement S in population 1 and arrangement I in population 2. The polymorphism is maintained such that the rare (disfavoured) arrangement is at frequency q in each population. We begin by assuming the inversion is infinitely old, so patterns of neutral genetic variation reflect a migration–selection–recombination equilibrium. This assumption gives good approximations for inversions much older than N generations. In a later section, we consider inversions that have invaded more recently.
We focus on obtaining the expected coalescent time ( , in generations) for genes sampled from two chromosomes (which may or may not have the same arrangement). Moving backwards in time, three types of events can occur. First, a gene can move from one population to the other as the result of migration (hybridization). Because selection maintains differences in karyotype frequencies between populations, migration is not conservative (i.e. the karyotype frequencies of migrants into and out of a population are not equal [38]). Second, a gene can recombine from one genetic background to another. Genes move between standard and inverted chromosomes (in heterokaryotypes), and also between chromosomes with the same arrangement but different selected alleles (in homokaryotypes). Third, coalescence occurs if two genes shared a common ancestor in the previous generation. This event can only occur if the genes are present in the same population and are carried on the same chromosomal arrangement. In our model of locally adapted alleles, coalescence further requires that the genes share the same genetic background of selected alleles. With the exception of the case of a neutral inversion, our models produce results for arbitrary values of N. In the cases we present results for specific values of N, we do so solely for ease of presentation and comparison to empirical data.
We analysed the models using three approaches. First, we derived analytical expressions for the expected coalescence times based on the structured coalescent (reviewed in [37], ch.5). The calculations are complicated, so we developed programs in Mathematica [39] that perform the algebra. The details are given in the electronic supplementary material, appendix A, and the Mathematica code is available on request from the authors. Second, we developed an independent analytical method for the case of locally adapted breakpoints. We derived the generating functions for the distribution of coalescence times (see electronic supplementary material, appendix A). Last, we developed stochastic simulations of coalescent processes. The simulations generate realizations of the coalescent process for sites linked to an inversion using algorithms similar to previous studies [40,41]. In addition to verifying results, these simulations allow us to study the cases in which the inversion appeared recently. Simulations were implemented in C++, and the code is available on request from the authors.
The rate of gene flux between standard and inverted chromosomes is lowest near the breakpoints and increases towards the midpoint of the inversion [34]. To model this effect, we simply assume that ϕ declines linearly from a maximum at the midpoint of the inversion to 0 at the breakpoints. More complex models of gene flux [34] allow for a nonlinear decline of ϕ. While those alternative assumptions will affect the quantitative patterns of coalescence times along the chromosome, our qualitative conclusions are insensitive to those details (see electronic supplementary material, figure S1). Recombination rates in regions flanking an inversion are also reduced in heterokaryotypes [42], but the scale and pattern of this effect are not well characterized. For simplicity, we assume recombination is unaffected outside of the rearranged region, and include results for those regions to offer a contrast to the patterns inside of the inversion.
We now describe results for three situations. The first two are for locally adapted breakpoints and locally adapted alleles for old inversion polymorphisms. The third situation is of a selectively neutral inversion that is drifting through a single population. Neutral inversions that are still polymorphic will typically be young. We therefore end by revisiting the cases of locally adapted breakpoints and alleles when selection has established the inversion polymorphism recently, and compare those results with the case of neutral drift.
(a). Old inversions: locally adapted breakpoints
In our first model, the inversion polymorphism is maintained as a result of local adaptation of the breakpoints. Arrangement S is favoured by selection in population 1. The viabilities of IS and II are (1 – hs) and (1 – s) relative to SS (set to unity). In population 2, the I arrangement is favoured with symmetric selection coefficients. Selection affects the results only through q, which we calculate numerically. Additional details are described in the electronic supplementary material, appendix A. The analytical results are impractical to show here, so we present numerical evaluations for specific parameter values.
As a general result, the effect of the inversion on  is smaller for larger values of N, q and ϕ. Divergence between arrangements is particularly high when the product of Nqϕ < 1. This result is consistent with previous analytical approximations for local adaptation by Nordborg (eqn 47 in [43]). Here, we illustrate scenarios and compare our results to existing empirical observations using a small set of plausible parameter values. Different results will be obtained using other parameter values, of course, and our methods can be adapted to study those situations.
The left half of figure 1 shows results for a large inversion of size r = 10 cM when each population is of size N = 105. Gene flux is ϕ = 10−5 at the inversion midpoint, consistent with data from Drosophila melanogaster [44,45], but other estimates vary from ϕ = 10−2 to 10−8 [34]. For the case shown by the black curves, the migration (hybridization) rate is m = 0.001, and the selection parameters are s = 0.02 and h = 0.5. At selection–migration equilibrium, the frequency of the locally rare arrangement is q = 0.09. We show expected coalescence times of three types of samples: both genes are sampled from inverted chromosomes ( ), both from standard (
 ), and one from standard and the other from inverted (
 ). All samples are random with respect to population. The grey line shows
  for the case where s = 0.1 leaving other parameters unchanged, so that q = 0.02. The results from our approaches are in good agreement (figure 1).
Figure 1.

Expected coalescent times for neutral sites linked to an old inversion with locally adapted breakpoints (left) or alleles (right). Two genes are sampled from the same arrangement ( ,
,  , filled circles), or between arrangements (
 , open circles), for the cases where q = 0.09 (black lines) or q = 0.02 (grey line). The breakpoints are located at 0 and 10 cM, and an arrow indicates the position of one locally adapted allele. Curves are based on analytical results, and the circles show simulation results (106 runs each). Squares show evaluations from the generating function method (see text). The horizontal dashed line shows the expectation for a neutral subdivided population. In both models, the patterns for the opposite half of the inversion (not shown) are symmetric to the ones presented. Shown on both sides, patterns for a small portion of the flanking region with normal recombination patterns.
Basic coalescence theory for structured populations [37,43,46] shows that, in the absence of the inversion,  for genes sampled from the same population is 4N = 4 × 10⁵ generations for the case shown, and that between populations
  converges to this value as the migration increases. When the product Nm is much greater than 1, little population structure is expected [47]. In the presence of an inversion, figure 1 shows that the expected coalescence time for pairs of genes sampled from the same arrangement (from either population) is near to the neutral expectation from the structured coalescent [37] in the absence of an inversion. This is because, although the migration rate is small (m = 0.001), Nm is large and the high exchange of migrants prevents the divergence between populations.
The expected amount of neutral polymorphism within each arrangement is very similar inside and outside of inverted regions when the inversions are old (figure 1). When one gene is sampled from an inverted and the other from a standard chromosome, however,  is substantially longer. The difference grows as we move closer to the breakpoints. Because of our simplifying assumption that the inversion is infinitely old,
  becomes infinite at the breakpoints. Stronger selection also increases
  by reducing q, hence reducing the opportunity for gene flux. At the centre of the inversion, for these sets of parameters
  is several times larger than the expectation under the standard neutral model. The implication is that we expect substantially greater divergence between arrangements than diversity within arrangements near the breakpoints, even for very old inversions.
Figure 2 shows the effect of migration rate on coalescence times within and between chromosomal arrangements. We quantify these effects using two statistics. The first is related to the amount of neutral diversity we expect between these two populations: FST = 1 − ( ), where
  is the expected coalescence time for a pair of genes sampled from the total (combined) population and
  is for a pair sampled from the same subpopulation (see eqn 22 in [48]). A similar statistic relates to the expected divergence in neutral genetic variation between chromosome arrangements: FAT = 1 − (
 ), where
  is the expected coalescence time for pairs of the same arrangement sampled randomly from the total population. We varied m while leaving other parameters constant, which alters q. Varying s while leaving the other parameters unchanged has similar effects.
Figure 2.

The effect of migration (Nm) on FST and FAT under the model of locally adapted breakpoints. Results are shown for three values of gene flux: ϕ = 10−3 (dotted line), ϕ = 10−5 (dashed lines) and ϕ = 10−8 (solid lines).
The fraction of diversity found between populations (FST) goes down as migration increases. However, high levels of population structure are obtained under much stronger migration than the expected in the absence of the inversion (Nm > 1; see [47]), provided that the inversion reduces gene flux considerably (ϕ < 10−3). At low migration rates, the arrangements are close to fixation in the populations where they are beneficial, reducing the effective gene flux rate. As migration increases, diversity between populations declines due to the reduced differences in the frequencies of the arrangements. The genetic structure between chromosome arrangements is less sensitive to migration, remaining essentially unaffected for ϕ = 10−8. This result illustrates the role of reduced gene flux in the maintenance of differences between populations and arrangements.
(b). Old inversions: locally adapted alleles
Our second model considers the situation in which two loci are polymorphic, with alternative alleles at each locus adapted in the two populations (or species). Theory shows that this situation can maintain alternative chromosomal rearrangements even if the breakpoints of the inversion are themselves selectively neutral [18].
Denote the two loci as A (with alleles A1 and A2) and B (with alleles B1 and B2). Alleles A1 and B1 are favoured in population 1, whereas alleles A2 and B2 are favoured in population 2. We assume symmetric selection with no dominance: in population 1, each copy of alleles A2 and B2 decreases fitness by s/2, whereas in population 2 alleles A1 and B1 have that effect. We assume that the polymorphisms at these loci are infinitely old. The inversion captured alleles A2 and B2, which caused it to invade population 2. The positions of the selected loci are assumed symmetric so that the distance between the left breakpoint and locus A is equal to the distance between locus B and the right breakpoint. Adding these selected loci to the model substantially increases its complexity (see electronic supplementary material, appendix A). Consequently, we again only present numerical evaluations of our analytic expressions here.
Results for expected coalescence times are shown on the right-hand side of figure 1. An arrow indicates the position of one selected locus. (The left half of the inversion, including the second locus, has symmetric patterns and is not shown.) Parameter values are as for the first model of locally adapted breakpoints. For pairs of genes sampled from the same arrangement, we see that coalescence times are very similar to the first model (on the left in the figure) and to the neutral expectation from the structured populations (dashed line).
When one gene is sampled from an inverted and one from a standard chromosome, however, a dramatic difference is apparent. Locally adapted alleles produce peaks in  , a pattern consistent with classical balancing selection [49,50]. Divergence decreases as we move away from the selected loci. The force behind this pattern is recombination in homokaryotypes, which is considerably large (Nr = 104). High recombination causes the region affected by selection on loci to be small. The effect of locally adapted alleles is expected to be wider in inversions when the product of Nqr is smaller, for example, as a result of strong selection (figure 1, grey lines) or small population size (see electronic supplementary material, figure S2). The implication of these potentially narrow peaks is that we may require genetic markers very tightly linked to a selected locus to detect a signature particular of this model.
(c). Young inversions: drift
To this point, we have focused on inversion polymorphisms that have been maintained by selection for long periods of time. Results from Drosophila, however, suggest that some inversions are relatively young [51]. This raises the question of how the age of the inversion affects the patterns we are describing.
We begin our study of young inversions with a null model in which a polymorphic inversion has drifted to its current frequency in a single population. (Old inversions that evolved by drift will either be fixed or lost.) This situation provides a useful null model for comparison in the following sections in which young inversions initially spread by selection. We studied this case by simulation. In a first step, a stochastic trajectory is simulated to give the frequency of the inversion from its origin at a (random) time in the past to its current frequency x0 [52]. In a second step, the backward coalescent process conditional on this trajectory is simulated [40]. The electronic supplementary material, appendix B describes the algorithm in detail. We simulated 106 realizations of the process.
Figure 3a shows  for a neutral inversion that is currently at a frequency of x0 = 0.5 in a population of size N = 2 × 10⁵. The average age of the inversion is T* = 2.8 × 10⁵ generations, which is consistent with the expected age of a neutral allele currently at frequency 0.5 [53]. Inside the inversion,
  within both arrangement types is reduced with respect to the Standard Neutral Model (SNM, shown by a dashed line). This is because only chromosomes with the same rearrangement can coalesce, and the number of chromosomes with a given arrangement is smaller than 2N.
Figure 3.

Expected coalescent time for pairs of genes linked to a young inversion under three alternative models. Two genes are sampled from the same arrangement ( ,
,  , filled circles), or different arrangements (
 , open circles). (a) A neutral inversion in a single population, at frequency x0 = 0.5. (b) An inversion with locally adapted breakpoints. (c) An inversion that carries two locally adapted alleles. In (b) and (c), T* = 0.1 and q = 0.09. The breakpoints are at 0 and 10 cM, and an arrow indicates the position of one locally adapted allele. The points show simulation results (106 runs each), and lines are added for clarity purposes only. The dashed line shows the SNM for (a), and a neutral subdivided population for (b) and (c). Only the left half of the inversion is shown for each case; patterns for the right half of the inversion are symmetric to the ones presented.
There is also an increase in coalescence times between S and I arrangements compared with the SNM, and a marked peak at the breakpoints. Going backwards in time, if a gene is completely linked to the breakpoint of an inverted chromosome, it cannot coalesce with a gene on a standard chromosome until before the origin of the inversion. At this point, the single ancestral I chromosome mutates into an S chromosome, and can coalesce with other S chromosomes. Outside of the inversion, coalescent times converge to the SNM as we move along the chromosome away from breakpoint. This contrast between inside and outside of the rearranged segment illustrates the effect of reduced recombination.
Qualitatively, these coalescent patterns are similar to what is seen at sites linked to a weak selective sweep [54,55]. This point will become relevant shortly when we compare these results with those for inversions established by selection.
(d). Young inversions: locally adapted breakpoints and alleles
We now consider an inversion that appeared at time T* in the past and was then established by selection. For this purpose, we obtain the frequency trajectories from deterministic forward-time models. In the coalescent simulations, we follow these trajectories backwards in time to frequency 1/2N. We present the case of a very young inversion, where T* = 104 generations and all other parameters are as for the old inversions described above.
Figure 3b,c shows  for young inversions under both models of local adaptation. The inverted arrangement has extremely reduced diversity, product of the recent selective sweep. On the other hand, there is little effect of this sweep on
  and
and  , which remain close to the expectation given by the neutral structured coalescent. Both models have similar diversity, except again when tightly linked to the selected sites. Given our assumption of ancient polymorphism at the selected loci,
  between different selected alleles is infinite.
These coalescent patterns are qualitatively similar for inversions of about T* < N generations, an age after which the values of  start to increase towards those expected for old inversions (figure 4). There is a period of time (say, N < T* < 4N) during which
  is not considerably reduced and
  is not dramatically increased. The coalescent patterns during this period are qualitatively similar to those for a neutral inversion. The implication is that inversions of intermediate ages are expected to present patterns of neutral diversity with little evidence of selection. Nevertheless, throughout this period, levels of FAT (between 0.4 and 0.5) remain higher than those observed in drifting inversions (FAT = 0.3). This difference may be a useful diagnostic for inversions of intermediate age.
Figure 4.
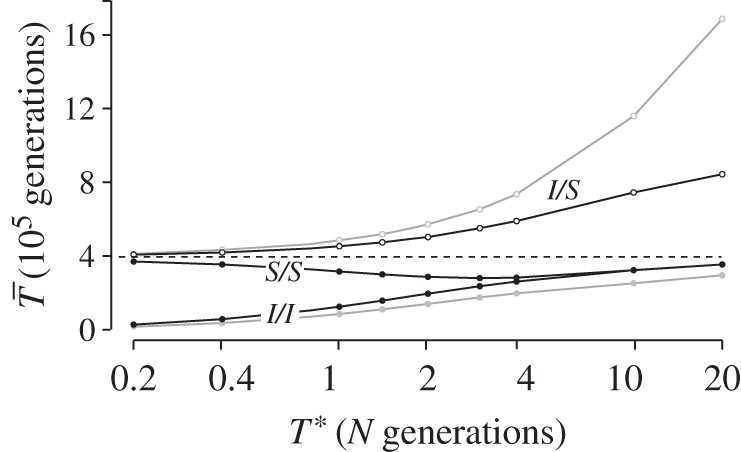
Effect of the age inversion, T* (in N generations), on the expected coalescent time of pairs of genes under the locally adapted breakpoints model (at ϕ = 10−5, N = 105). The points show simulation results (105 runs each), and lines are added for clarity purposes only. Two cases are presented q = 0.09 (black lines), and q = 0.02 (grey lines).
3. Discussion
Chromosomal inversions under local selection affect neutral diversity in two ways. For a period of about N generations after their origin, inversions cause decreased diversity within chromosome types. After this period, the effect of the partial sweep disappears and a second pattern emerges as the chromosome types diverge. These predictions are encouraging for the search of signatures of selection in chromosomal inversions, and they suggest that inversions may hold neutral divergence that can be detected under some conditions. Divergence between arrangements is particularly strong when m ≪ s and Nqϕ < 1. However, high divergence between chromosome types is not always expected. That is the case for inversions of intermediate age (when T* is about N generations), inversions that do not reduce gene flux considerably, and populations in which selection against migrants is not strong enough (say, when m/hs > 0.1). The patterns of divergence predicted by our models appear consistent with data from some inversion systems [24,27], and also offer explanations for why other systems do not show a significant departure from neutrality [32,56].
Reduced gene flux between chromosome arrangements is the key driver of the patterns observed. The neutral model shows that young inversions will have diversity patterns that differ from SNM expectations if they suppress gene flux. Additionally, reduced levels of ϕ under local adaptation maintain neutral divergence between arrangements even in situations where high migration has eliminated any signal of divergence between populations elsewhere in the genome. In our models, values of Nϕ < 10 are necessary to obtain high  , a result consistent with Navarro et al. [36]. Given the estimated range of ϕ in nature (10−2–10−8 [34,35,57]; assuming N values of about 104–106 and m ≪ s) many inversions—but not all—have the potential to harbour increased divergence between arrangements.
When an inversion polymorphism is established by selection, it is expected to show reduced diversity for a period of time of the order of N generations. Old inversions recover diversity and accumulate considerable divergence from standard chromosomes. In this continuum between recent and ancient polymorphism, there is a period during which levels of diversity within and between arrangements will be very similar to neutral expectations (between about N and 4N generations; see figure 4). This is a substantial period that spans the estimated ages of some inversion polymorphisms [51]. For example, some inversions in A. gambiae (0.4–1.7 N generations old) fall in this age range, and they show little divergence between standard and inverted arrangements [33]. Here, the lack of signal does not imply that the inversions are neutral or uninvolved in divergence between populations.
Inversions maintain increased coalescence times between populations even in high levels of migration. As migration (or hybridization) increases, genetic divergence declines in regions of the genome with normal recombination. The genetic structure between chromosome arrangements can persist in these situations, however, particularly at very low values of ϕ. For gene flux observed around the breakpoints of some inversions (e.g. ϕ = 10−8 [35]), increased  remains unaffected by migration, even as the populations begin to resemble a panmictic population. High levels of migration are frequent in situations of local adaptation, and studies of polymorphic inversions have observed large values of Nm (2.2–16) [24,58]. Populations with this amount of gene flow will show no appreciable differentiation at neutral sites in genomic regions that are not rearranged. For this reason, it may be more informative to compare diversity between arrangements, as it allows us to detect the elevated diversity still present.
Our models predict different patterns of coalescence times and therefore neutral genetic diversity. There are, however, three hurdles that may complicate the process of distinguishing between evolutionary processes. First, the reduction of diversity within chromosome arrangements caused by the initial sweep is similar to the pattern produced by genetic drift. Relative measures of divergence (i.e. FAT) may provide better evidence of inversions under selection, but ruling out drift may require evidence from other sources (such as stable geographical clines [1]). Second, both models of local adaptation predict the same patterns of divergence near the breakpoints. Finding additional peaks of divergence within the inversion would suggest the presence of locally adapted alleles. Third, extremely reduced gene flux will cause increased divergence throughout the rearrangement, ‘swamping’ potential peaks of divergence around locally adapted alleles [59,60].
In essence, our models confirm the intuition that coalescent patterns in inversions behave as special cases of selective sweeps and local selection in which a large portion of the chromosome is tightly linked to the selected sites, thus hitchhiking and diverging with them. Our results are consistent with several previous theoretical results. Our model of locally adapted breakpoints yields results equivalent to Navarro et al. [36] for the patterns within populations when migration is zero and frequencies are kept constant by balancing selection (results not shown). The models are also consistent with theoretical work on balancing selection [46,49], selective sweeps [40,41], local selection [43,59,61] and divergence hitchhiking [56].
Multiple interacting parameters determine the role that chromosomal inversions might play during genomic divergence [19], and our intuition is not enough to understand the patterns produced by these complex interactions. We present these models to provide quantitative expectations for such patterns. Some empirical studies have reported little differentiation between inverted and standard arrangements [32,33]. Our models predict that pattern when the inversion is very young or when conditions allow for high gene flux between the arrangements. Other studies have found high and uniform divergence between inverted and standard arrangements [31,42,62], which is consistent with our models when there is reduced gene flux and/or multiple locally adapted loci within the inversion (as suggested in [56]). Other data show peaks of divergence within an inverted region [24,27,35,63,64], a pattern consistent with our locally adapted alleles model. Fine-scale scans may prove essential to distinguish between these and other hypotheses; comparisons of large sections of the rearranged chromosome [23,65] will typically not be sufficient. High-resolution data are increasingly available [33,63,64,66], and they show trends that lend themselves for further speculation. It is not possible, however, to justify any conclusions without quantitative data analyses for which our models are only the foundation.
How will data ultimately be linked with models to give quantitative conclusions for how inversions evolve? Even biologically simple models for inversions are sufficiently complex to make standard statistical approaches infeasible. One way forward is by combining coalescent simulations with analysis techniques akin to approximate Bayesian computation (reviewed in [67,68]). Results from models presented here will be important for identifying which summary statistics to use in that approach. (For example, FAT is promising in some situations.) Developing expectations for other statistics that may be informative (such as linkage disequilibrium and long distance associations, e.g. [24,27]), and extending our models to other scenarios of interest, will require future theoretical work.
Acknowledgements
We thank J. Feder, R. Hopkins, C. Machado, P. Nosil, S. Peischl and two anonymous reviewers for helpful comments on the manuscript. This work was supported by NSF grant DEB- 0819901 to M.K.
References
- 1.Hoffmann A., Rieseberg L. 2008. Revisiting the impact of inversions in evolution: from population genetic markers to drivers of adaptive shifts and speciation? Annu. Rev. Ecol. Evol. Syst. 39, 21. 10.1146/annurev.ecolsys.39.110707.173532 (doi:10.1146/annurev.ecolsys.39.110707.173532) [DOI] [PMC free article] [PubMed] [Google Scholar]
- 2.Kirkpatrick M. 2010. How and why chromosome inversions evolve. PLoS Biol. 8, 1000501. 10.1371/journal.pbio.1000501 (doi:10.1371/journal.pbio.1000501) [DOI] [PMC free article] [PubMed] [Google Scholar]
- 3.Dobzhansky T. 1951. Genetics and the origin of species (eds Eldredge N., Gould S. J.), 3rd edn. New York, NY: Columbia University Press [Google Scholar]
- 4.White M. J. D. 1973. Animal cytology and evolution, 3rd edn. Cambridge, UK: Cambridge University Press [Google Scholar]
- 5.Sandler L., Hiraizumi Y. 1960. Meiotic drive in natural populations of Drosophila melanogaster. IV. Instability at the segregation-distorter locus. Genetics 45, 1269–1287 [DOI] [PMC free article] [PubMed] [Google Scholar]
- 6.White M. J. D. 1969. Chromosomal rearrangements and speciation in animals. Annu. Rev. Genet. 3, 75–98 10.1146/annurev.ge.03.120169.000451 (doi:10.1146/annurev.ge.03.120169.000451) [DOI] [Google Scholar]
- 7.White M. J. D. 1978. Modes of speciation. San Francisco, CA: W.H. Freeman [Google Scholar]
- 8.Coyne J. A., Orr H. A. 2004. Speciation. Sunderland, MA: Sinauer Associates, Inc [Google Scholar]
- 9.Barton N. H., Charlesworth B. 1984. Genetic revolutions, founder effects, and speciation. Annu. Rev. Ecol. Syst. 15, 133–164 10.1146/annurev.es.15.110184.001025 (doi:10.1146/annurev.es.15.110184.001025) [DOI] [Google Scholar]
- 10.Coyne J. A., Meyers W., Crittenden A. P., Sniegowski P. 1993. The fertility effects of pericentric inversions in Drosophila melanogaster. Genetics 134, 487–496 [DOI] [PMC free article] [PubMed] [Google Scholar]
- 11.Noor M. A. F., Grams K. L., Bertucci L. A., Reiland J. 2001. Chromosomal inversions and the reproductive isolation of species. Proc. Natl Acad. Sci. USA 98, 12 084–12 088 10.1073/pnas.221274498 (doi:10.1073/pnas.221274498) [DOI] [PMC free article] [PubMed] [Google Scholar]
- 12.Rieseberg L. H. 2001. Chromosomal rearrangements and speciation. Trends Ecol. Evol. 16, 351–358 10.1016/S0169-5347(01)02187-5 (doi:10.1016/S0169-5347(01)02187-5) [DOI] [PubMed] [Google Scholar]
- 13.Ortiz-Barrientos D., Reiland J., Hey J., Noor M. A. 2002. Recombination and the divergence of hybridizing species. Genetica 116, 167–178 10.1023/A:1021296829109 (doi:10.1023/A:1021296829109) [DOI] [PubMed] [Google Scholar]
- 14.Sturtevant A. H., Beadle G. W. 1936. The relations of inversions in the X chromosome of Drosophila melanogaster to crossing over and disjunction. Genetics 21, 554–604 [DOI] [PMC free article] [PubMed] [Google Scholar]
- 15.Navarro A., Barton N. H. 2003. Accumulating postzygotic isolation genes in parapatry: a new twist on chromosomal speciation. Evolution 57, 447–459 10.1111/j.0014-3820.2003.tb01537.x (doi:10.1111/j.0014-3820.2003.tb01537.x) [DOI] [PubMed] [Google Scholar]
- 16.Feder J. L., Nosil P. 2009. Chromosomal inversions and species differences: when are genes affecting adaptive divergence and reproductive isolation expected to reside within inversions? Evolution 63, 3061–3075 10.1111/j.1558-5646.2009.00786.x (doi:10.1111/j.1558-5646.2009.00786.x) [DOI] [PubMed] [Google Scholar]
- 17.Charlesworth D., Charlesworth B. 1979. Selection on recombination in clines. Genetics 91, 581–589 [DOI] [PMC free article] [PubMed] [Google Scholar]
- 18.Kirkpatrick M., Barton N. 2006. Chromosome inversions, local adaptation and speciation. Genetics 173, 419. 10.1534/genetics.105.047985 (doi:10.1534/genetics.105.047985) [DOI] [PMC free article] [PubMed] [Google Scholar]
- 19.Nosil P., Feder J. L. 2012. Genomic divergence during speciation: causes and consequences. Phil. Trans. R. Soc. B 367, 332–342 10.1098/rstb.2011.0263 (doi:10.1098/rstb.2011.0263) [DOI] [PMC free article] [PubMed] [Google Scholar]
- 20.Brown K. M., Burk L. M., Henagan L. M., Noor M. A. 2004. A test of the chromosomal rearrangement model of speciation in Drosophila pseudoobscura. Evolution 58, 1856–1860 10.1111/j.0014-3820.2004.tb00469.x (doi:10.1111/j.0014-3820.2004.tb00469.x) [DOI] [PubMed] [Google Scholar]
- 21.Livingstone K., Rieseberg L. 2004. Chromosomal evolution and speciation: a recombination-based approach. New Phytologist 161, 107–112 10.1046/j.1469-8137.2003.00942.x (doi:10.1046/j.1469-8137.2003.00942.x) [DOI] [PMC free article] [PubMed] [Google Scholar]
- 22.Noor M. A. F., Garfield D. A., Schaeffer S. W., Machado C. A. 2007. Divergence between the Drosophila pseudoobscura and D. persimilis genome sequences in relation to chromosomal inversions. Genetics 177, 1417–1428 10.1534/genetics.107.070672 (doi:10.1534/genetics.107.070672) [DOI] [PMC free article] [PubMed] [Google Scholar]
- 23.Yatabe Y., Kane N. C., Scotti-Saintagne C., Rieseberg L. H. 2007. Rampant gene exchange across a strong reproductive barrier between the annual sunflowers, Helianthus annuus and H. petiolaris. Genetics 175, 1883–1893 10.1534/genetics.106.064469 (doi:10.1534/genetics.106.064469) [DOI] [PMC free article] [PubMed] [Google Scholar]
- 24.Schaeffer S. W., Goetting-Minesky M. P., Kovacevic M., Peoples J. R., Graybill J. L., Miller J. M., Kim K., Nelson J. G., Anderson W. W. 2003. Evolutionary genomics of inversions in Drosophila pseudoobscura: evidence for epistasis. Proc. Natl Acad. Sci. USA 100, 8319–8324 10.1073/pnas.1432900100 (doi:10.1073/pnas.1432900100) [DOI] [PMC free article] [PubMed] [Google Scholar]
- 25.Michel A. P., Sim S., Powell T. H. Q., Taylor M. S., Nosil P., Feder J. L. 2010. Widespread genomic divergence during sympatric speciation. Proc. Natl Acad. Sci. USA 107, 9724–9729 10.1073/Pnas.1000939107 (doi:10.1073/Pnas.1000939107) [DOI] [PMC free article] [PubMed] [Google Scholar]
- 26.White B. J., Hahn M. W., Pombi M., Cassone B. J., Lobo N. F., Simard F., Besansky N. J. 2007. Localization of candidate regions maintaining a common polymorphic inversion (2La) in Anopheles gambiae. PLoS Genet. 3, 217. 10.1371/journal.pgen.0030217 (doi:10.1371/journal.pgen.0030217) [DOI] [PMC free article] [PubMed] [Google Scholar]
- 27.Kennington W. J., Partridge L., Hoffmann A. A. 2006. Patterns of diversity and linkage disequilibrium within the cosmopolitan inversion In(3R)Payne in Drosophila melanogaster are indicative of coadaptation. Genetics 172, 1655–1663 10.1534/genetics.105.053173 (doi:10.1534/genetics.105.053173) [DOI] [PMC free article] [PubMed] [Google Scholar]
- 28.Matzkin L., Merritt T., Zhu C., Eanes W. 2005. The structure and population genetics of the breakpoints associated with the cosmopolitan chromosomal inversion In(3R)Payne in Drosophila melanogaster. Genetics 170, 1143–1152 10.1534/genetics.104.038810 (doi:10.1534/genetics.104.038810) [DOI] [PMC free article] [PubMed] [Google Scholar]
- 29.Tsuchimatsu T., et al. 2010. Evolution of self-compatibility in Arabidopsis by a mutation in the male specificity gene. Nature 464, 1342–1346 10.1038/nature08927 (doi:10.1038/nature08927) [DOI] [PubMed] [Google Scholar]
- 30.Puig M., Caceres M., Ruiz A. 2004. Silencing of a gene adjacent to the breakpoint of a widespread Drosophila inversion by a transposon-induced antisense RNA. Proc. Natl Acad. Sci. USA 101, 9013–9018 10.1073/pnas.0403090101 (doi:10.1073/pnas.0403090101) [DOI] [PMC free article] [PubMed] [Google Scholar]
- 31.Munté A., Rozas J., Aguadé M., Segarra C. 2005. Chromosomal inversion polymorphism leads to extensive genetic structure: a multilocus survey in Drosophila subobscura. Genetics 169, 1573–1581 10.1534/genetics.104.032748 (doi:10.1534/genetics.104.032748) [DOI] [PMC free article] [PubMed] [Google Scholar]
- 32.Cohuet A., Dia I., Simard F., Raymond M., Fontenille D. 2004. Population structure of the malaria vector Anopheles funestus in Senegal based on microsatellite and cytogenetic data. Insect Mol. Biol. 13, 251–258 10.1111/j.0962-1075.2004.00482.x (doi:10.1111/j.0962-1075.2004.00482.x) [DOI] [PubMed] [Google Scholar]
- 33.White B. J., Cheng C., Sangaré D., Lobo N. F., Collins F. H., Besansky N. J. 2009. The population genomics of trans-specific inversion polymorphisms in Anopheles gambiae. Genetics 183, 275–288 10.1534/genetics.109.105817 (doi:10.1534/genetics.109.105817) [DOI] [PMC free article] [PubMed] [Google Scholar]
- 34.Navarro A., Betran E., Barbadilla A., Ruiz A. 1997. Recombination and gene flux caused by gene conversion and crossing over in inversion heterokaryotypes. Genetics 146, 695–709 [DOI] [PMC free article] [PubMed] [Google Scholar]
- 35.Schaeffer S. W., Anderson W. W. 2005. Mechanisms of genetic exchange within the chromosomal inversions of Drosophila pseudoobscura. Genetics 171, 1729–1739 10.1534/genetics.105.041947 (doi:10.1534/genetics.105.041947) [DOI] [PMC free article] [PubMed] [Google Scholar]
- 36.Navarro A., Barbadilla A., Ruiz A. 2000. Effect of inversion polymorphism on the neutral nucleotide variability of linked chromosomal regions in Drosophila. Genetics 155, 685–698 [DOI] [PMC free article] [PubMed] [Google Scholar]
- 37.Wakeley J. 2009. Coalescent theory: an introduction. Greenwood Village, CO: Roberts and Company [Google Scholar]
- 38.Nagylaki T. 1980. The strong-migration limit in geographically structured populations. J. Math. Biol. 9, 101–114 10.1007/BF00275916 (doi:10.1007/BF00275916) [DOI] [PubMed] [Google Scholar]
- 39.Wolfram Research, I 2008. Mathematica, v. 7.0 edn. Campaign, IL: Wolfram Research, Inc [Google Scholar]
- 40.Kaplan N. L., Hudson R. R., Langley C. H. 1989. The ‘hitchhiking effect’ revisted. Genetics 123, 887–899 [DOI] [PMC free article] [PubMed] [Google Scholar]
- 41.Kim Y., Stephan W. 2002. Detecting a local signature of genetic hitchhiking along a recombining chromosome. Genetics 160, 765–777 [DOI] [PMC free article] [PubMed] [Google Scholar]
- 42.Machado C. A., Haselkorn T. S., Noor M. A. F. 2007. Evaluation of the genomic extent of effects of fixed inversion differences on intraspecific variation and interspecific gene flow in Drosophila pseudoobscura and D. persimilis. Genetics 175, 1289–1306 10.1534/Genetics.106.064758 (doi:10.1534/Genetics.106.064758) [DOI] [PMC free article] [PubMed] [Google Scholar]
- 43.Nordborg M. 1997. Structured coalescent processes on different time scales. Genetics 146, 1501–1514 [DOI] [PMC free article] [PubMed] [Google Scholar]
- 44.Chovnick A. 1973. Gene conversion and transfer of genetic information within the inverted region of inversion heterozygotes. Genetics 75, 123–131 [DOI] [PMC free article] [PubMed] [Google Scholar]
- 45.Payne F. 1924. Crossover modifiers in the third chromosome of Drosophila melanogaster. Genetics 9, 327–342 [DOI] [PMC free article] [PubMed] [Google Scholar]
- 46.Kaplan N., Hudson R. R., Iizuka M. 1991. The coalescent process in models with selection, recombination and geographic subdivision. Genet. Res. 57, 83–91 10.1017/S0016672300029074 (doi:10.1017/S0016672300029074) [DOI] [PubMed] [Google Scholar]
- 47.Wright S. 1951. The genetical structure of populations. Ann. Eugen. 15, 323–354 10.1111/j.1469-1809.1949.tb02451.x (doi:10.1111/j.1469-1809.1949.tb02451.x) [DOI] [PubMed] [Google Scholar]
- 48.Slatkin M. 1991. Inbreeding coefficients and coalescence times. Genet. Res. 58, 167–175 10.1017/S0016672300029827 (doi:10.1017/S0016672300029827) [DOI] [PubMed] [Google Scholar]
- 49.Hudson R. R., Kaplan N. L. 1988. The coalescent process in models with selection and recombination. Genetics 120, 831–840 [DOI] [PMC free article] [PubMed] [Google Scholar]
- 50.Kaplan N. L., Darden T., Hudson R. R. 1988. The coalescent process in models with selection. Genetics 120, 819–820 [DOI] [PMC free article] [PubMed] [Google Scholar]
- 51.Andolfatto P., Depaulis F., Navarro A. 2001. Inversion polymorphisms and nucleotide variability in Drosophila. Genet. Res. 77, 1–8 10.1017/S0016672301004955 (doi:10.1017/S0016672301004955) [DOI] [PubMed] [Google Scholar]
- 52.Przeworski M., Coop G., Wall J. 2005. The signature of positive selection on standing genetic variation. Evolution 59, 2312–2323 10.1111/j.0014-3820.2005.tb00941.x (doi:10.1111/j.0014-3820.2005.tb00941.x) [DOI] [PubMed] [Google Scholar]
- 53.Kimura M., Ohta T. 1971. Theoretical topics in population genetics. Princeton, NJ: Princeton University Press [Google Scholar]
- 54.Gillespie J. H. 2000. Genetic drift in an infinite population: the pseudohitchhiking model. Genetics 155, 909–919 [DOI] [PMC free article] [PubMed] [Google Scholar]
- 55.Barton N. H. 2000. Genetic hitchhiking. Phil. Trans. R. Soc. Lond. B 355, 1553–1562 10.1098/rstb.2000.0716 (doi:10.1098/rstb.2000.0716) [DOI] [PMC free article] [PubMed] [Google Scholar]
- 56.White B. J., Cheng C., Simard F., Costantini C., Besansky N. J. 2010. Genetic association of physically unlinked islands of genomic divergence in incipient species of Anopheles gambiae. Mol. Ecol. 19, 925–939 10.1111/j.1365-294X.2010.04531.x (doi:10.1111/j.1365-294X.2010.04531.x) [DOI] [PMC free article] [PubMed] [Google Scholar]
- 57.Stump A. D., Pombi M., Goeddel L., Ribeiro J. M. C., Wilder J. A., Torre A. D., Besansky N. J. 2007. Genetic exchange in 2La inversion heterokaryotypes of Anopheles gambiae. Insect Mol. Biol. 16, 703–709 10.1111/j.1365-2583.2007.00764.x (doi:10.1111/j.1365-2583.2007.00764.x) [DOI] [PubMed] [Google Scholar]
- 58.Onyabe D. Y., Conn J. E. 2001. Genetic differentiation of the malaria vector Anopheles gambiae across Nigeria suggests that selection limits gene flow. Heredity 87, 647–658 10.1046/j.1365-2540.2001.00957.x (doi:10.1046/j.1365-2540.2001.00957.x) [DOI] [PubMed] [Google Scholar]
- 59.Feder J. L., Nosil P. 2010. The efficacy of divergence hitchhiking in generating genomic islands during ecological speciation. Evolution 64, 1729–1747 10.1111/j.1558-5646.2010.00943.x (doi:10.1111/j.1558-5646.2010.00943.x) [DOI] [PubMed] [Google Scholar]
- 60.Via S. 2012. Divergence hitchhiking and the spread of genomic isolation during ecological speciation-with-gene-flow. Phil. Trans. R. Soc. B 367, 451–460 10.1098/rstb.2011.0260 (doi:10.1098/rstb.2011.0260) [DOI] [PMC free article] [PubMed] [Google Scholar]
- 61.Charlesworth B., Nordborg M., Charlesworth D. 1997. The effects of local selection, balanced polymorphism and background selection on equilibrium patterns of genetic diversity in subdivided populations. Genet. Res. 70, 155–174 10.1017/S0016672397002954 (doi:10.1017/S0016672397002954) [DOI] [PubMed] [Google Scholar]
- 62.Lawniczak M. K. N., et al. 2010. Widespread divergence between incipient Anopheles gambiae species revealed by whole genome sequences. Science 330, 512–514 10.1126/Science.1195755 (doi:10.1126/Science.1195755) [DOI] [PMC free article] [PubMed] [Google Scholar]
- 63.Kolaczkowski B., Kern A. D., Holloway A. K., Begun D. J. 2011. Genomic differentiation between temperate and tropical Australian populations of Drosophila melanogaster. Genetics 187, 245–260 10.1534/Genetics.110.123059 (doi:10.1534/Genetics.110.123059) [DOI] [PMC free article] [PubMed] [Google Scholar]
- 64.McGaugh S. E., Noor M. A. F. 2012. Genomic impacts of chromosomal inversions in parapatric Drosophila species. Phil. Trans. R. Soc. B 367, 422–429 10.1098/rstb.2011.0250 (doi:10.1098/rstb.2011.0250) [DOI] [PMC free article] [PubMed] [Google Scholar]
- 65.Strasburg J. L., Scotti-Saintagne C., Scotti I., Lai Z., Rieseberg L. H. 2009. Genomic patterns of adaptive divergence between chromosomally differentiated sunflower species. Mol. Biol. Evol. 26, 1341–1355 10.1093/Molbev/Msp043 (doi:10.1093/Molbev/Msp043) [DOI] [PMC free article] [PubMed] [Google Scholar]
- 66.Neafsey D. E., et al. 2010. SNP genotyping defines complex gene-flow boundaries among African malaria vector mosquitoes. Science 330, 514–517 10.1126/Science.1193036 (doi:10.1126/Science.1193036) [DOI] [PMC free article] [PubMed] [Google Scholar]
- 67.Beaumont M. A. 2010. Approximate Bayesian computation in evolution and ecology. Annu. Rev. Ecol. Evol. Syst. 41, 379–406 10.1146/annurev-ecolsys-102209-144621 (doi:10.1146/annurev-ecolsys-102209-144621) [DOI] [Google Scholar]
- 68.Csillery K., Blum M. G. B., Gaggiotti O. E., Francois O. 2010. Approximate Bayesian computation (ABC) in practice. Trends Ecol. Evol. 25, 410–418 10.1016/J.Tree.2010.04.001 (doi:10.1016/J.Tree.2010.04.001) [DOI] [PubMed] [Google Scholar]