

Abstract
Peripheral CD4+Vβ5+ T cells are tolerized to an endogenous mouse mammary tumor virus superantigen either by deletion or TCR revision. Through TCR revision, RAG reexpression mediates extrathymic TCRβ rearrangement and results in a population of post-revision CD4+Vβ5− T cells expressing revised TCRβ chains. We have hypothesized that cell death pathways regulate the selection of cells undergoing TCR revision to ensure the safety and utility of the post-revision population. Here, we investigate the role of Bim-mediated cell death in autoantigen-driven deletion and TCR revision. Bim deficiency and Bcl-2 overexpression in Vβ5 transgenic (Tg) mice both impair peripheral deletion. Vβ5 Tg Bim deficient and Bcl-2 Tg mice exhibit an elevated frequency of CD4+ T cells expressing both the transgene-encoded Vβ5 chain and a revised TCRβ chain. We now show that these dual-TCR expressing cells are TCR revision intermediates, and that the population of RAG-expressing, revising CD4+ T cells is increased in Bim deficient Vβ5 Tg mice. These findings support a role for Bim and Bcl-2 in regulating the balance of survival versus apoptosis in peripheral T cells undergoing RAG-dependent TCR rearrangements during TCR revision, thereby ensuring the utility of the post-revision repertoire.
Keywords: TCR revision, tolerance, Bim, Bcl-2, apoptosis, T cell selection
Introduction
Rigorous selection is imposed on developing lymphocytes to ensure the generation of functional Ag receptors with the capacity to bind foreign Ag while remaining tolerant to self. During T cell development in the thymus, the RAG complex encoded by the Rag1 and Rag2 genes mediates first TCRβ rearrangement at the CD4−CD8− double-negative (DN) stage, followed by TCRα rearrangement at the CD4+CD8+ double-positive (DP) stage (1). Failure to generate a functional pre-TCR (TCRβ chain paired with preTα) at the DN stage or a TCRαβ pair with a useful affinity for self-MHC at the DP stage results in apoptosis. Thymocytes must also survive negative selection, the process by which cells bearing TCRs that recognize self-Ag with too high an affinity are induced to undergo apoptosis. Only an estimated 1–4% of developing thymocytes survive these complex selective processes to enter the mature peripheral T cell pool (2).
The pro-survival molecule B cell lymphoma 2 (Bcl-2) and other members of the Bcl-2 family regulate the balance of survival and apoptosis during lymphocyte development and homeostasis. These proteins interact with each other within an intrinsic death pathway that is primarily mediated by the proapoptotic Bcl-2-homology domain 3-only molecule Bcl-2-interacting mediator of cell death (Bim). Following detection of cellular stress induced by conditions such as growth factor withdrawal, irradiation, or cytotoxic chemicals (3–5), Bim mediates apoptosis by driving activation of Bcl-2 family death effector molecules and subsequent disruption of the outer mitochondrial membrane, cytochrome C release, apoptosome complex assembly, pro-caspase 9 cleavage, and apoptosis. Therefore, Bcl-2 and Bim levels within the cell determine the sensitivity of the cell to this intrinsic death pathway (3–5).
The importance of Bcl-2 family proteins in T cell development was first shown in mice with T cell-lineage-specific Bcl-2 overexpression, in which negative selection (6) and death by neglect (7)# were both less extensive than in wild-type (WT) mice. Bim deficiency confers resistence of thymocytes to death induced by TCR crosslinking and negative selection (8, 9) and results in severe autoimmunity (8, 10). Additionally, Bim has been implicated in the death of DP thymocytes that fail to undergo positive selection (11)#, and of DN thymocytes during TCRβ rearrangement and β selection (12). These combined studies demonstrate a central role for Bim-mediated cell death at various selection stages in T cell development (3–5).
In Vβ5 Tg mice, chronic encounter with an endogenous mammary tumor virus (Mtv) superantigen drives both the deletion of peripheral CD4+Vβ5+ T cells and TCR revision (13)#, the latter being a process characterized by loss of surface Vβ5 (14, 15), reexpression of RAG1, RAG2, and TdT, and appearance of double-stranded breaks signifying Vβ-DJβ recombination intermediates (16, 17)#. Post-thymic RAG-dependent TCR rearrangement drives the rescue and age-dependent accumulation of post-revision CD4+ T cells that are Vβ5− and express a “revised” TCRβ chain (14–16, 18). TCR revision has been clearly identified as a post-thymic process that targets mature peripheral T cells for RAG reexpression and additional TCR rearrangement (19)#.
The germinal center localization of RAG+ CD4+ T cells in Vβ5 Tg mice may provide a microenvironment in which selection of revising T cells occurs (20). The post-revision CD4+Vβ5−TCRβ+ cells rescued through this process bear a diverse TCRβ repertoire (21) and proliferate following TCR crosslinking (16)#. Additionally, post-revision cells respond to TCR-dependent homeostatic signals and display self-MHC restricted recognition of foreign Ag (22).
It is not completely clear whether revised receptors are self-tolerant; however, Vβ5 Tg mice do not exhibit any notable signs of autoimmunity, suggesting that selective processes have imposed self-tolerance on post-revision T cells. We have therefore hypothesized the existence of stringent mechanisms of selection that oversee the process of TCR revision to impose self-MHC restriction of revised TCRs and protect against pathogenic autoreactive TCR specificities, thus ensuring the usefulness and safety of the post-revision repertoire. Previous data indicating the influence of Fas on the accumulation of post-revision T cells (18) suggested death pathways may be involved in the selection of revising T cells.
Given the role that intrinsic Bim-mediated cell death plays during several stages of T cell development in the thymus, we now investigate whether Bim deficiency and Bcl-2 overexpression alter the survival of cells undergoing peripheral deletion and TCR revision in Vβ5 Tg mice. We show that Bim−/− Vβ5 Tg and, to a lesser extent, Bcl-2 Tg Vβ5 Tg mice, exhibit impaired deletion of peripheral Vβ5+ CD4+ T cells. Both Bim deficiency and Bcl-2 overexpression lead to a specific increase in a population of previously uncharacterized TCR revision intermediates expressing dual-TCRs. In addition, RAG+ revising cells are increased in Bim−/− Vβ5 Tg mice. These data indicate that the intrinsic death pathway mediated by Bim and influenced by Bcl-2 regulates the survival of cells undergoing TCR revision, likely providing a means to ensure that cells generated through TCR revision are both useful and safe.
Materials and Methods
Mice
Vβ5 Tg mice on the C57BL/6 (B6) background were bred under specific-pathogen free conditions at the University of Washington. B6 Ly5.2+ and B6.SJL (B6.SJL-PtprcaPepcb/BoyJ) Ly5.1+ mice were purchased from The Jackson Laboratory (Bar Harbor, ME) or bred in house. Bim−/− mice (8) on the B6 background were provided by E. Clark (University of Washington, Seattle, WA). Eμ-bcl-2-25 Tg mice (23)#, in which human Bcl-2 expression is driven by the Eμ Ig heavy chain enhancer and SV40 promoter, hereafter referred to as Bcl-2 Tg mice, were provided on the B6 background by P. Marrack (Howard Hughes Medical Institute and National Jewish Health, Denver, CO). B6 mice carrying loxp flanked Fas alleles (24) were crossed with B6 mice carrying a Cre transgene driven by the dLck promoter (line 3779, (25)). T cells from such Fasfl/fl dLckCre Tg mice begin to delete Fas alleles after positive selection. Rag2pGFP Tg mice (26)# were backcrossed at least 10 generations onto the B6 background in our laboratory. Thymectomy was performed on 7-9-week-old mice as described previously (27). Sorted cells were adoptively transferred by injection into the lateral tail vein in a 200 μl volume of HBSS. All experiments were conducted in accordance with the University of Washington Institutional Animal Care and Use Committee.
Cell preparation, flow cytometry, and sorting
Single-cell suspensions were prepared from thymus, spleen, and lymph nodes. RBCs were removed from spleen by water lysis. For flow cytometry, Fc receptors were blocked with anti-CD16/32 (2.4G2; BD Pharmingen). Cell surface staining was performed in HBSS containing 1% BSA with fluorochrome-conjugated or biotinylated antibodies (followed by fluorochrome-conjugated streptavidin), all purchased from BD Biosciences or eBioscience. Antibodies recognize mouse CD4 (RM4-5), CD8α (53-6.7), CD44 (IM7), CD45R/B220 (RA3-6B2), CD45.1/Ly5.1 (A20), CD45.2/Ly5.2 (104), CD95/Fas (Jo2), panTCRβ (H57-597.13), or Vβ5 (MR9-4). For detecting Vβ5+ cells that co-express Vβ8, fluorochrome-conjugated anti-Vβ8 (F23.1) or trinitrophenol-specific IgG2a κ isotype control (G155-178) was used. Antibodies recognizing Vβ5, TCRβ, and Vβ8 do not cross block. For detection of Foxp3, cells were surface stained, followed by intracellular staining with allophycocyanin-conjugated anti-Foxp3 (FJK-16s) using the Foxp3 Staining Buffer Set and protocol (eBioscience). Flow cytometry data were collected using a FACSCanto (Becton Dickinson) and analyzed with FlowJo software (Treestar). For cell sorting, “untouched” CD4+ T cells were obtained using an EasySep Negative Selection Mouse CD4+ T cell Enrichment Kit (Stem Cell Technologies), followed by cell surface staining of enriched cells. Cell sorting was done using a FACSAria (Becton Dickinson).
Results
Bim is required for deletion of Mtv-reactive peripheral CD4+ T cells
To determine whether Bim is required for deletion of self-reactive peripheral CD4+Vβ5+ T cells following encounter with the endogenous superantigen Mtv-8, we analyzed splenic T cells from Bim+/+ and Bim−/− Vβ5 Tg B6 mice. WT Vβ5 Tg mice exhibited the expected age-dependent decline in the frequency of CD4+ T cells and the diminished CD4:CD8 ratio resulting from deletion of CD4+Vβ5+ T cells, while Bim−/− Vβ5 Tg mice did not (Fig. 1A). Compared to Bim+/+ Vβ5 Tg spleens, Bim−/− Vβ5 Tg spleens contained approximately 5–6 times the absolute number of CD4+ T cells, while the number of CD8+ T cells remained similar (Fig. 1B). In addition, the frequency of Mtv-reactive Vβ5+ CD4+ T cells in TCR nonTg mice inversely correlated with Bim gene dosage (Fig. 1C and 1D), while the frequency of Vβ5+ CD8+ T cells remained unaffected by Bim deficiency (Fig. 1D). The increase in the number and frequency of CD4+ T cells in Bim−/− mice was not due to the preferential generation of CD4+ T cells in the thymus, as the CD4:CD8 ratio among TCRβhigh SP thymocytes was 5.5 ± 1.6 for Vβ5 Tg WT mice and 6.6 ± 2.2 for Vβ5 Tg Bim−/− mice, values that are not statistically different.
Figure 1. Peripheral deletion of Vβ5+CD4+ T cells is Bim-dependent.

Splenocytes from Bim+/+ and Bim−/− Vβ5Tg and nonTg mice were stained for CD4, CD8, Vβ5, and TCRβ surface expression. (A) Representative CD8/CD4 analysis of splenocytes from 20–26 week old mice. The CD4:CD8 ratio is boxed in the upper right of each plot. (B) Charts show the absolute numbers of CD4+ (upper) and CD8+ (lower) splenic T cells in Bim+/+ (filled circles) and Bim−/− (open triangles) Vβ5 Tg mice as a function of age. (C) Representative TCRβ/Vβ5 surface expression by CD4+ T cells from TCR nonTg mice. Numbers in plots indicate the percentage of CD4+ T cells that are Vβ5+TCRβ+. (D) Charts indicate the percent Vβ5+ of CD4+ and CD8+ T cells from 18–32 week old TCR nonTg mice. Data are represented as the mean values with error bars indicating the standard deviation (Bim+/+ N=7; Bim+/− N=6; Bim−/− N=5). P values were calculated using a two-tailed nonparametric Student’s t test (*** p<0.0002).
T cell-specific overexpression of the pro-survival molecule Bcl-2 drove an increase in the percent and number of Vβ5 Tg CD4+ splenocytes and a slight increase in the CD4:CD8 ratio (Supplemental Fig. 1A, 1B upper chart), while the percent and number of TCR nonTg CD4+ T cells was unaltered for most age groups (Supplemental Fig 1B lower chart). These data suggest that T cell-specific Bcl-2-overexpression protects superantigen-reactive CD4+Vβ5+ T cells from deletion in the lymphoid periphery, although to a lesser extent than does the loss of Bim (Fig. 1B). Together, these data demonstrate that the balance of Bim and Bcl-2 influences the deletion of peripheral Vβ5+ CD4+ T cells through chronic encounter with Mtv-8.
Post-revision cells accumulate in the absence of T cell lymphopenia
In all previous studies of TCR revision in Vβ5 Tg mice, the occurrence of TCR revision and the accumulation of post-revision CD4+Vβ5−TCRβ+ T cells coincided with CD4 T cell lymphopenia, resulting from the chronic deletion of CD4+Vβ5+ T cells driven by encounter with Mtv superantigen (14–16, 18). We observed that despite the full CD4+ T cell compartment in Bim−/− Vβ5 Tg mice (Fig. 1A and 1B), the fraction of the CD4+ T cell compartment comprised of post-revision Vβ5−TCRβ+ cells was comparable to that in lymphopenic Bim+/+ Vβ5 Tg mice (Fig. 2A and 2B). Indeed, up to 2–5 million splenic post-revision CD4+Vβ5−TCRβ+ T cells accumulated in aged Bim−/− Vβ5 Tg mice, well in excess of the number found in Bim+/+ Vβ5 Tg mice (Fig. 2C). Therefore, the process of TCR revision does not require a lymphopenic environment, and further, the accumulation of post-revision cells does not require lymphopenia-driven expansion.
Figure 2. Increased numbers of post-revision T cells accumulate in Bim−/− Vβ5 Tg mice.
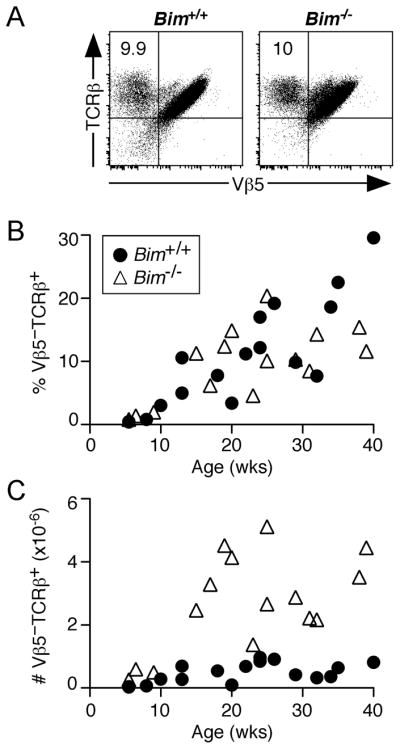
Splenocytes from Bim +/+ and Bim−/− Vβ5 Tg mice mice were stained for CD4, CD8, Vβ5, and TCRβ surface expression. (A) Representative TCRβ/Vβ5 analysis of CD4+ gated cells from 29 week old mice, with numbers indicating the percentage that are Vβ5−TCRβ+ post-revision cells. (B) Chart indicates the percentage of CD4+ T cells that are post-revision Vβ5−TCRβ+ cells as a function of age. (C) Chart indicates the absolute number of splenic CD4+Vβ5−TCRβ+ post-revision T cells as a function of age.
In contrast to Bim−/− Vβ5 Tg mice, which did not show an increase in the frequency of post-revision CD4+ T cells (Fig. 2A and 2B), Fas mutant Vβ5 Tg B6.lpr mice have an increased percent of post-revision T cells compared to WT Vβ5 Tg mice (18)#. To determine whether T cell intrinsic Fas expression influences the accumulation of post-revision cells, we analyzed peripheral T cells from Vβ5 Tg mice as a function of Fas expression. A lower frequency of Vβ5−TCRβ+ cells comprised the Fas+ compared to the Faslow/− CD4+ T cell compartment (Supplemental Fig. 2A and 2B). This was further emphasized by the significant increase in the accumulation of post-revision cells among peripheral T cells rendered Fas− through conditional Fas deletion (Supplemental Fig. 2B). Thus, T cell-intrinsic Fas likely plays a role in the selection of the post-revision repertoire.
Specific increase of dual-TCR expressing CD4+ T cells in Bim−/− Vβ5 Tg mice
While post-revision T cells comprised a similar fraction of the CD4+ T cell pool in Bim−/− and Bim+/+ Vβ5 Tg mice (Fig. 2A and 2B), we observed an increase in a population of CD4+ T cells with diminished Vβ5 but bright TCRβ surface expression, (Fig. 3A, indicated by triangular gate). This population of Vβ5lowTCRβ+ cells comprised roughly 6–9% of the CD4+ population in aged Bim−/− Vβ5 Tg mice, compared to 2–4% in age-matched WT Vβ5 Tg mice (Fig. 3B). Approximately 1–3 million of these cells were detectable in the spleens of Bim−/− Vβ5 Tg mice (Fig. 3C), peaking around 20 weeks of age, an approximate 14-fold increase in cell number relative to WT Vβ5 Tg mice.
Figure 3. Bim−/− Vβ5 Tg mice have increased percents and numbers of CD4+ Vβ5lowTCRβ+ and Vβ5lowVβ8+ T cells.

Splenocytes from Bim+/+ and Bim−/− Vβ5 Tg mice were stained for CD4, CD8, Vβ5, Vβ8, and TCRβ surface expression. (A) Representative Vβ5/TCRβ analysis of CD4+ gated cells from aged 29 week old mice. Numbers in red indicate the percent that are Vβ5lowTCRβ+ (within the triangle-shaped gate). (B) Chart indicates the percent Vβ5lowTCRβ+ of CD4+ cells as a function of age for mice of the indicated genotypes. (C) Chart indicates the absolute number of CD4+Vβ5lowTCRβ+ cells per spleen as a function of age. (D) Representative Vβ5/Vβ8 analysis of CD4+ gated cells from aged mice. Numbers in red indicate the percent of CD4+ cells that are Vβ5lowVβ8+ (upper right quadrant). (E) Chart indicates the percent Vβ5lowVβ8+ of CD4+ T cells as a function of age. (F) Chart indicates the absolute number of CD4+Vβ5lowVβ8+ T cells per spleen as a function of age.
To more precisely identify Vβ5low cells that also express a particular endogenous TCRβ chain, we stained splenocytes for co-expression of Vβ5 and Vβ8, a highly represented Vβ family in B6 mice (21). A population of Vβ5lowVβ8+ cells, comprising approximately 4–8% of CD4+ T cells, was readily identifiable in aged Bim−/− Vβ5 Tg mice, compared to a relatively sparse population in Bim+/+ Vβ5 Tg mice (Fig. 3D). The age-dependent increase in both the percent and number of these Vβ5lowVβ8+ cells in Bim−/− Vβ5 Tg mice follows kinetics that are similar to those of the Vβ5lowTCRβ+ population, again peaking at around 20 weeks of age (Fig. 3E and 3F). Additionally, we detected an increase in Vβ5lowVβ6+ CD4+ T cells in Bim−/− compared to Bim+/+ Vβ5 Tg mice (data not shown). The population of CD4+Vβ5lowTCRβ+ cells was also increased in Bcl-2 Tg Vβ5 Tg mice (Supplemental Fig. 3).
Vβ8 expression by CD4+ T cells does not originate in the thymus of Vβ5 Tg mice
To determine whether Vβ5lowVβ8+ cells represent a failure of allelic exclusion by expressing Vβ8 during thymocyte development in Vβ5 Tg mice, we analyzed CD4 SP thymocytes from Bim−/− and Bim+/+ Vβ5 Tg mice that carry a GFP reporter transgene driven by the Rag2 promoter (26)# to distinguish between GFP+ SP thymocytes and GFP− mature peripheral CD4+ T cells that have immigrated back into the thymus (28, 29). This population of GFP− CD4+ T cells that falls within the CD4 SP gate (Fig 4A) is distinct from the developing SP thymocyte population, being CD44high, CD24low/−, and Qa2high (29). Analysis of recirculating GFP− CD4+ T cells within the thymus of Bim−/− Vβ5 Tg mice revealed specific Vβ8 staining, while none was detected in the GFP+ “true” CD4 SP thymocytes in either WT or Bim−/− Vβ5 Tg mice (Fig. 4B and 4C). Thus, mature peripheral T cells that have re-entered the thymus, but not developing SP thymocytes, express Vβ8 in Vβ5 Tg mice.
Figure 4. Vβ8+ cells are not detectable among CD4 SP thymocytes or CD4+ recent thymic emigrants in Vβ5 Tg mice.

Thymocytes (A–C) and splenocytes (D,E) from Bim +/+ and Bim−/− Vβ5 Tg Rag2pGFP Tg mice were analyzed for GFP reporter expression and for CD4, CD8, Vβ5, and Vβ8 or isotype control surface staining. Numbers in plots indicate the percentage of each gated population. (A) Representative GFP analysis of CD4 SP gated thymocytes, with gates showing the GFP− mature peripheral T cells that have re-entered the thymus and GFP+ developing SP thymocytes. (B) Representative Vβ8 expression and isotype control staining of thymic CD4 SP GFP− and GFP+ gated populations from a Bim−/− Vβ5 Tg mouse. (C) Charts indicate the percentage of CD4 SP GFP+ and GFP− thymocytes that are Vβ8+ compared to isotype control stained cells (Bim+/+ N=3; Bim−/− N=3). (D) Vβ5/GFP plots of CD4+ gated splenocytes showing Vβ5+GFPhigh, Vβ5+GFPlow, Vβ5+GFP−, and Vβ5low/−GFP− gates used for analysis. (E) CD44 and Vβ8 analysis of each indicated subset of splenic CD4+ T cells.
To further rule out thymically-derived Vβ8 rearrangements as a contributor to surface Vβ8 expression by CD4+ T cells in Bim−/− Vβ5 Tg mice, we analyzed splenic GFP+ recent thymic emigrants in Vβ5 Tg Rag2pGFP Tg mice. In Rag2pGFP Tg mice, residual GFP protein decays slowly after Rag expression is extinguished in the thymus (27, 30), labeling recent thymic emigrants in the lymphoid periphery as GFP+ for approximately 2–3 weeks following thymic egress (27). CD4+ GFP+ recent thymic emigrants and GFP− mature peripheral T cells were gated for analysis of Vβ5 and Vβ8 expression (Fig. 4D). Vβ8+ cells were not detected among the CD4+GFP+ recent thymic emigrants in either Bim−/− or Bim+/+ Vβ5 Tg Rag2pGFP Tg mice. Vβ8+ cells only appeared among CD4+GFP− cells following CD44 upregulation (Fig. 4E), in this case a likely indicator of the chronic Mtv-driven T cell activation that initiates TCR revision (16). Combined, these analyses point to peripheral TCR revision as the mechanism by which Vβ5lowVβ8+ T cells are generated in both Bim−/− and Bim+/+ Vβ5 Tg mice, further suggesting that the influence of Bim-mediated cell death on the frequency of Vβ5lowTCRβ+ and Vβ5lowVβ8+ cells occurs in the lymphoid periphery.
Vβ5lowVβ8+ cells are TCR revision intermediates
Knowing that the CD4+ regulatory T cell (Treg) population defined by expression of the lineage-specific transcription factor Foxp3 is excluded from the process of TCR revision (31), we investigated whether Vβ5lowTCRβ+ and Vβ5lowVβ8+ cells share lineage characteristics with post-revision Vβ5−TCRβ+ cells. The CD4+Foxp3+ Treg population did not include Vβ5lowTCRβ+, Vβ5lowVβ8+, or post-revision Vβ5−TCRβ+ cells in either Bim−/− or Bim+/+ Vβ5 Tg mice (Supplemental Fig. 4). The enhanced accumulation of Vβ5lowTCRβ+ and Vβ5lowVβ8+ cells in Bim−/− Vβ5 Tg mice and their common lineage exclusion from the Foxp3+ Treg population, combined with the absence of Vβ8 expression in thymocytes and recent thymic emigrants, all support the idea that these are precursors of the Vβ5−TCRβ+ post-revision population.
To determine directly whether Vβ5lowVβ8+ cells represent a population of TCR revision intermediates, we stained CD4+ T cells from aged Bim−/− Vβ5 Tg mice for Vβ5 and Vβ8 expression, sorted to isolate Vβ5+Vβ8+ and Vβ5+Vβ8− T cells (Fig. 5), and transferred these cells into separate congenically marked WT Vβ5 Tg recipients. Within 7 days post-transfer, donor Vβ5+Vβ8+ T cells had downregulated surface Vβ5 expression while maintaining surface Vβ8 levels, resulting in a significant population (comprising approximately half of the donor cells) of post-revision Vβ5−Vβ8+ T cells (Fig 5). These data define Vβ5+Vβ8+ CD4+ T cells as TCR revision intermediates. The Vβ5+Vβ8− sorted population, being much less enriched for TCR revision intermediates, also gave rise to a small population (6%) of post-revision Vβ5− cells (Fig. 5).
Figure 5. Vβ5lowVβ8+ cells are TCR revision intermediates.

CD4+ spleen and lymph node cells enriched from aged Bim−/− Vβ5 Tg mice were surface stained for Vβ5 and Vβ8, followed by sorting to obtain Vβ5+Vβ8+ and Vβ5+Vβ8− populations that were >99.5% Vβ5+. Sorted cells were adoptively transferred into separate congenically marked Ly5.1+ Vβ5 Tg recipients. Donor CD4+ populations were analyzed for Vβ5 and Vβ8 surface expression 7 days post-transfer. Data are representative of 3 independent experiments. Numbers in plots indicate the percentage of each gated population.
We conducted a broad analysis of the influence of Bim-mediated death on the enrichment of various splenic lymphocyte populations by determining the cell number fold increase in aged Bim−/− Vβ5 Tg relative to age-matched Bim+/+ Vβ5 Tg mice. The absolute number of total splenocytes was increased approximately 2-fold in aged Bim−/− Vβ5 Tg mice, while B cell numbers were modestly increased and CD8+ T cell numbers remained relatively unaffected (Fig. 6 and Fig. 1B). In contrast, CD4+ T cell numbers were approximately 6-fold higher, resulting from the block in deletion of peripheral Vβ5+ T cells (Fig. 6 and Fig. 1). The TCR revision intermediate Vβ5lowTCRβ+ and Vβ5lowVβ8+ populations were specifically enriched in Bim−/− Vβ5 Tg mice compared to the increase in the CD4+ T cell population as a whole, indicating the influence of Bim-mediated cell death in TCR revision (Fig. 6 and Fig. 3). Although post-revision CD4+ T cells accumulate in much higher numbers in Bim−/− Vβ5 Tg mice (Fig. 2C), the cell number fold increase was not specifically elevated relative to that of the CD4+ T cell population as a whole (Fig. 6 and 2B). These cumulative data demonstrate the influence of Bim deficiency on the specific increase in TCR revision intermediates and suggest a role for Bim in the selection of cells undergoing TCR revision.
Figure 6. TCR revision intermediates are specifically enriched in Bim−/− Vβ5 Tg mice.

The absolute numbers of the indicated splenic populations were used to calculate the cell number fold increase in aged Bim−/− relative to Bim +/+ Vβ5 Tg mice. Data were compiled from 17–29 week old mice (Bim +/+ N=7; Bim−/− N=7).
Increased frequency of revising T cells in Vβ5 Tg Bim−/− mice
We reasoned that the increased TCR revision intermediate populations found in Bim−/− and Bcl-2 Tg Vβ5 Tg mice could occur through two separate, although not mutually exclusive, means. First, Bim-mediated death could play a role in eliminating cells undergoing RAG-mediated VDJ recombination during TCR revision. If this were the case, we would expect to see an increase in the population of RAG-expressing peripheral CD4+ T cells in Bim−/− Vβ5 Tg mice. Second, Bim-mediated death could play a role in the elimination of cells bearing non-useful and/or self-reactive revised TCRs at the TCR revision intermediate stage, in which case, an increase in the frequency of RAG-expressing cells would not be expected.
To determine whether Bim−/− Vβ5 Tg mice experience an increase in the frequency of RAG+ revising cells, we analyzed CD4+ T splenocytes from thymectomized Bim−/− and Bim+/+ Vβ5 Tg Rag2pGFP Tg mice (17, 20). In these experiments, thymectomy 4–6 weeks prior to analysis allows for the complete decay of recent thymic emigrants from the lymphoid periphery, permitting the detection of a residual population of CD4+ GFP+ cells undergoing TCR revision (17). CD4+ T cells from thymectomized Bim−/− compared to Bim+/+ Vβ5 Tg Rag2pGFP Tg mice exhibited a 2-fold increase in the frequency of GFP+ revising T cells that correlated with an approximate 2-fold increase in Vβ5lowVβ8+ revision intermediate frequency (Fig. 7). Thus, the increase in TCR revision intermediates in Bim−/− Vβ5 Tg mice can be attributed to an increase in RAG+ T cells undergoing TCR revision.
Figure 7. Bim deficiency increases the frequency of revising T cells.

7–9 week-old Bim +/+ and Bim−/− Vβ5 Tg mice hemizygous for the Rag2pGFP reporter allele were thymectomized. 4–5 weeks post-thymectomy, CD4+B220− splenocytes were analyzed for the percent of revising GFP+ cells. GFP background was determined by comparison with cells from aged-matched euthymic Vβ5 Tg mice that did not carry the Rag2pGFP reporter (No GFP control). (A) Representative GFP/CD4, Vβ5/TCRβ, and Vβ5/Vβ8 plots of CD4+B220− gated splenocytes. Numbers in plots indicate the percent of each gated population, with red numbers denoting the percent that are Vβ5lowTCRβ+ (middle plots, right triangular-shaped gate) and Vβ5lowVβ8+ (right plots) TCR revision intermediates. (B) Chart indicates the percent of CD4+B220− cells that are GFP+. Dashed line indicates the background from No GFP control mice, which was set to 0.5% for each experiment. Data represent the mean percent, with error bars indicating the standard error. Data were combined from 4 independent experiments. P value was calculated using an unpaired two-tailed Student’s t test (Bim +/+ N=11; Bim−/− N=5).
Discussion
We investigated the influence of Bim-mediated cell death on deletion and TCR revision of superantigen-reactive peripheral T cells. The deletion of CD4+Vβ5+ T cells in the lymphoid periphery appears to be mediated by this apoptotic pathway, as both Bim deficiency and T-cell-specific overexpression of Bcl-2 resulted in protection against deletion. However, compared to Bim deficiency, the effects of Bcl-2 overexpression only partially blocked CD4+Vβ5+ T cell deletion (Fig. 1 and Supplemental Fig. 1). This apparent discrepancy between Bim−/− and Bcl-2 Tg mice has been noted previously for negative selection of thymocytes, and was proposed to result from post-translational inactivation of Bcl-2 following TCR stimulation (32), although perhaps the Bcl-2 overexpression levels do not reach a threshold sufficient to mediate a full blockade of Bim-mediated apoptosis (33).
Bim deficiency in Vβ5 Tg mice results in a clear increase in the percent of RAG+ CD4+ T cells undergoing TCR revision. This increase in revising cells corresponds to a proportional increase in newly identified TCR revision intermediates that express on the cell surface both the transgene-encoded Vβ5 (at slightly reduced levels) and the revised TCRβ chains that are encoded by newly rearranged genes. It is surprising that the percentages and numbers of Vβ5lowTCRβ+ and Vβ5lowVβ8+ cells in Bim−/− Vβ5 Tg mice are very similar. It is unlikely that most revision intermediates express Vβ8; instead, the Vβ5lowTCRβ+ gate (being much less specific than the Vβ5lowVβ8+ gate) likely captures only a portion of the entire population of TCR revision intermediates. Adoptive transfer of Vβ5lowVβ8+ T cells from Bim−/− Vβ5 Tg mice clearly demonstrates the potential of these dual-TCR expressing cells to downregulate surface Vβ5 and complete TCR revision, and thus identifies them as intermediates in this process (Figure 5). However, these adoptive transfer studies do not allow us to determine what portion of transferred cells undergoes cell death while completing TCR revision. Furthermore, our data do not rule out the possibility that some of the dual-TCR expressing cells may fail to eliminate Vβ5 surface expression but escape deletion, due to ineffective interaction with self antigens mediated by lower levels of surface TCR.
TCR revision intermediates were clearly not derived from the thymus, as maturing CD4 SP thymocytes and CD4+GFP+ recent thymic emigrants did not express Vβ8. However, it is surprising that a very small proportion of Vβ5lowVβ8+ revision intermediates (those with the lowest Vβ5 surface expression) expresses GFP (data not shown). A combination of factors can explain the lack of GFP expression among revision intermediates. First, while the GFP signal accurately labels peripheral CD4+ T cells expressing RAG in thymectomized Vβ5 Tg Rag2pGFP Tg mice, Rag2 mRNA expression is very low relative to that in developing thymocytes (17). The result is a weak GFP signal among revising peripheral T cells in thymectomized Rag2pGFP Tg mice (17, 20). Furthermore, the estimated half-life of GFP in this system is approximately 56 hours (30). These factors combine to allow only a short timeframe for detecting cells that have undergone RAG expression in the periphery.
Although the signals that regulate the initiation and kinetics of TCR revision in Vβ5 Tg mice remain to be fully elucidated, previous studies have revealed that the process requires chronic interaction with Mtv-expressing cells, demonstrated by the slow appearance of post-revision CD4+Vβ5−TCRβ+ T cells in both euthymic and thymectomized mice (14, 16, 18). In vitro experiments have demonstrated that a large fraction of the peripheral CD4+ T cell population in Vβ5 Tg mice is induced to express RAG within 4 days of TCR stimulation in the presence of IL-7 and a cell cycle inhibitor (17)#, although these cells likely were provided signals in vivo that rendered them more susceptible to RAG reinduction.
Dual TCRα chains paired with a single TCRβ chain have been reported in both human (34) and mouse (35) peripheral T cells. Two TCRα chains can be expressed intracellularly, while only one is present on the cell surface. Such regulation appears to be controlled by competition between the TCRα chains based on their intrinsic affinity for the given TCRβ chain (36). In contrast, peripheral T cells expressing dual-TCRβ chains were identified in the present study. The mechanism by which Vβ5 surface expression is extinquished following the expression of the revised TCRβ chain is currently under investigation, but likely occurs through Mtv ligand mediated internalization of Vβ5, and not through loss of the Vβ5 transgene or its expression (unpublished data).
The increase in this revision intermediate cell population appears to follow the proportional increase in CD4+GFP+ revising T cells that express RAG. This implicates Bim-mediated cell death in negotiating the apoptosis of cells undergoing RAG-mediated TCR rearrangements in the periphery, perhaps during a β selection process. Recent work has demonstrated that Bim is highly upregulated in preTα−/− thymocytes, implicating a role for Bim-mediated death in the apoptosis of DN thymocytes that fail to generate a functional TCRβ chain. Further, Bim deficiency prolongs the survival of preTα−/− thymocytes (12). Thus Bim-mediated apoptosis may play a crucial role in safeguarding the developmental progression of only those thymocytes that properly undergo β selection and that do not acquire dangerous genetic lesions through RAG-mediated recombination. In consideration of this, the exaggerated frequency of TCR revision intermediates in Bim−/− Vβ5 Tg mice may imply the presence of cells bearing “useless” revised TCRβ chains or harmful genetic alterations.
It is surprising that despite the increased percent of both CD4+ revising T cells and revision intermediates, no enrichment of post-revision Vβ5−TCRβ+ cells was observed in Bim−/− Vβ5 Tg mice. The simplest explanation for this is that the Vβ5+ cells are not deleted, thus diminishing the relative representation of Vβ5− post-revision cells. A second possibility is that the high numbers of T cells in the full lymphoid environment of Bim−/− Vβ5 Tg mice prohibit any further accumulation of post-revision T cells. Attempts to address this possibility using mixed bone marrow chimeras were complicated by a very efficient engraftment of Bim−/− compared to Bim+/+ cells prior to or early in thymocyte development, which generated a lymphoid environment more similar to that of a Bim−/− than a WT mouse (data not shown). A third possibility for the failure of Bim−/− post-revision cells to accumulate at elevated frequencies may result from improper selection during TCR revision. Thus, reliance on a “useless”, non-selected revised TCR may not maintain cell survival in vivo, especially when in direct competition with Bim−/− CD4+Vβ5+ T cells that carry an Mtv-reactive TCRβ chain yet fail to undergo apoptosis. Given that Fas mutant Vβ5 Tg lpr mice and mice in which Fas is conditionally deleted in mature T cells both have an increased frequency of post-revision T cells (18 and Supplemental Fig. 2)#, cell death between the revision intermediate and post-revision stages in Bim deficient Vβ5 Tg mice may be mediated through Fas-induced apoptosis. Thus, we propose that both Bim and Fas mediated death influence TCR revision, albeit at different stages in the process.
It is currently unclear whether TCRβ rearrangement during peripheral TCR revision is accompanied by TCRα rearrangement and positive selection of a revised TCRαβ pair in Vβ5 Tg mice. WT post-revision T cells can undergo MHC class II dependent lymphopenia-induced proliferation and generate self-MHC-restricted responses to bacterial antigen (22); therefore, it is possible that Bim-mediated death may influence selection to enforce self-MHC-restriction of post-revision T cells.
In conclusion, we have determined that Bim deficiency in Vβ5 Tg mice blocks deletion of peripheral CD4+ T cells that recognize an endogenous superantigen. Furthermore, Bim influences the death versus survival fate of peripheral T cells expressing RAG and undergoing TCR revision, and Bim deficiency results in the accumulation of dual-TCR expressing cells that represent intermediates in the process of TCR revision.
Supplementary Material
Splenocytes from Vβ5 Tg and nonTg mice that were Bcl-2 Tg or Bcl-2 nonTg were stained for CD4, CD8, Vβ5, and TCRβ surface expression. (A) Representative CD8/CD4 analysis of splenocytes from 22 week old mice. The CD4:CD8 ratio is boxed in the upper right of each plot. (B) Charts indicate the absolute numbers of CD4+ splenic T cells from Bcl-2 Tg and Bcl-2 nonTg mice of the indicated age groups that were Vβ5 Tg (upper) and Vβ5 nonTg (lower). Dots represent individual mice, bars indicate the mean and error bars indicate the standard deviation. Significant p values are shown, and were calculated using an unpaired two-tailed Student’s t test.
Splenocytes from Vβ5 Tg Fasfl/fl and Vβ5 Tg Fasfl/fl dLckCre Tg mice were stained for CD4, CD8, TCRβ, Vβ5, and Fas surface expression. (A) Representative TCRβ/CD4 analysis and histogram of Fas expression by gated TCRβ+CD4+ T cells. Lower panels show representative Vβ5 expression of Fas- (left) and Fas+ (right) TCRβ+CD4+ T cells, with analysis gates marking Vβ5+ and Vβ5- populations. (B,C) Charts represent the percentage of post-revision T cells among Fas+ and Fas− TCRβ+CD4+ splenocytes from Vβ5 Tg Fasfl/fl (B) and Vβ5 Tg Fasfl/fl dLckCre Tg (C) mice of the indicated age ranges. Each line represents data from an individual mouse. P values were calculated using a paired Student’s t test.
Splenocytes from Vβ5 Tg and nonTg mice that were Bcl-2 Tg or Bcl-2 nonTg were stained for CD4, Vβ5, and TCRβ surface expression. Dots represent individual mice, bars indicate the mean, and error bars indicate the standard deviation. Significant p values are shown, and were calculated using an unpaired two-tailed Student’s t test. (A) Chart indicates the percent Vβ5− of CD4+ T cells in mice of the indicated age groups. (B) Chart indicates the percent Vβ5lowTCRβ+ of CD4+ cells in mice of the indicated age groups.
Splenocytes from Bim +/+ and Bim−/− Vβ5 Tg mice were surface stained for CD4, Vβ5, TCRβ, and Vβ8, followed by intracellular staining for Foxp3 expression. Data are representative of 4 Bim +/+ and 2 Bim−/− mice from 2 independent experiments. (A) Vβ5 and TCRβ expression by CD4+ Foxp3+ and Foxp3− T cells. Numbers in red indicate the percent that are Vβ5lowTCRβ+ (within the triangular gate). (B) Vβ5 and Vβ8 expression by CD4+ Foxp3+ and Foxp3− T cells. Numbers in red indicate the percent that are Vβ5lowVβ8 + (upper right quadrant).
Acknowledgments
The authors would like to thank Drs. Edward Clark, Philippa Marrack, Alexander Chervonsky, Nigel Killeen, and Michel Nussenzweig for providing mice.
Grant support
This work was supported by the National Institutes of Health (grant RO1 AG13078 to P.J.F), the Cancer Research Institute’s Predoctoral Emphasis Pathway in Tumor Immunology Program (to J.S.H.), and the National Cancer Institute Basic and Cancer Immunology Grant (grant T32CA09537 to J.S.H). The content is solely the responsibility of the authors and does not necessarily represent the official views of the NIH, the CRI, or the NCI.
Non-standard abbreviations
- Tg
transgenic
- nonTg
non-transgenic
- Mtv
mammary tumor virus
- WT
wild-type
- SP
single-positive
- B6
C57BL/6
- Bim
Bcl-2-interacting mediator of cell death
- Bcl-2
B-cell lymphoma 2
- Treg
regulatory T cell
- DN
double-negative
Footnotes
Disclosures
The authors declare no financial conflicts of interest.
References
- 1.Schlissel MS. Regulating antigen-receptor gene assembly. Nat Rev Immunol. 2003;3:890–899. doi: 10.1038/nri1225. [DOI] [PubMed] [Google Scholar]
- 2.Starr TK, Jameson SC, Hogquist KA. Positive and negative selection of T cells. Annu Rev Immunol. 2003;21:139–176. doi: 10.1146/annurev.immunol.21.120601.141107. [DOI] [PubMed] [Google Scholar]
- 3.Opferman JT, Korsmeyer SJ. Apoptosis in the development and maintenance of the immune system. Nat Immunol. 2003;4:410–415. doi: 10.1038/ni0503-410. [DOI] [PubMed] [Google Scholar]
- 4.Bouillet P, O’Reilly LA. CD95, BIM and T cell homeostasis. Nat Rev Immunol. 2009;9:514–519. doi: 10.1038/nri2570. [DOI] [PubMed] [Google Scholar]
- 5.Strasser A. The role of BH3-only proteins in the immune system. Nat Rev Immunol. 2005;5:189–200. doi: 10.1038/nri1568. [DOI] [PubMed] [Google Scholar]
- 6.Strasser A, Harris AW, Cory S. Bcl-2 transgene inhibits T cell death and perturbs thymic self-censorship. Cell. 1991;67:889–899. doi: 10.1016/0092-8674(91)90362-3. [DOI] [PubMed] [Google Scholar]
- 7.Strasser A, Harris AW, von Boehmer H, Cory S. Positive and negative selection of T cells in T-cell receptor transgenic mice expressing a bcl-2 transgene. Proc Natl Acad Sci USA. 1994;91:1376–1380. doi: 10.1073/pnas.91.4.1376. [DOI] [PMC free article] [PubMed] [Google Scholar]
- 8.Bouillet P, Metcalf D, Huang DC, Tarlinton DM, Kay TW, Kontgen F, Adams JM, Strasser A. Proapoptotic Bcl-2 relative Bim required for certain apoptotic responses, leukocyte homeostasis, and to preclude autoimmunity. Science. 1999;286:1735–1738. doi: 10.1126/science.286.5445.1735. [DOI] [PubMed] [Google Scholar]
- 9.Bouillet P, Purton JF, Godfrey DI, Zhang LC, Coultas L, Puthalakath H, Pellegrini M, Cory S, Adams JM, Strasser A. BH3-only Bcl-2 family member Bim is required for apoptosis of autoreactive thymocytes. Nature. 2002;415:922–926. doi: 10.1038/415922a. [DOI] [PubMed] [Google Scholar]
- 10.Liston A, Lesage S, Gray DH, O’Reilly LA, Strasser A, Fahrer AM, Boyd RL, Wilson J, Baxter AG, Gallo EM, Crabtree GR, Peng K, Wilson SR, Goodnow CC. Generalized resistance to thymic deletion in the NOD mouse; a polygenic trait characterized by defective induction of Bim. Immunity. 2004;21:817–830. doi: 10.1016/j.immuni.2004.10.014. [DOI] [PubMed] [Google Scholar]
- 11.Hamrouni A, Olsson A, Wiegers GJ, Villunger A. Impact of cellular lifespan on the T cell receptor repertoire. Eur J Immunol. 2007;37:1978–1985. doi: 10.1002/eji.200636632. [DOI] [PubMed] [Google Scholar]
- 12.Mandal M, Crusio KM, Meng F, Liu S, Kinsella M, Clark MR, Takeuchi O, Aifantis I. Regulation of lymphocyte progenitor survival by the proapoptotic activities of Bim and Bid. Proc Natl Acad Sci U S A. 2008;105:20840–20845. doi: 10.1073/pnas.0807557106. [DOI] [PMC free article] [PubMed] [Google Scholar]
- 13.Hale JS, Fink PJ. T-cell receptor revision: friend or foe? Immunology. 2010;129:467–473. doi: 10.1111/j.1365-2567.2010.03250.x. [DOI] [PMC free article] [PubMed] [Google Scholar]
- 14.Fink PJ, Swan K, Turk G, Moore MW, Carbone FR. Both intrathymic and peripheral selection modulate the differential expression of Vβ5 among CD4+ and CD8+ T cells. J Exp Med. 1992;176:1733–1738. doi: 10.1084/jem.176.6.1733. [DOI] [PMC free article] [PubMed] [Google Scholar]
- 15.Fink PJ, Fang CA, Turk GL. The induction of peripheral tolerance by the chronic activation and deletion of CD4+Vβ5+ cells. J Immunol. 1994;152:4270–4281. [PubMed] [Google Scholar]
- 16.McMahan CJ, Fink PJ. RAG reexpression and DNA recombination at T cell receptor loci in peripheral CD4+ T cells. Immunity. 1998;9:637–647. doi: 10.1016/s1074-7613(00)80661-5. [DOI] [PubMed] [Google Scholar]
- 17.Cooper CJ, Orr MT, McMahan CJ, Fink PJ. T cell receptor revision does not solely target recent thymic emigrants. J Immunol. 2003;171:226–233. doi: 10.4049/jimmunol.171.1.226. [DOI] [PubMed] [Google Scholar]
- 18.Ali M, Weinreich M, Balcaitis S, Cooper CJ, Fink PJ. Differential regulation of peripheral CD4+ T cell tolerance induced by deletion and TCR revision. J Immunol. 2003;171:6290–6296. doi: 10.4049/jimmunol.171.11.6290. [DOI] [PubMed] [Google Scholar]
- 19.Hale JS, Ames KT, Boursalian TE, Fink PJ. Cutting Edge: Rag deletion in peripheral T cells blocks TCR revision. J Immunol. 2010;184:5964–5968. doi: 10.4049/jimmunol.1000876. [DOI] [PMC free article] [PubMed] [Google Scholar]
- 20.Cooper CJ, Turk G, Sun M, Farr AG, Fink PJ. Cutting Edge: TCR revision occurs in germinal centers. J Immunol. 2004;173:6532–6536. doi: 10.4049/jimmunol.173.11.6532. [DOI] [PubMed] [Google Scholar]
- 21.McMahan CJ, Fink PJ. Receptor revision in peripheral T cells creates a diverse Vβ repertoire. J Immunol. 2000;165:6902–6907. doi: 10.4049/jimmunol.165.12.6902. [DOI] [PubMed] [Google Scholar]
- 22.Hale JS, Wubeshet M, Fink PJ. TCR revision generates functional CD4+ T cells. J Immunol. 2010 doi: 10.4049/jimmunol.1002696. In press. [DOI] [PMC free article] [PubMed] [Google Scholar]
- 23.Strasser A, Harris AW, Vaux DL, Webb E, Bath ML, Adams JM, Cory S. Abnormalities of the immune system induced by dysregulated bcl-2 expression in transgenic mice. Curr Top Microbiol Immunol. 1990;166:175–181. doi: 10.1007/978-3-642-75889-8_22. [DOI] [PubMed] [Google Scholar]
- 24.Stranges PB, Watson J, Cooper CJ, Choisy-Rossi CM, Stonebraker AC, Beighton RA, Hartig H, Sundberg JP, Servick S, Kaufmann G, Fink PJ, Chervonsky AV. Elimination of antigen-presenting cells and autoreactive T cells by Fas contributes to prevention of autoimmunity. Immunity. 2007;26:629–641. doi: 10.1016/j.immuni.2007.03.016. [DOI] [PMC free article] [PubMed] [Google Scholar]
- 25.Zhang DJ, Wang Q, Wei J, Baimukanova G, Buchholz F, Stewart AF, Mao X, Killeen N. Selective expression of the Cre recombinase in late-stage thymocytes using the distal promoter of the Lck gene. J Immunol. 2005;174:6725–6731. doi: 10.4049/jimmunol.174.11.6725. [DOI] [PubMed] [Google Scholar]
- 26.Yu W, Nagaoka H, Jankovic M, Misulovin Z, Suh H, Rolink A, Melchers F, Meffre E, Nussenzweig MC. Continued RAG expression in late stages of B cell development and no apparent re-induction after immunization. Nature. 1999;400:682–687. doi: 10.1038/23287. [DOI] [PubMed] [Google Scholar]
- 27.Boursalian TE, Golub J, Soper DM, Cooper CJ, Fink PJ. Continued maturation of thymic emigrants in the periphery. Nat Immunol. 2004;5:418–425. doi: 10.1038/ni1049. [DOI] [PubMed] [Google Scholar]
- 28.Hale JS, Boursalian TE, Turk GL, Fink PJ. Thymic output in aged mice. Proc Natl Acad Sci USA. 2006;103:8447–8452. doi: 10.1073/pnas.0601040103. [DOI] [PMC free article] [PubMed] [Google Scholar]
- 29.Hale JS, Fink PJ. Back to the thymus: peripheral T cells come home. Immunol Cell Biol. 2009;87:58–64. doi: 10.1038/icb.2008.87. [DOI] [PMC free article] [PubMed] [Google Scholar]
- 30.McCaughtry TM, Wilden MS, Hogquist KA. Thymic emigration revisited. J Exp Med. 2007;204:2513–2520. doi: 10.1084/jem.20070601. [DOI] [PMC free article] [PubMed] [Google Scholar]
- 31.Zehn D, Bevan MJ, Fink PJ. Cutting edge: TCR revision affects predominantly Foxp3 cells and skews them toward the Th17 lineage. J Immunol. 2007;179:5653–5657. doi: 10.4049/jimmunol.179.9.5653. [DOI] [PMC free article] [PubMed] [Google Scholar]
- 32.Strasser A, Bouillet P. The control of apoptosis in lymphocyte selection. Immunol Rev. 2003;193:82–92. doi: 10.1034/j.1600-065x.2003.00036.x. [DOI] [PubMed] [Google Scholar]
- 33.Sohn SJ, Thompson J, Winoto A. Apoptosis during negative selection of autoreactive thymocytes. Curr Opin Immunol. 2007;19:510–515. doi: 10.1016/j.coi.2007.06.001. [DOI] [PubMed] [Google Scholar]
- 34.Padovan E, Casorati G, Dellabona P, Meyer S, Brockhaus M, Lanzavecchia A. Expression of two T cell receptor alpha chains: dual receptor T cells. Science. 1993;262:422–424. doi: 10.1126/science.8211163. [DOI] [PubMed] [Google Scholar]
- 35.Heath WR, Carbone FR, Bertolino P, Kelly J, Cose S, Miller JF. Expression of two T cell receptor α chains on the surface of normal murine T cells. Eur J Immunol. 1995;25:1617–1623. doi: 10.1002/eji.1830250622. [DOI] [PubMed] [Google Scholar]
- 36.Alam SM, Gascoigne NR. Posttranslational regulation of TCR Vα allelic exclusion during T cell differentiation. J Immunol. 1998;160:3883–3890. [PubMed] [Google Scholar]
Associated Data
This section collects any data citations, data availability statements, or supplementary materials included in this article.
Supplementary Materials
Splenocytes from Vβ5 Tg and nonTg mice that were Bcl-2 Tg or Bcl-2 nonTg were stained for CD4, CD8, Vβ5, and TCRβ surface expression. (A) Representative CD8/CD4 analysis of splenocytes from 22 week old mice. The CD4:CD8 ratio is boxed in the upper right of each plot. (B) Charts indicate the absolute numbers of CD4+ splenic T cells from Bcl-2 Tg and Bcl-2 nonTg mice of the indicated age groups that were Vβ5 Tg (upper) and Vβ5 nonTg (lower). Dots represent individual mice, bars indicate the mean and error bars indicate the standard deviation. Significant p values are shown, and were calculated using an unpaired two-tailed Student’s t test.
Splenocytes from Vβ5 Tg Fasfl/fl and Vβ5 Tg Fasfl/fl dLckCre Tg mice were stained for CD4, CD8, TCRβ, Vβ5, and Fas surface expression. (A) Representative TCRβ/CD4 analysis and histogram of Fas expression by gated TCRβ+CD4+ T cells. Lower panels show representative Vβ5 expression of Fas- (left) and Fas+ (right) TCRβ+CD4+ T cells, with analysis gates marking Vβ5+ and Vβ5- populations. (B,C) Charts represent the percentage of post-revision T cells among Fas+ and Fas− TCRβ+CD4+ splenocytes from Vβ5 Tg Fasfl/fl (B) and Vβ5 Tg Fasfl/fl dLckCre Tg (C) mice of the indicated age ranges. Each line represents data from an individual mouse. P values were calculated using a paired Student’s t test.
Splenocytes from Vβ5 Tg and nonTg mice that were Bcl-2 Tg or Bcl-2 nonTg were stained for CD4, Vβ5, and TCRβ surface expression. Dots represent individual mice, bars indicate the mean, and error bars indicate the standard deviation. Significant p values are shown, and were calculated using an unpaired two-tailed Student’s t test. (A) Chart indicates the percent Vβ5− of CD4+ T cells in mice of the indicated age groups. (B) Chart indicates the percent Vβ5lowTCRβ+ of CD4+ cells in mice of the indicated age groups.
Splenocytes from Bim +/+ and Bim−/− Vβ5 Tg mice were surface stained for CD4, Vβ5, TCRβ, and Vβ8, followed by intracellular staining for Foxp3 expression. Data are representative of 4 Bim +/+ and 2 Bim−/− mice from 2 independent experiments. (A) Vβ5 and TCRβ expression by CD4+ Foxp3+ and Foxp3− T cells. Numbers in red indicate the percent that are Vβ5lowTCRβ+ (within the triangular gate). (B) Vβ5 and Vβ8 expression by CD4+ Foxp3+ and Foxp3− T cells. Numbers in red indicate the percent that are Vβ5lowVβ8 + (upper right quadrant).