

Abstract
Although structurally very similar, the aspartate transcarbamoylases (ATCase) of Serratia marcescens and Escherichia coli have distinct allosteric regulatory patterns. It has been reported that a S. marcescens chimera, SM : rS5′ec, in which five divergent residues (r93 to r97) of the regulatory polypeptide were replaced with their Escherichia coli counterparts, possessed E. coli-like regulatory characteristics. T he reverse chimera EC : rS5′sm, in which the same five residues of E. coli have been replaced with their S. marcescens counterpart, lost both heterotrophic and homotropic responses. These results indicate that the r93-r97 region is critical in defining the ATCase allosteric character. Molecular modeling of the regulatory polypeptides has suggested that the replacement of the S5′ β-strand resulted in disruption of the allosteric-zinc interface. However, the structure-function relationship could be indirect, and the disruption of the interface could influence allostery by altering the global energy of the enzyme. Studies of the temperature-sensitivity of the CTP response demonstrate that it is possible to convert CTP inhibition of the SM : rS5′ec chimera at high temperature to activation below 10 °C. Nonetheless, the temperature response of the native S. marcescens ATCase suggests a strong entropic effect that counteracts the CTP activation. Therefore, it is suggested that the entropy component of the coupling free energy plays a significant role in the determination of both the nature and magnitude of the allosteric effect in ATCase.
Keywords: ATCase, allostery, temperature effect, structure-function relationship
Introduction
Aspartate transcarbamoylase (EC 2.1.3.2; ATCase) catalyzes the condensation of L-aspartate with carbamoyl phosphate to form carbamoylaspartate and phosphate, ultimately leading to the pyrimidine end products UTP and CTP (Jones et al., 1955; Reichard & Hanshoff, 1956; Wild et al., 1989). The holoenzyme is composed of two catalytic subunits and three regulatory subunits (2c3:3r2). Three catalytic polypeptides associate to form a functional catalytic subunit (trimer, c3) and two regulatory polypeptides form a regulatory subunit (dimer, r2; Figure 1). Each of the catalytic polypeptides folds into a carbamoyl phosphate-binding domain (CP domain, c1 to c150) and an aspartate-binding domain (Asp domain, c155 to c290), while each regulatory polypeptide is folded into an allosteric effector-binding domain (Allo domain, r1 to r100) and a zinc-binding domain (Zn domain, r105 to r146). The active sites are located at the interfaces of the Asp and CP domains of the catalytic trimers, positioned 60 Å away from the nucleotide-binding sites, which are located adjacent to the five-stranded β-sheets of the Allo domains and directly linked to the Zn domains through the S5′ β-strand (Figure 2). The structures of the Escherichia coli ATCase complexed with substrate analogues and/or allosteric effectors have been characterized by X-ray crystallography (Lipscomb, 1994).
Figure 1.
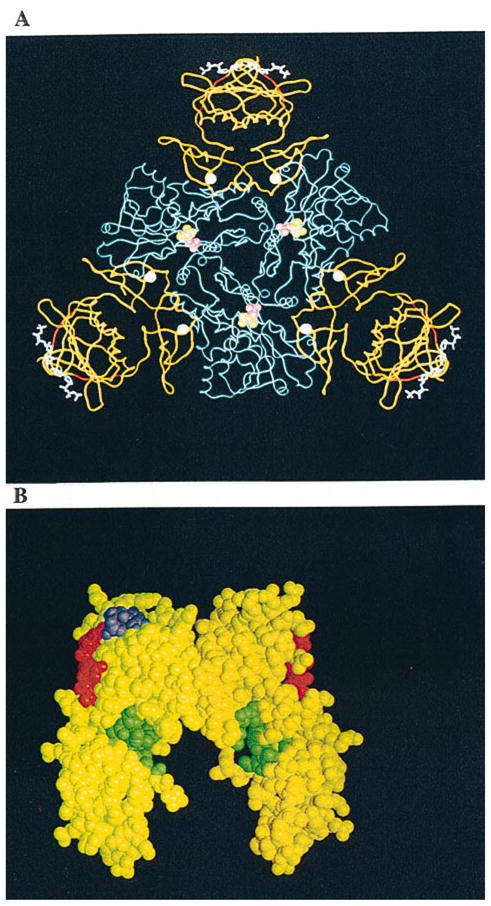
A, A molecular graphic representation of a CTP-liganded R-state holoenzyme of ATCase from E. coli. The holoenzyme is composed of two catalytic trimers (one trimer is shown in blue while the second is located beneath this trimer and not shown here for the purpose of simplification) and three regulatory dimers (in yellow). The nucleotide effector CTP (in white sticks and purple balls) binds to the allosteric domain and exerts its effect through the zinc domain (six zinc atoms are indicated as white balls) to the catalytic sites 60 Å away (the catalytic site lies between the Asp and CP domains of each catalytic monomer and is defined by the substrate analogs phosphonoacetamide (purple balls) and malonate (yellow balls)). The substituted regions (r93 to r97, red ribbon) are located at the junction between the allosteric binding sites and catalytic sites. B, A space-filled model of a regulatory dimer is shown in yellow. The altered S5′ β-strand regions (r93 to r97) are shown in red; the CTP nucleotide effectors in purple occupy the allosteric binding site; and the hydrophobic pockets (green) are located at the interface of the allosteric and zinc domains. All atomic coordinates are originally from file 8at1.full in the Protein Data Bank supplied by Gouaux et al. (1990).
Figure 2.
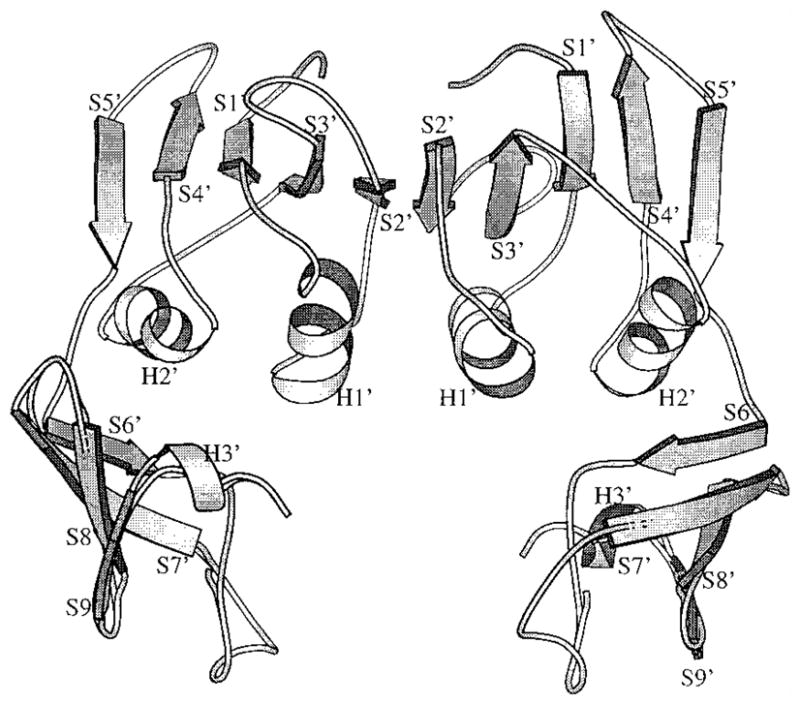
A cartoon showing the secondary structure in a regulatory dimer. The α-helices are labeled with H1′, H2I or H3′ and the β-sheets are labeled S1′ to S9′. The altered S5′ β-strand regions (r93 to r97) connects the allosteric domain to the zinc domain. All atomic coordinates are originally from file 4at1 in the Protein Data Bank supplied by Stevens et al. (1990).
When substrate ligands bind to the native E. coli ATCase, there is a conformational change from a less active “T-state” to the more active, open “R-state” (Schachman, 1988; Changeux & Rubin, 1968; Howlett & Schachman, 1977). As the T to R transition occurs, the catalytic trimers move apart by 12 Å, and the catalytic and regulatory subunits rotate 10° and 15° about their axes of symmetry, respectively (Krause et al., 1987). The allosteric : zinc interface opens 2 to 3 Å in the T to R transition (Ke et al., 1988; Gouaux et al., 1990). The hydrophobic region located at the allosteric : zinc interface has been proposed to be important in mediation of the allosteric signal (Van Vliet et al., 1991; Xi et al., 1994).
The ATCase from Serratia marcescens has the same dodecameric structure, 2c3 : 3r2, as theE. coli enzyme and shares 85% and 76% amino acid identity within their catalytic and regulatory polypeptides, respectively (Beck et al., 1989; Liu et al., 1997). Most of the residues involved in the nucleotide-binding sites and all inter- and intra-subunit interfaces (r1 : c1, r1 : c4, r1 : r6 and Allo : Zn) are conserved between the two enzymes (Gouaux et al., 1990; Beck et al., 1989). In spite of these structural similarities, the two enzymes differ in both regulatory and catalytic characteristics. Most notably, CTP activates the catalytic activity of the S. marcescens ATCase and the CTP + UTP inhibitory synergism is lost. This allosteric pattern is contrary to the traditional logic of the E. coli ATCase, where CTP feedback inhibits 50 to 60% of the catalytic activity of the enzyme, and the combination of CTP and UTP inhibits 90 to 95% (Wild et al., 1988). A hybrid ATCase assembled in vivo with the catalytic subunits from E. coli and the regulatory subunits from S. marcescens (Cec : Rsm) exhibited heterotropic responses characteristic of the native S. marcescens holoenzyme (Beck et al., 1989). In contrast, the reverse hybrid enzyme (Csm : Rec), utilizing the S. marcescens catalytic subunits and the E. coli regulatory subunits, exhibited the heterotropic responses characteristic of E. coli (Shanley et al., 1984; Beck et al., 1989). These hybrids, along with other inter-species hybrids, have verified the hypothesis that the allosteric responses of the ATCase holoenzyme are determined exclusively by the controlling regulatory subunits (Foltermann et al., 1986; Wild & Wales, 1990).
The structural similarity and the functional divergence of these two enzymes provides an opportunity to directly address the role of specific structural regions in allosteric regulation. T he most divergent regions are located at the minor r1 : c1 interface (r130 region) and the Zn : Allo domain junction (r100 region; Beck et al., 1989; Wild et al., 1991; Wild & Wales, 1990). A chimeric enzyme, SM : rS5′ec, was constructed in which the S5′ β-strand of the S. marcescens enzyme was replaced with that of the E. coli enzyme. The resulting chimeric ATCase displays an allosteric pattern similar to that of the native E. coli enzyme (ATP activation, CTP inhibition, and CTP + UTP synergistic inhibition). These results suggested that the non-conserved residues r93 to r97 are critical to defining the diverged allosteric function, and that the nature of the allosteric response is directly modulated by this region (Liu et al., 1997).
In this study, a similar chimera, EC : rS5′sm, has been constructed in which the S5′ β-strand of the E. coli enzyme was replaced by that of the S. marcescens enzyme. The resulting enzyme is insensitive to any of the allosteric effectors. These studies suggest that the allosteric regulatory pattern is not directly related to structural alterations, but rather is thermodynamically described by the coupling free energy. Under isothermal conditions, the coupling free energy can be partitioned into the enthalpy (ΔHax) and entropy (TΔSax) terms (Wyman, 1964; Weber, 1972, 1975; Reinhart et al., 1989; Braxton et al., 1994). The temperature-driven conversion of the CTP effect of the SM : rS5′ec enzyme reported here suggests that the entropy component of the coupling free energy plays a significant role in the determination of both nature and magnitude of the allosteric effect in ATCase.
Results
Kinetic and allosteric evaluation of the EC : rS5′sm chimeric enzyme
The E C : rS5′sm chimera, generated by replacing the S5′ β-strand of E. coli with the S. marcescens sequence, has an [Asp]0.5 value similar to that of the SM : rS5′ec chimera (4.7 mM; Liu et al., 1997) and smaller than that of either native enzyme (E. coli 16 mM; S. marcescens 39 mM). The homotropic cooperativity of this chimeric enzyme is eliminated and the Hill coefficient (nH) value is close to unity (1.3 to 1.5) even in the presence of the different nucleotide effectors. The maximum reaction velocities at saturating concentrations of substrate (Vmax) were similar to that of the other three enzymes and did not change much in the presence of nucleotide effectors. This differs from the pattern observed for the parent E. coli enzyme, whose Vmax is significantly reduced in the presence of CTP and CTP plus UTP (Table 1).
Table 1.
Kinetic parameters of the native and chimeric ATCase at 30°C
| Nucleotide effectora | ||||||
|---|---|---|---|---|---|---|
| None | ATP | CTP | UTP | C + U | ||
| [Asp]0.5b | Native S. marcescens | 39.2 ± 0.3 | 17.7 ± 3.7 | 22.0 ± 1.8 | 41.0 ± 3.1 | 25.7 ± 1.0 |
| Native E. coli | 16.6 ± 1.4 | 9.9 ± 1.9 | 27.3 ± 2.0 | 15.4 ± 2.7 | 31.8 ± 2.0 | |
| SM : rS5′ec | 4.7 ± 0.1 | 2.8 ± 0.1 | 9.0 ± 0.4 | 4.6 ± 0.1 | 12.0 ± 1.2 | |
| EC : rS5′sm | 6.1 ± 0.6 | 6.4 ± 0.3 | 5.9 ± 0.2 | 5.8 ± 0.4 | 6.1 ± 0.1 | |
| Vmaxc | Native S. marcescens | 22.4 ± 0.5 | 25.6 ± 1.2 | 25.0 ± 0.4 | 23.1 ± 0.6 | 30.2 ± 0.4 |
| Native E. coli | 24.9 ± 1.2 | 24.8 ± 0.6 | 18.9 ± 1.9 | 25.1 ± 0.2 | 16.7 ± 0.5 | |
| SM : rS5′ec | 18.5 ± 1.1 | 25.0 ± 0.6 | 25.5 ± 0.3 | 25.9 ± 0.4 | 23.8 ± 0.5 | |
| EC : rS5′sm | 22.4 ± 2.1 | 22.1 ± 1.7 | 21.9 ± 0.7 | 21.5 ± 1.1 | 21.8 ± 1.3 | |
| nHd | Native S. marcescens | 1.9 ± 0.1 | 2.5 ± 0.1 | 2.7 ± 0.1 | 2.2 ± 0.1 | 2.2 ± 0.1 |
| Native E. coli | 3.2 ± 0.1 | 2.5 ± 0.3 | 3.7 ± 0.5 | 3.1 ± 0.3 | 3.1 ± 0.2 | |
| SM : rS5′ec | 2.1 ± 0.1 | 1.5 ± 0.1 | 2.5 ± 0.2 | 2.2 ± 0.1 | 2.2 ± 0.1 | |
| EC : rS5′sm | 1.4 ± 0.1 | 1.3 ± 0.2 | 1.5 ± 0.0 | 1.5 ± 0.1 | 1.3 ± 0.1 | |
All assays were carried out in Tripartate buffer (pH 8.3). Values for the native enzymes and SM : rS5′ec chimera have been reported (Liu et al., 1997).
The values of Vmax, [Asp]0.5 and nH were determined at nucleotide effector concentration of 2 mM. The single exception was ATP, which was 4 mM in the assays with the native S. marcescens holoenzyme.
Concentration of aspartate (mM) required to produce half-maximal velocity.
Maximal velocity, estimated at saturating concentrations of substrate, given as μmole per hour per μg.
Hill coefficient estimated from aspartate saturation kinetics using the Hill plot.
The coupling free energy (ΔG) of allosteric ligand binding is defined as the energy difference between the enzyme-substrate complex and the enzyme-substrate complex bound with nucleotide effector. An activator, such as ATP for the native E. coli enzyme, reduces the free energy level of the enzyme-substrate complex and stabilizes the ternary complex, as indicated by negative ΔG values. An inhibitor, such as CTP for the native E. coli enzyme, enhances the free energy level of the enzyme-substrate complex and destabilizes the complex, thus exhibiting positive ΔG values. The coupling free energy (ΔG) of the EC : rS5′sm enzyme between aspartate and any one of the nucleotide effectors is near zero at 30°C (Table 2 and Figure 3).
Table 2.
Thermodynamic parameters of the native and chimeric ATCase at 30°C
| CTP | ATP | UTP | C + U | |||||
|---|---|---|---|---|---|---|---|---|
| ΔGa (kcal/mol) | ΔGb (kcal/mol) | ΔHb (kcal/mol) | ΔSb (kcal/molK) | TΔSb (kcal/mol) | ΔGa (kcal/mol) | ΔGa (kcal/mol) | ΔGa (kcal/mol) | |
| Native S. marcescens | −0.34 | −0.25 | +2.56 | +9.28 | +2.81 | −0.47 | −0.03 | −0.25 |
| Native E. coli | +0.29 | +0.28 | +0.57 | +0.63 | +0.19 | −0.31 | −0.04 | +0.38 |
| SM : rS5′ec | +0.38 | +0.43 | −7.15 | −25.00 | −7.58 | −0.31 | −0.01 | +0.55 |
| EC : rS5′sm | −0.01 | +0.04 | −1.91 | −6.44 | −1.95 | +0.03 | −0.03 | 0.00 |
Figure 3.

A diagram of sequence composition of the regulatory polypeptide of the native and chimeric enzymes and their coupling free energies between nucleotide effectors and substrate aspartate. The open boxes represent the E. coli sequence and the gray represents the S. marcescens sequence; the amino acid sequence of the corresponding r93 to r97 region is indicated within each box. The coupling free energies are determined using the equation: ΔGax = −1.3616 log(Qax), where Qax is the ratio of [Asp]0.5 in the absence of nucleotide effector to that in the presence of saturating concentration of nucleotide effector: ATP, CTP, UTP and CTP + UTP.
Molecular modeling of the native and chimeric enzymes
When the backbones of the regulatory chains of all four enzymes were superimposed (Figure 4A), it was observed that the region from r1 to r32 was almost perfectly aligned. Between residues r33 and r82, the modeled native E. coli enzyme structure possessed a backbone trace distinct from the other three enzymes. In the proximity of residue r66, the EC : rS5′sm model diverged from the two S. marcescens enzymes and merged with the native E. coli enzyme at r82. From r82 of the allosteric domain into the zinc domain, the native E. coli and the chimeric EC : rS5′sm enzymes superimposed (Figure 4B). The native S. marcescens enzyme and the chimeric SM : rS5′ec enzymes superimposed along their entire length (Figure 4C).
Figure 4.
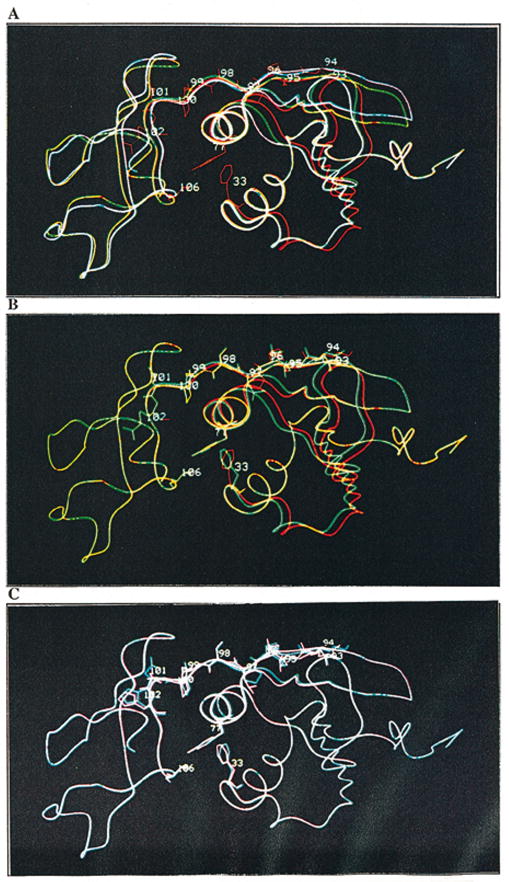
The modeled structures of the regulatory polypeptides of the native E. coli (in red), native S. marcescens (in purple), chimera SM : rS5′ec (in blue) and EC : rS5′sm (in green) enzymes display the overlapping and separation of the backbones and the relocation of the side-chains. A, The superimposed regulatory polypeptides of the four enzymes; B, The superimposed regulatory polypeptides of the native E. coli (in red) and EC : rS5′sm chimera (in green); and C, the superimposed regulatory polypeptides of the native S. marcescens (in purple) and SM : rS5′ec chimera (in blue) enzymes.
The native E. coli and SM : rS5′ec chimera, both containing the E. coli S5′ β-strand, appear to have several structural features in common: (1) constriction of the H2′ helix resulting in Tyr r77 being retracted from the hydrophobic pocket; (2) tight packing of the S4′ β-strand with the S5′ β-strand, resulting in a structural shift of the S3′ and S2′ β-strands and the H1′ α-helix; (3) these strand movements resulted in Phe r33 assuming a similar position in the two modeled structures; and (4) the side-chains in the r98-r103 region were rearranged substantially. These structural descriptions are relative to the native S. marcescens and EC : rS5′sm chimera, both of which have the S. marcescens S5′ β-strand.
Temperature effect on the CTP allosteric regulation
The aspartate saturation curves of four enzymes in the absence or presence of saturating concentration of CTP at different temperatures are presented in Figure 5. The influences of CTP on the [Asp]0.5 values of the native S. marcescens or SM : rS5′ec chimera at different temperatures are summarized in Figure 6. The van’t Hoff plots of the four enzymes are shown in Figure 7.
Figure 5.

The aspartate saturation curves of native S. marcescens (A to D), SM:rS5′ec chimera (E to H), native E. coli (I to L) and EC:rS5′sm chimera (M to P) enzymes in the absence (●) and presence (○) of saturating concentration of CTP and at different temperatures. Although these assays were performed in the presence of various concentrations of CTP at each temperature, only the assays with maximum effect are shown here. The CTP concentrations for the native S. marcescens enzyme is 0.5 mM at 0°C and 10°C, 2 mM at 3 °C0 and 5 mM at 4 °C;0 for the native E. coli enzyme and the EC:rS5′sm chimera, 2 mM at 0 °C, 10°C, 30°C and 40°C.
Figure 6.
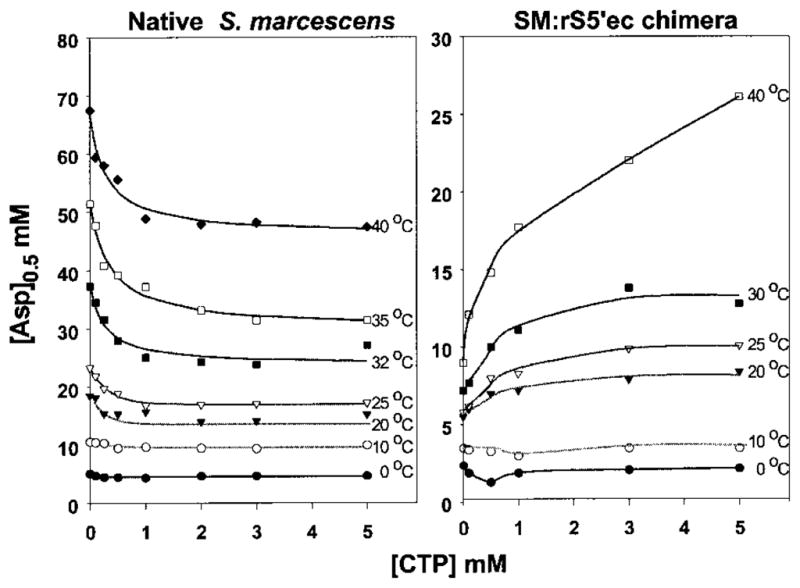
The temperature effects on the [Asp]0.5 of native S. marcescens and SM : rS5′ec chimera in the presence of various concentrations of CTP.
Figure 7.
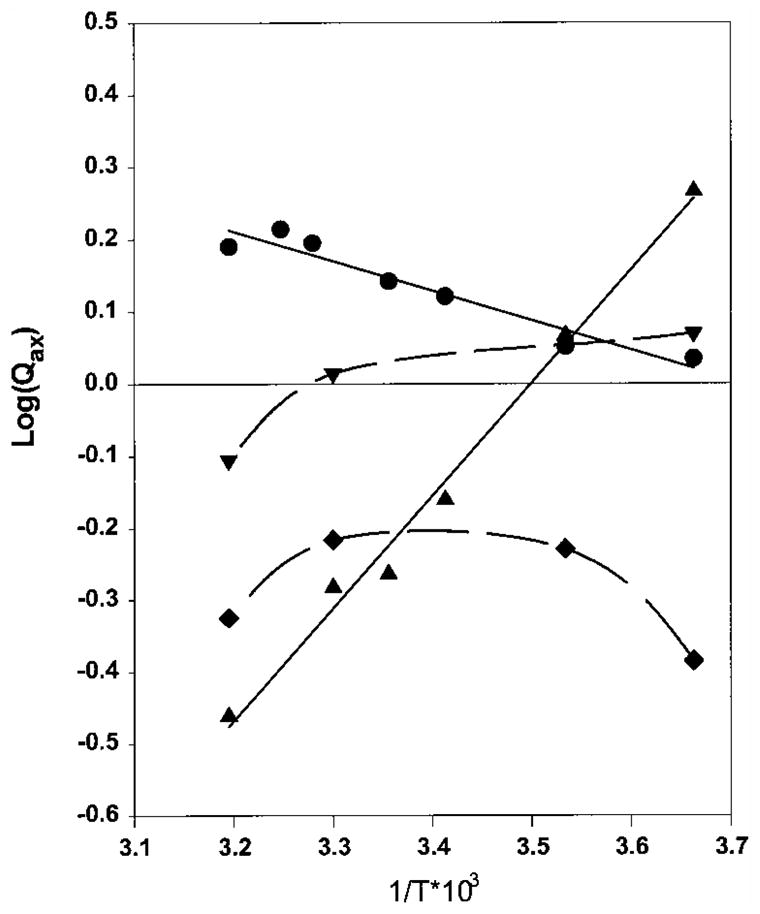
The effect of temperature on Qax for the CTP-aspartate interaction of the native E. coli (◆), S. marcescens (●), SM : rS5′ec chimera (▲) and EC : rS5′sm chimera (▼), presented as a plot of log(Qax) versus reciprocal temperature expressed in Kelvin. The broken lines are smoothed connecting lines between different temperatures and the continuous lines are the best-fit linear regression lines. The points above the line of log(Qax) = 0 indicate activation and those under the line, inhibition.
The native S. marcescens enzyme was strongly activated by CTP at high temperatures, as indicated by the significant reduction of the [Asp] 0.5 value and a large positive value of log(Qax). This activation was progressively reduced with decreasing temperature until there was no significant effect at 0°C (Figures 5A to D, 6 and 7). The SM : rS5′ec chimera exhibited the reverse of this trend: the enzyme was strongly inhibited by CTP at high temperature and decreasing the temperature reduced the inhibition. Below 10°C, the CTP inhibition converted to slight activation, especially at low concentrations of CTP (Figures 5E to H, 6 and 7). The EC : rS5′sm chimera exhibited a similar pattern: weak inhibition by CTP at high temperature converting to weak activation by CTP at low temperature (Figures 5I to L and 7). While the native E. coli enzyme remained inhibited by CTP at all temperatures tested, it appeared that the inhibition became stronger at both ends of the temperature range tested (Figures 5M to P and 7).
The van’t Hoff plot can be used to partition the enthalpy (ΔH) and entropy (TΔS) terms of the CTP coupling free energy (ΔG), provided that the enthalpy (ΔH) term remains relatively constant. Both the native S. marcescens and SM : rS5′ec chimera exhibited a linear relationship (r2 > 0.99) between the log(Qax) and the reciprocal of temperature in Kelvin (1/T). With the assumption that enthalpy remains constant within the temperature range of the experiment, two terms of the free energy can be partitioned under isothermal conditions (Table 2). The coupling free energies originate from small imbalances between the enthalpy and entropy terms. The native S. marcescens enzyme has positive enthalpy, thus CTP demonstrated the potential for inhibiting the enzyme if not balanced by entropy. The SM : rS5′ec chimera enzyme has a significant negative value of enthalpy (−7.15 kcal/mol), but its entropy term is altered dramatically with temperature (−25 cal/mol/k). This enables the allosteric effector CTP to convert from an inhibitor to an activator of the enzyme. The two terms for the EC : rS5′sm chimera are very close at 30°C and the coupling free energy changes with temperature (although not as significantly as the SM : rS5′ec enzyme). The data of the native E. coli enzyme and the EC : rS5′sm are poorly described by the linear equation (Figure 6). Even though the calculated ΔG is very close to the experimentally determined value, the entropy and enthalpy partition of the native E. coli enzyme and the EC : rS5′sm chimera in Table 2 are not reliable.
Discussion
Substitution of the S5′ β-strand alters the allosteric regulation
The native E. coli and S. marcescens enzymes have the same dodecameric structure and share strong sequence similarity (Beck et al., 1989; Liu et al., 1997). The observation that structurally important regions are usually highly conserved has led to the prediction that functional differences will originate within the non-conserved regions (Wild & Wales, 1990; Wales et al., 1993). While a high frequency of base variation has been observed in the r100 and r130 region (Beck et al.,1989; Liu et al., 1997), the most significant divergence lies within the S5′ β-strand of the regulatory polypeptide.
Substitution of the S5′ β-strand of the S. marcescens regulatory polypeptide with the E. coli sequence generated a chimera, SM : rS5′ec, with the E. coli regulatory pattern: CTP was converted form a strong activator to a strong inhibitor, and the CTP/UTP synergistic inhibition was restored. At the same time, the CTP activation was significantly attenuated (Liu et al., 1997). The reverse substitution, replacement of the S5′ β-strand of the native E. coli enzyme with the S. marcescens sequence, generated the chimera EC : rS5′sm. This enzyme retained the Vmax of the native enzyme but was completely desensitized to all allosteric ligands, and the homotropic cooperativity of the parental E. coli enzyme was lost.
Substitution of the S5′ β-strand affects the allosteric-zinc interface
The critical signal transduction nature of the allosteric-zinc interface has been suggested by crystallographic studies and demonstrated by site-directed mutagenesis. Hybrid enzymes made with E. coli regulatory dimers and catalytic trimers from different species always assume the regulatory pattern of E. coli; the reverse situation is true also. Thus the nature of the allosteric response is determined by the regulatory dimer. The allosteric-zinc interface is contained completely within the regulatory dimer and does not make physical contact with the catalytic subunits. Crystallographic studies have indicated that this interface undergoes significant change during the T to R transition as the H1′ α-helix shifts along the helical axis (Gouaux et al., 1990) and induces a significant relocation of Phe r33 within the interface. Additionally, site-directed mutagenesis studies have directly implicated this interface in the allosteric modulation. The mutation of Tyr r77 to Phe (Van Vliet et al., 1991) and Val r106 to Ala (Xi et al., 1994) converted ATP activation into slight inhibition. If there is a pathway for the signal transduction, the allosteric regulatory signal must be transmitted from the allosteric domain to the zinc domain through the allosteric-zinc interface (Van Vliet et al., 1991; Lipscomb, 1994; Xi et al., 1994).
Molecular modeling of the four enzymes in this study indicated that the allosteric-zinc interface of the native E. coli enzyme is more open than that of the S. marcescens enzyme. Substitution of the S5′ β-strand of the native S. marcescens enzyme with the E. coli sequence would appear to lead to the structural re-orientations described in Results. However, the most significant effect may be the opening of the interface between the allosteric and zinc domain. In support of this idea, the SM : rS5′ec chimera appears to have adopted both the E. coli allosteric regulatory pattern and a more open allosteric-zinc interface. These results suggest that the S5′ β-strand modulates the allosteric character of the enzyme by propagating its structural effect through the allosteric-zinc interface. However, the effects of the reverse replacement in theE. coli background were not entirely consistent with this structure-function correlation. The structural effect does appear to be predictable, since replacing the S5′ β-strand of the native E. coli enzyme with S. marcescens sequence (EC : rS5′sm) resulted in the adoption of a closer interaction between the allosteric and zinc domains in the modeling studies (Figure 4). Even though the EC : rS5′sm chimera appeared to have adopted the more closed nature of the S. marcescens allosteric-zinc interface, the mutation eliminated all homotropic and heterotropic cooperativities. Although a specific structural cause for the different functional outcomes cannot be eliminated, the relationship between the allosteric effect and structure modification could be more global and indirect. This hypothesis is supported by the sensitivity of the allosteric response to temperature, suggesting that the allosteric regulatory pattern of these enzymes may be defined by the global energy level rather than discrete pathway elements. This is consistent with previous studies, which propose a role for quaternary state stabilization in heterotropic regulation. In these studies, the presence of an R-state stabilizing mutation compensated for the extra T-state stabilization of a second site mutation, supporting the notion that these mutations shift the global free energy state of the molecule (Aucoin et al., 1996).
Structure and allosteric regulation are bridged by the coupling free energy
Based on the concept of thermodynamic linkage, the coupling free energy between the substrate aspartate and an allosteric ligand can be measured directly from the ratio of [Asp]0.5 of the unliganded enzyme to the [Asp]0.5 in the presence of saturating concentrations of allosteric ligand (CTP), provided that either the substrate or the allosteric ligand achieves rapid binding equilibrium in the steady state. The nature and magnitude of the allosteric effect originates from small thermodynamic imbalances between the enthalpy (ΔHax) and entropy (ΔSax). As such, even a modest perturbation of either enthalpy or entropy could influence the allosteric regulation (Wyman, 1964; Weber, 1972, 1975; Reinhart et al., 1989; Braxton et al., 1994, 1996).
The enthalpy component of free energy is primarily determined by the three-dimensional structure of the protein. Consequently, each enzyme has a unique enthalpy under isothermal conditions due to its unique structure. In contrast, entropy would increase with increasing temperature and may be as important to the net allosteric effect as enthalpy. With the assumption that the heat capacity of the enzyme is constant over the temperature range tested, the coupling free energy will vary as the temperature varies. For this reason, it is possible that the effect of ligand can be reversed or eliminated simply by temperature changes. The studies reported here describe several examples of such temperature-dependent changes of ATCase: (1) the temperature-driven conversion of CTP from an inhibitor to an activator with the SM : rS5′ec chimera; (2) the desensitization of the native S. marcescens enzyme to CTP at low temperatures; and (3) the enhanced CTP allosteric effect in the EC : rS5′sm chimera serving as an inhibitor at low temperature and an activator at high temperatures. The change in energy required for modification of substrate affinity is so small that the changes need not involve any substantial structural modification. In contrast, changes in entropy due to events such as hydrophobic displacement or intermolecular vibration upon ligand binding are certainly large enough to significantly alter the substrate affinity.
The failure of native E. coli enzyme and the EC : rS5′sm chimera to exhibit a linear relationship between log(Qax) and 1/T suggests that the simplifying assumptions may not be valid for these enzymes. This deviation may originate from either heat capacity variation or, more likely, failure to meet the rapid equilibrium assumption. In folding studies with other proteins, heat capacity changes have been shown to be linearly correlated with protein surface exposed to solvent (Myers et al., 1995). In fact, changes in solvent-accessibility have been observed for the E. coli ATCase during the T to R transition as monitored by tritium exchange (Lennick & Allewell, 1981). This indicates that the different structural conformations of the E. coli enzyme do have the potential to influence the heat capacity of the enzyme (Allewell & LiCata, 1995). On the basis of equilibrium isotope exchange studies, Wedler et al. (1995) proposed a mechanism for the binding of substrate to the E. coli native ATCase in which domain closure and aspartate dissociation are the rate-limiting processes. If correct, this would violate the rapid equilibrium assumption, which states that catalysis must be the rate-limiting step and provide an explanation for the curvature of the van’t Hoff plots of the E. coli enzymes. Extension of these considerations would imply that the S. marcescens enzymes may have different equilibrium kinetics or structural dynamics associated with these diverged enzymatic characters. Additional studies must be done to verify this.
Materials and Methods
Materials
Carbamoyl phosphate (lithium salt), L-aspartate, Mes (2-[N-morpholino]ethanesulfonic acid), N-ethyl-morpholine and diethanolamine were purchased from Sigma. ATP, CTP and UTP were purchased from USB. Primers and restriction enzymes were purchased from GIBCO-BRL. Other DNA-modifying enzymes were purchased from Pharmacia Biotech.
E. coli strain U39a (ara, thi, Δ(pro-lac), ΔpyrB, rpsl, strA, rnb) was used for the preparation of template DNA for mutagenesis. E. coli strain BMH71-18mutS (thi supE Δ(lac-proAB) [mutS::Tn10][F′ ProAB lacIqZΔM15]; Clontech) was used for the initial transformation following primer extension. E. coli strain, EK1104 (ara, Δpro-lac, strA, thi, pyrBI, pyrF±, rpsL; Nowlan & Kantrowitz, 1985) was used for all subsequent transformations and overexpression. The ampicillin-resistant plasmid pPBh602-ec was created by transferring a 2.8 kb fragment containing the pyrLBI operon of the native E. coli ATCase from M13mp8:pyrBI (Wales et al., 1988) into PstI/EcoRI-digested pGEM (Promega).
Site-directed mutagenesis
Site-directed mutagenesis was performed with double-stranded plasmid according to the protocol developed by Deng & Nickoloff (1992) with a 1 to 1000 molar ratio of template to primer. The mutagenesis primer (33-mer) replaced the coding sequence for residues r93 to r97 in the regulatory polypeptide of E. coli ATCase with that represented in the S. marcescens sequence. The selection primer removed a unique AflIII restriction site located in the plasmid vector without changing the encoded amino acid sequence. After mutagenesis, the resulting plasmid pool was transformed into BMH71-18 mutS, amplified overnight, re-isolated using the Wizard™ minipreparation column from Promega, and extensively digested with AflIII. The digested plasmid pool was transformed into EK1104 and plated on LB medium with 40 mg/l ampicillin. The resulting colonies were screened by AflIII digestion and suspected mutants were verified by sequencing. Following the positive identification of the desired chimera, the entire pyrBI operon was sequenced using the Sequenase™ version 2.0 DNA kit from USB™ to verify that there was no other mutation in the operon.
Computer modeling of native and chimeric enzymes
Knowledge-based protein modeling of the native and chimeric enzymes was performed by the automated protein modeling server Swiss-Model based upon the coordinates of 1RAA (CTP-liganded T-state; Kosman et al., 1993), 1RAI (CTP-liganded T-state; Kosman et al., 1993), 1ACM (PALA-liganded T-state; Stevens et al., 1990) and 2ATC (CTP-liganded T-state; Honzatko et al., 1982). Sequence alignment of the native S. marcescens, S M : rS5′ec and EC : rS5′sm chimera with native E. coli regulatory polypeptide generated the initial framework for the three-dimensional modeling. The Cα atom coordinates for the non-conserved region were accommodated onto the framework of Brookhaven Protein Data Bank entries that have a resolution better than 2.5 Å. The backbone was rebuilt using elements (C, N, O, etc) from the high-resolution X-ray structure, and the best rotamers (as determined by the van der Waals exclusion test) were added as side-chains. Idealization of bond geometry and removal of unfavorable non-bonded contacts was automatically performed by energy minimization with CHARMM (Brooks et al., 1983) using the PARAM22 parameter set and cut-off distance for non-bonded interactions of 8 Å. The refinement of the primary model generated by Promod was performed by 50 steps of steepest descent, followed by 200 steps of conjugate gradient energy minimization (Peitsch, 1995, 1996). The Swiss-model coordinates were visualized using either InsightII version 95.0 Molecular Modeling System (BIO-SYN Technologies) or Rasmol (Sayle & Milner-White, 1995). The image was converted to postscript file for plotting using MOLSCRIPT (Kraulis, 1991).
Enzyme purification and kinetic evaluation
The plasmid containing the chimera EC : rS5′sm pyrBI operon was transformed into EK1104 and grown in minimal medium (TF medium) supplemented as previously described (Wales et al., 1988). The overexpressed holoenzyme was purified to homogeneity as described (Liu et al., 1997). ATCase activity was determined according to the colorimetric assay as described by Prescott & Jones (1969). Aspartate requirements were determined in the presence of a saturating concentration of carbamoyl phosphate (4.8 mM). Effector responses were determined in the presence of 2 mM ATP (4 mM for the native S. marcescens ATCase), 2 mM CTP, 2 mM UTP or 2 mM CTP plus 2 mM UTP. All activity assays were performed in Tripartate buffer (Mes 0.1 M, 0.051 M N-ethyl-morpholine, 0.051 M diethanolamine, pH 8.3; Ellis & Morrison, 1982). Enzyme concentrations and sampling intervals were increased as the assay temperature was decreased.
Data analysis
All collected data were fitted with TableCurve™ 2D and the linear equation for the regression line with maximal r2 value (square of the Pearson product moment correlation coefficient) was selected. Vmax and [Asp]0.5 values were calculated directly from these equations. The nH value was determined from a Hill plot of the data. The relative specific activity in Figure 5 is determined by dividing the specific activity at each aspartate concentration by Vmax.
[Asp]0.5 is an analogous parameter to Km and we made the assumption that it generally reflects the equilibrium binding parameter. Provided aspartate achieves rapid binding equilibrium in the steady state, the effect that an allosteric ligand has on [Asp]0.5 is quantitatively described by the parameter Qax, which is defined as:
where represents [Asp]0.5 obtained at saturating concentrations of nucleotide effector, represents [Asp]0.5 in the absence of effector (Reinhart, 1983). The nature of the allosteric effector is indicated by the value of ΔGax:
The allosteric response can be characterized as activation if the value of ΔGax is negative and inhibition if positive (Wyman, 1964; Weber, 1972, 1975; Braxton et al., 1994).
The free energy difference (ΔGax) can be partitioned into two components under isothermal conditions: enthalpy (ΔHax) and entropy (TΔSax). The entropy component can be determined from the variation in Qax with temperature, provided ΔHax remains relatively constant, according to the standard van’t Hoff relation:
By plotting values of log(Qax) as a function of reciprocal temperature, ΔHax can be determined from the slope of the resulting line and values for ΔSax from the intercept.
Acknowledgments
We thank Dr G. D. Reinhart for his careful reading of the manuscript. This research has been supported by grants from the Robert A. Welch Foundation (A915), L.L. was a TAMU Regent’s Graduate Fellow
Abbreviations used
- ATCase
aspartate transcarbamoylase
- CP
carbamoyl phosphate-binding
- Allo
allosteric effector-binding
References
- Allewell NN, LiCata VJ. Thermodynamic approaches to understanding aspartate transcarbamylase. Methods Enzymol. 1995;259:608–628. doi: 10.1016/0076-6879(95)59064-1. [DOI] [PubMed] [Google Scholar]
- Aucoin JM, Pishko EJ, Baker DP, Kantrowitz ER. Engineered complementation in Escherichia coli aspartate transcarbamoylase-heterotropic regulation by quaternary structure stabilization. J Biol Chem. 1996;271:29865–29869. doi: 10.1074/jbc.271.47.29865. [DOI] [PubMed] [Google Scholar]
- Beck DA, Kedzie KM, Wild JR. Comparison of the aspartate transcarbamoylases from Serratia marcescens and Escherichia coli. J Biol Chem. 1989;264:16629–16637. [PubMed] [Google Scholar]
- Braxton BL, Tlapak-Simmons VL, Reinhart GD. Temperature-induced inversion of allosteric phenomena. J Biol Chem. 1994;269:47–50. [PubMed] [Google Scholar]
- Braxton BL, Mullins LS, Raushel FM, Reinhart GD. Allosteric effects of carbamoyl phosphate synthetase from Escherichia coli are entropy-driven. Biochemistry. 1996;35:11918–11924. doi: 10.1021/bi961305m. [DOI] [PubMed] [Google Scholar]
- Brooks BR, Bruccoleri RE, Olafson BD, States DJ, Swaminathan S, Karplus M. CHARMM: a program for macromolecular energy, minimization and dynamics calculations. J Comput Chem. 1983;4:187–217. [Google Scholar]
- Changeux JP, Rubin MM. Allosteric interactions in aspartate transcarbamylase. III Interpretation of experimental data in terms of the model of Monod, Wyman and Changeux. Biochemistry. 1968;7:553–561. doi: 10.1021/bi00842a601. [DOI] [PubMed] [Google Scholar]
- Deng WP, Nickoloff JA. Site-directed mutagenesis of virtually any plasmid by eliminating a unique site. Anal Biochem. 1992;200:81–88. doi: 10.1016/0003-2697(92)90280-k. [DOI] [PubMed] [Google Scholar]
- Ellis KJ, Morrison JF. Buffers of constant ionic strength for studying pH-dependent processes. Methods Enzymol. 1982;87:405–426. doi: 10.1016/s0076-6879(82)87025-0. [DOI] [PubMed] [Google Scholar]
- Foltermann KF, Beck DA, Wild JR. In vivo formation of hybrid aspartate transcarba-moylases from native subunits of divergent members of the family. Enterobacteriaceae J Bacteriol. 1986;167:285–290. doi: 10.1128/jb.167.1.285-290.1986. [DOI] [PMC free article] [PubMed] [Google Scholar]
- Gouaux JE, Stevens RC, Lipscomb WN. Crystal structures of aspartate carbamoyltransferase ligated with phosphonacetamide, malonate, and CTP or ATP at 2.8 Å and neutral pH. Biochemistry. 1990;29:7702–7715. doi: 10.1021/bi00485a020. [DOI] [PubMed] [Google Scholar]
- Honzatko RB, Crawford JL, Monaco HL, Ladner JE, Evans DR, Warren SG, Wiley DC, Ladner RC, Lipscomb WN. Crystal and molecular structures of native and CTP-liganded aspartate carbamoyltransferase from Escherichia coli. J Mol Biol. 1982;160:219–263. doi: 10.1016/0022-2836(82)90175-9. [DOI] [PubMed] [Google Scholar]
- Howlett GJ, Schachman HK. Allosteric regulation of aspartate transcarbamoylase. Changes in the sedimentation coefficient promoted by the bisubstrate analogue N-(phosphonacetyl)-L-aspartate. Biochemistry. 1977;16:5077–5083. doi: 10.1021/bi00642a021. [DOI] [PubMed] [Google Scholar]
- Jones ME, Spector L, Lipmann F. Carbonyl phosphate, the carbonyl donor in enzymatic citrulline synthesis. J Am Chem Soc. 1955;77:819–820. [Google Scholar]
- Ke H, Lipscomb WN, Cho Y, Honzatko RB. Complex of N-phosphonacetyl-L-aspartate with aspartate transcarbamoylase: X-ray refinements, analysis of conformational changes and catalytic and allosteric mechanism. J Mol Biol. 1988;204:725–747. doi: 10.1016/0022-2836(88)90365-8. [DOI] [PubMed] [Google Scholar]
- Kosman RP, Gouaux JE, Lipscomb WN. Crystal structure of CTP-ligated T state aspartate transcarbamoylase at 2.5 Å resolution: implications for ATCase mutants and the mechanism of negative cooperativity. Proteins: Struct Funct Genet. 1993;15:147–176. doi: 10.1002/prot.340150206. [DOI] [PubMed] [Google Scholar]
- Kraulis PJ. MOLSCRIPT: a program to produce both detailed and schematic plots of protein structures. J Appl Crystallog. 1991;193:527–553. [Google Scholar]
- Krause KL, Volz KW, Lipscomb WN. 2.5 Å structure of aspartate carbamoyltransferase complexed with the bisubstrate analog N-(phosphonacetyl)-L-aspartate. J Mol Biol. 1987;193:527–553. doi: 10.1016/0022-2836(87)90265-8. [DOI] [PubMed] [Google Scholar]
- Lennick M, Allewell NM. Changes in the hydrogen exchange kinetics of Escherichia coli aspartate transcarbamylase produced by effector binding and subunit association. Proc Natl Acad Sci USA. 1981;78:6759–6763. doi: 10.1073/pnas.78.11.6759. [DOI] [PMC free article] [PubMed] [Google Scholar]
- Lipscomb WN. Aspartate transcarbamylase from Escherichia coli: activity and regulation. Advan Enzymol. 1994;68:67–151. doi: 10.1002/9780470123140.ch3. [DOI] [PubMed] [Google Scholar]
- Liu L, Wales ME, Wild JR. Conversion of the allosteric regulatory patterns of aspartate transcarbamoylase by exchange of a single beta-strand between diverged regulatory chains. Biochemistry. 1997;36:3126–3132. doi: 10.1021/bi962065d. [DOI] [PMC free article] [PubMed] [Google Scholar]
- Myers JK, Pace CN, Scholtz JM. Denaturant m values and heat capacity changes in accessible surface areas of protein unfolding. Protein Sci. 1995;4:2138–2148. doi: 10.1002/pro.5560041020. [DOI] [PMC free article] [PubMed] [Google Scholar]
- Nowlan SF, Kantrowitz ER. Superproduction and rapid purification of Escherichia coli aspartate transcarbamylase and its catalytic subunit under extreme derepression of the pyrimidine pathway. J Biol Chem. 1985;260:14712–14716. [PubMed] [Google Scholar]
- Peitsch MC. Protein modelling by E-mail. Bio/Technology. 1995;13:658–660. [Google Scholar]
- Peitsch MC. ProMod and Swiss-Model: Internet-based tools for automated comparative protein modelling. Biochem Soc Trans. 1996;24:274–279. doi: 10.1042/bst0240274. [DOI] [PubMed] [Google Scholar]
- Prescott LM, Jones ME. Modified methods for the determination of carbamyl aspartate. Anal Biochem. 1969;32:408–419. doi: 10.1016/s0003-2697(69)80008-4. [DOI] [PubMed] [Google Scholar]
- Reichard P, Hanshoff G. Aspartate carbamyl transferase from Escherichia coli. Acta Chem Scand. 1956;10:548–566. [Google Scholar]
- Reinhart GD. The determination of thermodynamic allosteric parameters of an enzyme undergoing steady-state turnover. Arch Biochem Biophys. 1983;224:389–401. doi: 10.1016/0003-9861(83)90225-4. [DOI] [PubMed] [Google Scholar]
- Reinhart GD, Hartleip SB, Symcox MM. Role of coupling entropy in establishing the nature and magnitude of allosteric response. Proc Natl Acad Sci USA. 1989;86:4032–4036. doi: 10.1073/pnas.86.11.4032. [DOI] [PMC free article] [PubMed] [Google Scholar]
- Sayle RA, Milner-White EJ. RASMOL: bio-molecular graphics for all. Trends Biochem Sci. 1995;20:374. doi: 10.1016/s0968-0004(00)89080-5. [DOI] [PubMed] [Google Scholar]
- Schachman HK. Can a simple model account for the allosteric transition of aspartate transcarbamoylase? J Biol Chem. 1988;263:18583–18586. [PubMed] [Google Scholar]
- Shanley MS, Foltermann KF, O’Donovan GA, Wild JR. Properties of hybrid aspartate transcarbamoylase formed with native subunits from divergent bacteria. J Biol Chem. 1984;259:12672–12677. [PubMed] [Google Scholar]
- Stevens RC, Gouaux JE, Lipscomb WN. Structural consequences of effector binding to the T state of aspartate carbamoyltransferase: crystal structures of the unligated and ATP- and CTP-complexed enzymes at 2.6 Å resolution. Biochemistry. 1990;29:7691–7701. doi: 10.1021/bi00485a019. [DOI] [PubMed] [Google Scholar]
- Van Vliet F, Xi XG, De Staercke C, De Wannemaeker B, Jacobs A, Cherfils J, Ladjimi MM, Hervé G, Cunin R. Heterotropic interactions in aspartate transcarbamoylase: turning allosteric ATP activation into inhibition as a consequence of a single tyrosine to phenylalanine mutation. Proc Natl Acad Sci USA. 1991;88:9180–9183. doi: 10.1073/pnas.88.20.9180. [DOI] [PMC free article] [PubMed] [Google Scholar]
- Wales ME, Hoover TA, Wild JR. Site-specific substitutions of the Tyr-165 residue in the catalytic chain of aspartate transcarbamoylase promotes a T-state preference in the holoenzyme. J Biol Chem. 1988;263:6109–6114. [PubMed] [Google Scholar]
- Wales ME, Strang CJ, Swanson R, Wild JR. Modification of regulatory communication in aspartate transcarbamoylase. In: Himmel ME, Georgiou G, editors. Biocatalyst Design for Stability and Specificity. American Chemical Society; Washington, DC: 1993. pp. 195–209. [Google Scholar]
- Weber G. Ligand binding and internal equilibria in proteins. Biochemistry. 1972;11:864–878. doi: 10.1021/bi00755a028. [DOI] [PubMed] [Google Scholar]
- Weber G. Energetics of ligand binding to proteins. Advan Protein Chem. 1975;29:1–83. doi: 10.1016/s0065-3233(08)60410-6. [DOI] [PubMed] [Google Scholar]
- Wedler FC, Ley BW, Lee BH, O’Leary MH, Kantrowitz ER. L-aspartate association contributes to rate limitation and induction of the T-R transition in Escherichia coli aspartate transcarbamoylase: equilibrium exchange and kinetic isotope effects with a Vmax-enhanced mutant, Asp236 → Ala. J Biol Chem. 1995;270:9725–9733. doi: 10.1074/jbc.270.17.9725. [DOI] [PubMed] [Google Scholar]
- Wild JR, Wales ME. Molecular evolution and genetic engineering of protein domains involving aspartate transcarbamoylase. Annu Rev Microbiol. 1990;44:93–118. doi: 10.1146/annurev.mi.44.100190.001205. [DOI] [PubMed] [Google Scholar]
- Wild JR, Johnson JL, Loughrey SJ. ATP-liganded form of aspartate transcarbamoylase, the logical regulatory target for allosteric control in divergent bacterial systems. J Bacteriol. 1988;170:446–448. doi: 10.1128/jb.170.1.446-448.1988. [DOI] [PMC free article] [PubMed] [Google Scholar]
- Wild JR, Loughrey SJ, Corder TC. In the presence of CTP, UTP becomes an allosteric inhibitor of aspartate transcarbamoylase. Proc Natl Acad Sci USA. 1989;86:52–56. doi: 10.1073/pnas.86.1.46. [DOI] [PMC free article] [PubMed] [Google Scholar]
- Wild JR, Grimsley JK, Kedzie KM, Wales ME. From biological diversity to structure-function analysis: protein engineering in aspartate transcarbamoylase. In: Baldwin TO, Raushel FM, Scott AI, editors. Chemical Aspects of Enzyme Biotechnology. Plenum Press; New York: 1991. pp. 95–109. [Google Scholar]
- Wyman J. Linked functions an reciprocal effects in hemoglobin: a second look. Advan Protein Chem. 1964;19:223–286. doi: 10.1016/s0065-3233(08)60190-4. [DOI] [PubMed] [Google Scholar]
- Xi XG, De Staercke C, Van Vliet F, Triniolles F, Jacobs A, Stas PP, Ladjimi MM, Simon V, Cunin R, Hervé G. The activation of Escherichia coli aspartate transcarbamylase by ATP. Specific involvement of helix H2′ at the hydrophobic interface between the two domains of the regulatory chains. J Mol Biol. 1994;242:139–149. doi: 10.1006/jmbi.1994.1565. [DOI] [PubMed] [Google Scholar]