Abstract
Spontaneous contractions of the myosalpinx are critical for oocyte transport along the oviduct. Slow waves, the electrical events that underlie myosalpinx contractions, are generated by a specialized network of pacemaker cells called oviduct interstitial cells of Cajal (ICC-OVI). The ionic basis of oviduct pacemaker activity is unknown. Intracellular recordings and Ca2+ imaging were performed to examine the role of extracellular and intracellular Ca2+ sources in slow wave generation. RT-PCR was performed to determine the transcriptional expression of Ca2+ channels. Molecular studies revealed most isoforms of L- and T-type calcium channels (Cav1.2,1.3,1.4,3.1,3.2,3.3) were expressed in myosalpinx. Reduction of extracellular Ca2+ concentration ([Ca2+]o) resulted in the abolition of slow waves and myosalpinx contractions without significantly affecting resting membrane potential (RMP). Spontaneous Ca2+ waves spread through ICC-OVI cells at a similar frequency to slow waves and were inhibited by reduced [Ca2+]o. Nifedipine depolarized RMP and inhibited slow waves; however, pacemaker activity returned when the membrane was repolarized with reduced extracellular K+ concentration ([K+]o). Ni2+ also depolarized RMP but failed to block slow waves. The importance of ryanodine and inositol 1,4,5 trisphosphate-sensitive stores were examined using ryanodine, tetracaine, caffeine, and 2-aminoethyl diphenylborinate. Results suggest that although both stores are involved in regulation of slow wave frequency, neither are exclusively essential. The sarco/endoplasmic reticulum Ca2+-ATPase (SERCA) pump inhibitor cyclopiazonic acid inhibited pacemaker activity and Ca2+ waves suggesting that a functional SERCA pump is necessary for pacemaker activity. In conclusion, results from this study suggest that slow wave generation in the oviduct is voltage dependent, occurs in a membrane potential window, and is dependent on extracellular calcium and functional SERCA pumps.
Keywords: interstitial cells of Cajal, smooth muscle, oocyte transport
oviducts (fallopian tubes in humans) are smooth muscle-lined (myosalpinx) tubular organs that provide a conduit for transporting oocytes from the ovary to the uterus (12). Electrical slow waves in oviducts are spontaneous, periodic depolarizations of smooth muscle cells that generate propulsive contractions of the myosalpinx and provide the mechanism for oocyte transport through the oviduct (11). Slow waves have been recorded from oviducts of humans (28, 34), mice (11, 48), guinea pigs (40, 48), and baboons (48). Recently, the origin of oviduct electrical activity was traced to a specialized population of KIT-positive pacemaker cells termed oviduct interstitial cells of Cajal (ICC-OVI) (11). ICC have been linked to pacemaker activity in other visceral smooth muscles, including those of the gastrointestinal (GI) tract (42) and urethra (37).
The ionic mechanisms underlying pacemaker activity in the oviduct are unknown. In the GI tract, pacemaker activity of ICC depends on cellular handling of Ca2+ (13, 19, 30). Slow waves are abolished when extracellular Ca2+ concentration ([Ca2+]o) is reduced (9, 14, 15, 24, 54) but also by inositol 1,4,5 trisphosphate (IP3) receptor antagonists (35, 36, 53). The importance of IP3 receptors in pacemaker activity was confirmed when it was reported that slow waves were absent in the gastric antral tissues of IP3 type 1 receptor knockout mice (47). Thus it is currently thought that slow waves are initiated by voltage-dependent entry of Ca2+ and is amplified by release of Ca2+ from IP3-dependent intracellular Ca2+ stores (20, 42, 53). The resultant increase in intracellular Ca2+ concentration ([Ca2+]i) is thought to activate a Ca2+-dependent inward pacemaker current in ICC, which may be carried by Ca2+-activated Cl− channels (CaCC) (21, 30, 44, 50). Recently, a newly identified CaCC Ano-1 [encoded by Tmem16a; (6, 43, 56)] was found to be expressed in ICC of the GI muscles, and these channels appear to be necessary for generation of slow waves (17, 25, 57). In the urethra a similar dependence on [Ca2+]o and CaCCs has been reported, but the source of intracellular Ca2+ release has been identified as ryanodine-sensitive stores (27, 44, 45).
In the present study, our objectives were to investigate the importance of extracellular Ca2+, Ca2+ influx pathways, and intracellular Ca2+ stores in the generation of oviduct slow waves. Since electrical slow waves are the pacemaker events underlying oviduct phasic contractions that are essential for oocyte transport along the oviduct, a better understanding of the ionic basis of slow waves in this tissue may provide a basis for improving ductile motility and development of therapies for infertility.
METHODS
Ethical approval.
Adult female BALB/c mice (30–60 days old; Jackson Laboratory, Bar Harbor, MN) were killed via isoflurane (Baxter, Deerfield, IL) inhalation followed by cervical dislocation.
The animals were maintained and the experiments performed in accordance with the National Institutes of Health “Guide for the Care and Use of Laboratory Animals.” All procedures were approved by the Institutional Animal Use and Care Committee at the University of Nevada.
Tissue preparation.
Immediately after cervical dislocation, an abdominal incision was made and the entire reproductive tract was removed and placed in Krebs-Ringer bicarbonate solution (KRB). Microdissection was performed to uncoil the oviducts and dissect them free of the ovaries at the infundibulum and of the uterine horn at the utero-tubal junction. The resultant preparations were intact, uncoiled oviducts consisting of the four regions including the infundibulum, ampulla, isthmus, and intramural segments.
Oviducts used for RT-PCR were opened to reveal the mucosal surface. The mucosa was carefully removed by gentle stroking with curved forceps to reveal the underlying myosalpinx. Resultant preparations consisted of the myosalpinx and serosal layers of the oviduct. Preparations were then cut into three equal segments, which roughly correspond to the infundibulum/ampulla, isthmus, and intramural segments.
Drugs and solutions.
Recording chambers for electrophysiology experiments were perfused at a rate of 3 ml/min with oxygenated KRB containing (in mmol/l): 120.35 NaCl, 5.9 KCl, 15.5 NaHCO3, 1.2 NaH2PO4, 1.2 MgCl2, 2.5 CaCl2, and 11.5 glucose. KRB was constantly bubbled with 97% O2-3% CO2 at 37 ± 0.5°C to maintain pH between 7.3 and 7.4. For experiments requiring low [Ca2+]o, the quantity of CaCl2 in the KRB was reduced as necessary to yield 1.0, 0.75, 0.5, 0.25, 0.1, and 0 (nominally free, hereafter referred to as 0) mM Ca2+ solutions. In some experiments reduction in Ca2+ divalent ions from KRB was compensated with Mg2+ ion substitution as previously described (54). In experiments requiring low [K+]o, the salt concentrations in the KRB were unaltered except that 0.1 mM KCl was used along with 126.15 mM NaCl to compensate for the charge difference and maintain isotonicity. Nifedipine, pinacidil, nickel, caffeine, tetracaine, and 2-aminoethyl diphenylborinate (2-APB) were purchased from Sigma-Aldrich (St. Louis, MO). Cyclopiazonic acid (CPA) and BAY K8644 were purchased from Calbiochem (Rockland, MA), ouabain was from Tocris (Ellisville, MO), and ryanodine was purchased from Ascent Scientific (Princeton, NJ). Stock solutions of drugs were made in the relevant solvent (H2O, ethanol, or dimethylsulfoxide as per manufacturers specifications) and diluted to the desired concentration in KRB before being applied to oviduct preparations by constant perfusion.
Electrophysiological and isometric force measurements.
Oviduct preparations for electrophysiology experiments were pinned to the Sylgard elastomer (Dow Corning, Midland, MI) lined base of a recording chamber using fine tungsten pins (120 μm diameter) to minimize movements of the muscle and permit extended durations of intracellular impalements. Smooth muscle cells located halfway along the oviduct length (in the isthmic segment) were impaled using sharp (resistance = 80–120 MΩ) glass microelectrodes filled with 3 M KCl. Transmembrane potentials were recorded onto a PC running Axoscope 9.2 software (Axon Instruments/Molecular Devices, Sunnyvale, CA) via an analog-to-digital converter (Digidata 1322A; Axon Instruments) with input from a high-impedance electrometer (Axoclamp 2B, Axon Instruments). In some experiments a segment of the myosalpinx was isolated using tungsten pins, and the opposite end of the oviduct was attached to an isometric force transducer (Gould-Statham UC3, Gould-Statham, Oxnard, CA) for the simultaneous measurement of intracellular electrical activity and phasic contractile activity. After pinning was completed, oviducts were left to equilibrate for at least 1 h before experiments were initiated.
Statistical analysis.
SigmaStat (Systat Software, Chicago, IL) software was used for statistical analyses. Significance was calculated using either a Student's t-test or a one-way ANOVA followed by a post hoc Tukey test. P values of <0.05 were considered to represent statistically significant changes. All data are expressed as means ± SE. The numbers of oviducts in which observations were made with each oviduct being from a different animal is referred to as n. Measurements of slow wave and contraction parameters, including RMP, frequency, amplitude, half-maximal duration, and maximum rate of rise of the upstroke (dV/dtmax) were made using Clampfit 9.0 (Axon Instruments). Final figures were made from digitized data using Corel Draw 12.0 (Corel, Ontario, Canada).
Reverse transcription-polymerase chain reaction.
Total RNA was isolated from BALB/c brain and oviduct (ampulla, isthmus, and intramural segments) using TRIzol reagent (Invitrogen, Carlsbad, CA) and the RNA was treated with 1 U/μl DNase I (Promega, Madison, WI). First-strand cDNA was prepared from 1 μg RNA using SuperScript II reverse transcriptase (Invitrogen) in a 20-μl reaction containing 25 ng oligo dT(12–18) primer, 1 μl 10 mM dNTP, 5× first-strand buffer (250 mM Tris·HCl, pH 8.3, 375 mM KCl, 15 mM MgCl2), and 0.1 M DTT. PCR was performed with specific primers for L-type and T-type Cav (Cacna1) channel α subunits on 2 μl cDNA using AmpliTaq Gold PCR Master Mix (Applied Biosystems, Foster City, CA). The PCR primers used are described in Table 1. All primers were designed to span intronic sequences to eliminate amplification of contaminating genomic DNA in the source RNA. Amplification of glyceraldehyde-3-phosphate dehydrogenase (GAPDH) was used as a control for cDNA integrity. No-template PCR reactions served as controls for primer contamination. PCR reactions were performed in a GeneAmp 2700 thermal cycler (PE Applied Biosystems, Foster City, CA). The amplification profile was 95°C for 10 min to activate the AmpliTaq polymerase, then 35 cycles of 95°C for 15 s, 60°C for 20 s, and 72°C for 30 s, followed by a final step of 72°C for 5 min. RT-PCR amplification fragments were analyzed by size analysis on 2% agarose gels alongside a 100 base pair (bp) marker.
Table 1.
Details of primers used for RT-PCR
| Target Transcript | Accession Number | Oligonucleotide Sequences (5′-3′) | Fragment Length, bp |
|---|---|---|---|
| Gapdh | NM_008084 | GTCTTCACCACCATGGAGA (+) | 190 |
| AAGCAGTTGGTGGTGCAG (−) | |||
| Cacna1 s (Cav1.1) | NM_001081023 | GAGAGAAAGCGCAGGAAGATGTCG (+) | 171 |
| GTAGGGGTCTTTCACCTCATTAACG (−) | |||
| Cacna1c (Cav1.2) | NM_00978 | GTAAGGATGAGTGAAGAAGCCGAGTA (+) | 157 |
| CAGAGCGAAGGAAACTCCTCTTTGG (−) | |||
| Cacna1d (Cav1.3) | NM_028981 | GCAAACTATGCAAGAGGCACCAGAC (+) | 178 |
| CTTTGGGAGAGAGATCCTACAGGTG (−) | |||
| Cacna1f (Cav1.4) | NM_019582 | CACTGGTCCCAGCAACACGTAAACG (+) | 148 |
| GGTAGGTGCCTGGGATAGGTAAATC (−) | |||
| Cacna1 g (Cav3.1) | NM_009783 | TCACTCCCAACCAGCAGACACCAGC (+) | 196 |
| ACCCAGGCCCTGCACGTCCAGG (−) | |||
| Cacna1 h (Cav3.2) | NM_021415 | AGACAGGAGGCCATGCACGCAGAGT (+) | 172 |
| TGCGGGTACGGACACTGGCAGG (−) | |||
| Cacna1i (Cav3.3) | NM_001044308 | GCTGCAGATGCCTGCTGAGTTCTTC (+) | 197 |
| TGCTAGGGCTGGCATCCAAAGACGT (−) |
RT-PCR primers used in this study. All primers were designed against mus musculus GenBank sequences. Gapdh, glyceraldehyde-3-phosphate dehydrogenase. +, Sense; −, antisense.
Ca2+ imaging.
Oviducts were collected as described above. The tissues were treated with 0.7 mg/ml collagenase Type F and 2 mg/ml bovine serum albumin (Sigma) in 2 ml KRB solution for 4 min at 37°C to facilitate dye loading into oviducts. Tissues were washed out and pinned down to the base of a Sylgard-coated dish. After an equilibration period (1 h), the oviduct preparation was loaded with Fluo-4 (25 μg; FluoroPure-AM, Molecular Probes, Eugene, OR) in a solution of DMSO (0.02%) and Cremophor EL detergent (0.01%) for 20 min at 25°C. After incubation, the preparation was perfused with KRB (37°C) for 30 min to allow for deesterification of the dye.
Preparations were visualized and imaged using a Eclipse E600FN microscope (Nikon, Melville, NY) at different magnifications (Nikon Plan Fluor). Fluo-4 was excited at 488 nm (T.I.L.L. Polychrome IV, Grafelfing, Germany), and the fluorescence emission (>515 nm) was detected using a cooled, interline transfer CCD-camera system (Imago, T.I.L.L. Photonics) using 4 × 4 binning. Image sequences (344 × 260) were collected at 12.4 fps for 40–60s using TILLvisION software (T.I.L.L. Photonics).
Image sequences of Ca2+ activity in oviducts were analyzed using custom software (Volumetry G7mv, GWH). Ca2+ waves that consisted of an ordered activation of ICC-OVI and smooth muscle cells in the longitudinal axis of the oviduct (ovary ↔ uterus direction) were measured using spatiotemporal maps (STMaps; Ref. 18). The frequency and velocity of each Ca2+ wave was calculated. Because of the slow image acquisition rate, the maximum velocity that could be resolved at ×20 magnification was ∼4 mm/s. For presentation purposes, the average background fluorescence was subtracted in STMaps to reveal dynamic changes in Ca2+ fluorescence. Similarly, sequences of images showing the spread of Ca2+ waves were differentiated (Δt = 162 ms) to better visualize the Ca2+ wavefront.
RESULTS
Calcium activity in isolated mouse oviducts.
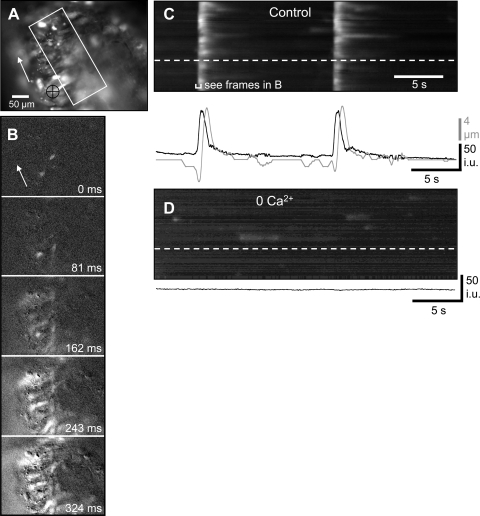
Isolated mouse oviducts (n = 25) displayed two main patterns of Ca2+ activity: 1) the most common pattern consisted of Ca2+ transients that spread along the oviduct as waves in the longitudinal direction (oviduct to uterus) and were often associated with a contraction of the oviduct that followed the Ca2+ wave after a short delay (∼1 s). These waves occurred at a regular frequency of 9.19 ± 1.06 cycles/min (n = 19; mean interval between waves = 6.53 ± 0.75 s; range 2.08–13.59 s; Fig. 1). There appeared to be a relationship between frequency and amplitude of Ca2+ waves. In oviducts where spontaneous frequency was slow (interval between waves > 10 s), the duration of the average Ca2+ transients was longer, and conversely, in oviducts that had a fast spontaneous frequency of Ca2+ waves, the duration of average Ca2+ transients was shorter. Interestingly, when the frequency of Ca2+ waves was faster than ∼20 cycles/min (interval ∼3 s), two Ca2+ transients often followed each other in quick succession, followed by a long refractory period after the second wave. The amplitude of the average Ca2+ transient of the second wave was reduced compared with the initial wave. The relationship between frequency and amplitude of Ca2+ waves is similar to what has been described in the colon (32) and is likely the result of the time needed to refill intracellular Ca2+ stores. The velocity of propagating Ca2+ waves averaged of 2.7 ± 0.27 mm/s (n = 19). 2) The less common second type of activity consisted of spontaneous intracellular Ca2+ transients in isolated cells in the oviduct wall that were uncoordinated with respect to each other (n = 6). Ca2+ waves were not observed in these preparations. This pattern of Ca2+ activity was observed in some tissues in which Ca2+ waves were abolished with 0 [Ca2+]o and occurred in a time-dependent manner before inhibition of calcium transients (Fig. 1D).
Fig. 1.
Effects of low extracellular Ca2+ concentration ([Ca2+]o) on Ca2+ waves within the myosalpinx. A: an oviduct loaded with the Ca2+ indicator dye Fluo-4 arranged with the ovarian pole uppermost. The area in which a spatiotemporal map (STMap) was constructed is marked by the white rectangle. Tissue movement was tracked in the region underneath the black crosshairs. The white arrow shows the direction of Ca2+ wave propagation along the oviduct. B: image sequence showing the longitudinal spread of a Ca2+ wave along the oviduct from the uterine pole toward ovarian pole as indicated by the white arrow. Frames show differentiated Ca2+ fluorescence (Δt = 162 ms). C: STMap of the rhythmically occurring Ca2+ waves during a 30-s recording period. The white streaks represent Ca2+ waves that propagate from the bottom to the top of the field of view. The change in Ca2+ fluorescence in one region of the oviduct (denoted by the white dashed line) is shown in the black trace below the STMap. Oviduct contractions are shown in the gray trace. D: upon removal of [Ca2+]o, Ca2+ waves were reduced/abolished, but intracellular Ca2+ transients in isolated cells could still be detected (spots in 0 mM [Ca2+]o STMap). The black trace underneath the STMap calculated from a region shown by the white dashed line in the STMap shows the absence of Ca2+ waves after 0 mM [Ca2+]o.
Effects of reduction of [Ca2+]o on oviduct electrical, contractile, and Ca2+ activity.
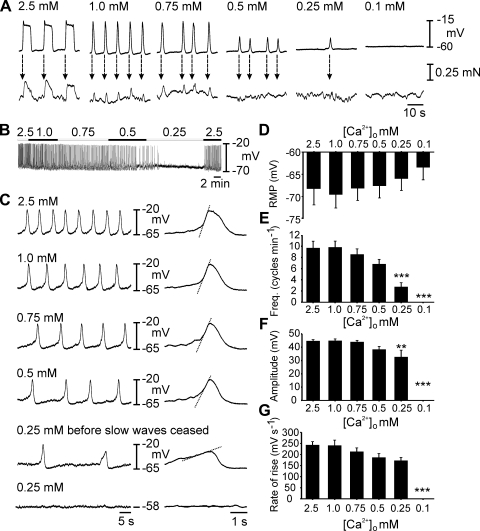
The dependence of oviduct pacemaker activity and smooth muscle contractions on [Ca2+]o was examined by sequential reduction of [Ca2+]o. Control electrical activity and simultaneous mechanical activity was recorded from oviduct preparations perfused with KRB containing 2.5 mM Ca2+. Intracellular impalements were maintained in the same cell as the [Ca2+]o in the perfusate was reduced in a stepwise fashion from 2.5 to 0 mM (nominally Ca2+ solution) or until slow waves and contractions were abolished. In some experiments intracellular impalements were made from the same oviduct segment from which tension was recorded to make simultaneous recordings of electrical and mechanical activities (n = 12). Slow waves were coupled to contractions on a 1:1 basis, and the slow wave always preceded the development of contraction by 0.35 ± 0.08 s, as described previously (11) (Fig. 2A). The force of phasic contractions was related to the duration of slow waves. Amplitude and frequencies of slow waves and contractions decreased as a function of [Ca2+]o, and spontaneous activity was abolished at 0.25 mM (in 2 of 7 muscles; Fig. 2, B and C) or in nominally Ca2+ solutions (in 7 of 7 muscles; Fig. 2A).
Fig. 2.
Oviduct slow wave generation is dependent on [Ca2+]o. A: simultaneous recordings of slow waves (top) and myosalpinx contractions (bottom) made during perfusion with 2.5–0 mM [Ca2+]o Krebs-Ringer bicarbonate buffer (KRB). Slow waves and contractions were coupled on a 1:1 basis (dashed arrows) and as [Ca2+]o was reduced, slow wave and contraction amplitude and frequency decreased until they were both abolished at concentrations lower than 0.25 mM [Ca2+]o. B: complete intracellular recording as [Ca2+]o was reduced from 2.5–0.25 mM when slow wave activity ceased. C: expanded time scales show the gradual reduction in frequency and rate of rise of slow waves (indicated by dashed lines on the expanded slow waves) as [Ca2+]o was reduced. D–G: summarized results of 7 experiments examining the effects of reduced [Ca2+]o on slow wave parameters. Resting membrane potential (RMP, D), slow wave frequency (E), slow wave amplitude (F), and maximum rate of rise of the upstroke (G) are plotted as a function of [Ca2+]o. Statistically significant changes in slow wave parameters are indicated: *P < 0.05, **P < 0.01, ***P < 0.001 (one-way ANOVA with a post hoc Tukey test). NB 0 mM [Ca2+]o refers to nominally free calcium. Negligible amounts of Ca2+ may have been present in salts, other than CaCl2, present in KRB.
Reduction in [Ca2+]o tended to depolarize RMP, but this effect was not statistically significant in the group of muscles studied (e.g., RMP averaged −68 ± 4 mV in 2.5 mM and −63 ± 3 mV when slow waves ceased at either 0.25 or 0 mM [Ca2+]o; P = 0.746; n = 7; Fig. 2D). Slow wave frequency declined as [Ca2+]o was reduced, and this became statistically significant at 0.25 mM when frequency averaged 2.8 ± 0.8 cycles/min compared with 9.7 ± 1.2 cycles/min at 2.5 mM (Fig. 2E; P < 0.001). Reduction in [Ca2+]o produced a decrease in amplitude of slow waves, which also reached significance at 0.25 mM (from 45 ± 1 mV in 2.5 mM [Ca2+]o to 33 ± 5 mV in 0.25 mM [Ca2+]o; P = 0.03; Fig. 2F). The dV/dtmax of the upstroke phase of slow waves decreased with the reduction in [Ca2+]o from 242 ± 16 mV/s in 2.5 mM Ca2+ to 173 ± 14 mV/s in 0.25 mM Ca2+ before cessation of slow waves (P < 0.01), as shown in the expanded time scale slow waves in Fig. 2C and the summary log plot in Fig. 2G.
In 5/8 preparations, Ca2+ waves were observed that propagated along the length of the oviduct in the field of view at a velocity of 3.3 ± 0.4 mm/s (n = 5; Fig. 1) and were followed by a propagating contraction after ∼1 s (Fig. 1C). The interval between propagating Ca2+ waves was 8.0 ± 1.9 s (range 4.8–13.6 s, n = 5), which equates to a frequency of 7.52 ± 1.75 cycles/min. In the remaining three preparations, Ca2+ activity in the tissue was faint and consisted of intracellular Ca2+ transients in individual cells that were uncoordinated with activity in adjacent cells.
Substituting normal KRB with KRB containing 0 mM [Ca2+]o (20–30 min) abolished propagating Ca2+ waves in 4/5 preparations in which these Ca2+ waves were observed (Fig. 1D). In one preparation, the duration of the propagating Ca2+ waves was reduced (control ∼6 s, 0 mM [Ca2+]o ∼1 s). In three preparations that displayed faint uncoordinated intracellular Ca2+ transients, but no Ca2+ waves, 0 mM [Ca2+]o abolished activity within 30 min in a time-dependent manner (Fig. 1D).
Expression of Ca2+ channel transcripts in oviduct myosalpinx.
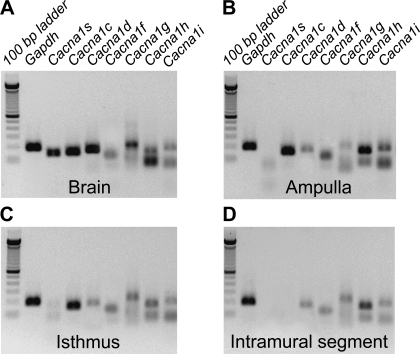
The results described above suggest that oviduct slow waves are indirectly dependent on the presence of [Ca2+]o. A major influx pathway for Ca2+ into smooth muscle cells is provided by dihydropyridine-sensitive L-type (Cav1.2) and dihydropyridine-resistant T-type (Cav3 subfamily) Ca2+ channels. We performed RT-PCR to determine expression of Ca2+ channel transcripts in the myosalpinx. RT-PCR identified the expression of Cacna1c, Cacna1d, and Cacna1f in the ampulla and isthmic segments of the oviduct (Fig. 3, B and C); however, only Cacna1d and Cacna1f were resolved in the intramural segment (Fig. 3, B–D). All three transcripts encoding the Cav3 subfamily (i.e., Cacna1g, Cacna1h, and Cacna1i) were expressed in all segments of the oviduct (Fig. 3, B–D; n = 6 ducts from each segment).
Fig. 3.
Expression of Ca2+ channel transcripts in the oviduct myosalpinx. Panels show RT-PCR gel analysis of Canca1s, Cacna1c, Cacnc1d, and Cacna1f encoding L-type (Cav1 subfamily) and Cacna1g, Cacna1h, and Cacna1i encoding T-type (Cav3 subfamily) expression in the ampulla (B), isthmus (C) and intramural (D) regions of mouse oviduct. Brain was used as a positive control tissue for each channel expression (A). The amplification of GAPDH was used as a control for cDNA integrity. The sizes of RT-PCR amplicons are indicated in Table 1.
Effects of L-type Ca2+ channel blockade on slow waves.
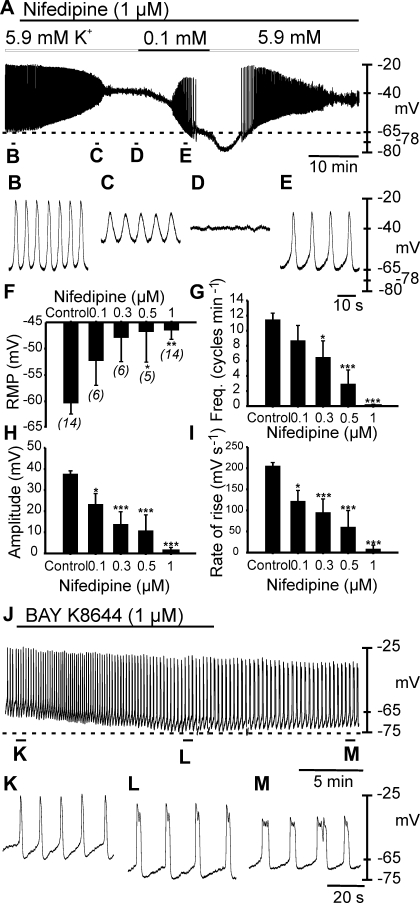
RT-PCR confirmed the expression of Cacna1c encoding the α subunit of Cav 1.2 Ca2+ channels in the myosalpinx (Fig. 3). Therefore, we tested the effects of the dihydropyridine nifedipine (0.1 μM, n = 6; 0.3 μM, n = 6; 0.5 μM, n = 5; 1 μM, n = 14) on oviduct electrical activity (Fig. 4, A–I). Nifedipine caused a dose-dependent depolarization in membrane potential and a decrease in amplitude, frequency, and dV/dtmax. At the highest concentration tested, nifedipine (1 μM) significantly depolarized RMP from −60 ± 2 mV to −47 ± 2 mV (1 μM; n = 14; Fig. 4, A–D and F; P = 0.002) and abolished slow waves in 13 of 14 preparations (Fig. 4, A–D and G). In the remaining one tissue, nifedipine decreased slow wave frequency (10.5 to 1.5 cycles/min), reduced slow wave amplitude (36 to 20 mV), and decreased the dV/dtmax (171 to 122 mV/s).
Fig. 4.
Effects of the L-type Ca2+ channel antagonist nifedipine and agonist BAY K8644 on slow wave generation. A: slow wave activity recorded in the absence and presence of nifedipine (1 μM). Nifedipine induced membrane depolarization from −66 to −40 mV and caused loss of slow wave activity. Reduction in extracellular K+ concentration ([K+]o) from 5.9 to 0.1 mM produced membrane hyperpolarization and a return of slow waves in the continued presence of nifedipine. As membrane potential hyperpolarized beyond control levels (−66 mV, dashed line), slow waves were again abolished. Reintroduction of 5.9 mM [K+]o caused membrane depolarization and a transient return in slow wave activity. Specific time points from the experiment in A are expanded in B–E. Traces in B–E are indicated in A. F–I are dose-dependent effects of nifedipine (0.1–1 μM) on resting membrane potential and slow wave parameters. n numbers displayed (n) below bars in F apply to F–I. J–M: effects of BAY K8644 (1 μM) on slow waves. BAY K8644 added as indicated by solid horizontal line caused membrane hyperpolarization (dashed line) and decreased slow wave frequency that was partially reversible upon washout. Statistically significant changes in slow wave parameters are indicated: *P < 0.05, **P < 0.01, ***P < 0.001 (one-way ANOVA with a post hoc Tukey test). Recordings in A and J were performed continuously from single cell impalements.
These results suggest that calcium entry through Cav1 subfamily channels is essential for oviduct slow wave generation; however, it is possible that the depolarization in RMP that occurred in response to nifedipine may have negatively impacted pacemaker activity. Therefore, we investigated the effects of repolarizing cells by reducing [K+]o ([K+]o = 0.1 mM; n = 6; Fig. 4A) or by using the KATP channel opener pinacidil (10 nM; n = 3; see Ref. 10) in the presence of nifedipine (1 μM). In the presence of nifedipine, reduced [K+]o or pinacidil caused membrane repolarization, and in each case restored slow waves (Fig. 4, A and E; data not shown for pinacidil treatment). At membrane potentials around the level of RMP (control: −62 ± 3 mV; nifedipine in low [K+]o, −63 ± 2 mV; n = 6), nifedipine (1 μM) significantly reduced slow wave frequency (control: 10 ± 1 cycles/min; nifedipine in low [K+]o: 7 ± 1 cycles/min; P = 0.018) and decreased the dV/dtmax of the upstroke (control 189 ± 7 mV/s; nifedipine in low [K+]o:151 ± 11 mV/s; P = 0.025). Amplitude (control: 39 ± 2 mV; nifedipine in low [K+]o: 31 ± 4 mV; P = 0.067) and half-maximal duration (control 1.3 ± 0.1 s; nifedipine in low [K+]o: 1.7 ± 0.3 s; P = 0.211) of slow waves were not significantly affected.
To ensure the effects of reducing [K+]o was not a consequence of altering the Na+-K+-ATPase activity, we performed an additional series of experiments reducing [K+]o to 0.1 mM in the presence of the Na+-K+-ATPase inhibitor ouabain. Ouabain (1 μM, 20–30 min) did not produce a change in RMP (−73 ± 3 mV under control and −73 ± 3 mV after oubain; n = 4). Ouabain also had no effect on other slow wave parameters. In the continued presence of ouabain reduction in [K+]o to 0.1 mM still produced membrane hyperpolarization and loss of slow wave activity (n = 4).
These findings demonstrate that calcium influx through L-type Ca2+ channels plays a role in maintaining RMP and regulating slow wave frequency and dV/dtmax but is not essential for slow wave generation. In fact our data demonstrate that a window of membrane potential exists that is permissive to pacemaker activity: slow waves were restored by repolarization negative to −50 ± 1 mV and ceased when cells were hyperpolarized negative to −79 ± 3 mV (n = 6).
If nifedipine depolarized membrane potential and caused inhibition of slow waves, then the dihydropyridine L-type calcium channel agonist BAY K8644 should have the opposite effects on oviduct myosalpinx. We therefore examined the effects of BAY K8644 on myosalpinx slow waves. Under control conditions RMP averaged −67.5 ± 3.3 mV and slow waves 42.3 ± 1.1 mV in amplitude and 3.7 ± 0.7 s in duration (half-maximal duration of 1.8 ± 0.6 s) occurred at a frequency of 7.8 ± 1.1 cycles/min. BAY K8644 (1 μM) caused membrane hyperpolarization to −72.8 ± 3.3 mV (P = 0.002 compared with control) and slow waves 45.5 ± 0.8 mV in amplitude (P = 0.019) and 4.1 ± 0.8 s in duration (half-maximal duration of 2.1 ± 0.5 s) occurred at a frequency of 6.5 ± 1.1 cycles/min (P = 0.011). The dV/dtmax of the slow wave upstroke also increased from 161 ± 31 under control conditions to 257 ± 35 mV/s in BAY K8644 (P = 0.001). The effects of BAY K8644 were reversible on washout (Fig. 4, J–M).
Effects of T-type Ca2+ channel blockade on slow waves.
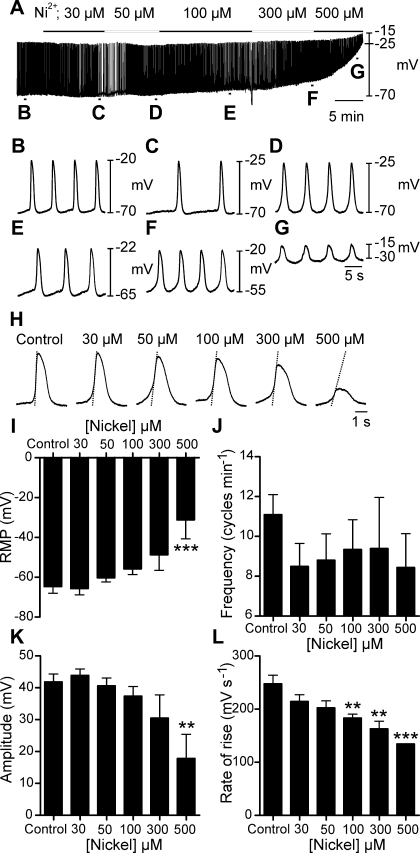
T-type Ca2+ channels are important for the generation and propagation of slow waves in a variety of smooth muscle tissues (1, 24, 30, 52, 54, 55). Slow waves ceased when [Ca2+]o was reduced, but L-type Ca2+ channels were found nonessential for slow wave generation. We resolved expression of Cacna1g, Cacna1h, Cacna1i, which encode the T-type Ca2+ channels Cav3.1, Cav3.2, Cav3.3, respectively, in the oviduct (Fig. 3). We therefore tested whether Ni2+, a known T-type Ca2+ channel antagonist, affected pacemaker activity. Ni2+ (30-500 μM) caused a concentration-dependent depolarization of RMP [−65 ± 3 mV in control to −56 ± 3 mV in 100 μM (n = 7; P = 0.016) and to −31 ± 10 mV in 500 μM (n = 3; P < 0.001); Fig. 5, A–G and I]. A significant reduction in slow wave dV/dtmax from 248 ± 16 mV/s in control to 134 ± 0 mV/s in 500 μM Ni2+ was also observed, suggesting a decrease in the current driving the depolarization (P < 0.001; Fig. 5, H and J). However, even at 500 μM, Ni2+ failed to block slow waves in the oviduct. These results suggest that calcium entry though nickel-sensitive calcium channels may be involved in the generation of the upstroke component of slow waves but not necessarily in generating pacemaker activity.
Fig. 5.
Effects of the T-type Ca2+ channel antagonist nickel on oviduct slow waves. A–G: dose-dependent effects of nickel (30–500 μM) on electrical activity. B–G: faster sweep speeds of sections indicated on the trace in A. H: individual slow waves at the maximal effect of each concentration of nickel. Superimposed lines on the upstroke phase of the slow waves indicate a dose-dependent decrease in the rate of rise. Nickel produced a depolarization in membrane potential and a reduction in the rate of rise of the slow wave upstroke. I–L: summaries of the dose-dependent effects of nickel on RMP (I), frequency (J), amplitude (K), and maximum rate of rise of the upstroke (L) plotted as a function of nickel concentration. **P < 0.01, ***P < 0.001 (one-way ANOVA with a post hoc Tukey test).
Involvement of intracellular Ca2+ stores in oviduct slow wave generation.
It would appear from the experiments described above that [Ca2+]o (and possibly influx through an undefined pathway) is important for maintenance of oviduct RMP to aid in the generation of slow waves. [Ca2+]o may not be the only Ca2+ source participating in generation of slow waves, as smooth muscle excitability has also been shown to depend on release of Ca2+ from intracellular stores (4, 41). We tested antagonists of ryanodine and IP3 receptor-operated stores and inhibitors of the SERCA pump to investigate the involvement of intracellular Ca2+ stores in oviduct slow waves.
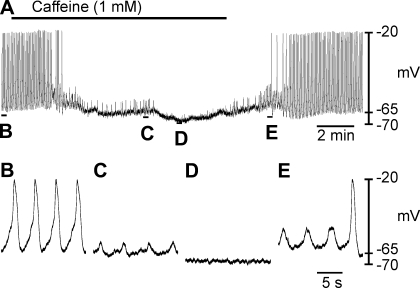
First, we assessed the effect of caffeine, an activator of ryanodine receptor-operated channels (RyRs) (3, 51), which causes emptying of ryanodine-sensitive stores. Relatively low doses of caffeine (1 mM) hyperpolarized RMP from −69 ± 2 to −75 ± 2 mV and abolished slow waves (Fig. 6, A–F; n = 5; P = 0.004). The membrane hyperpolarization produced by caffeine is within the membrane potential range where slow waves were inhibited after reducing ([K+]o, see above). Therefore, the hyperpolarized membrane potential may be responsible for the loss of slow wave activity.
Fig. 6.
Effect of caffeine on oviduct slow wave generation. A: effect of caffeine (1 mM) on oviduct electrical activity. Indicated sections of the trace in A are shown at a faster sweep speed in B–E. Caffeine abolished slow wave activity and unmasked small spontaneous transient depolarizations (STDs) also termed unitary potentials (C). After several minutes exposure to caffeine STDs were also abolished leaving a quiescent, hyperpolarized membrane potential (D). Upon washout, STDs gradually increased in amplitude and frequency before the return of spontaneous slow waves (E).
Spontaneous transient depolarizations (STDs), also referred to as “unitary potentials,” have been reported to underlie the generation of slow waves in gastrointestinal muscles (13, 31). In some experiments as caffeine inhibited slow waves, underlying STDs were revealed (Fig. 6, A, C, and E). After several minutes exposure to caffeine, STDs were also abolished and a quiescent hyperpolarized baseline remained (Fig. 6D). Upon washout, STDs returned and gradually increased in frequency and amplitude before full-amplitude slow waves developed (Fig. 6E).
Role of RyR-operated intracellular Ca2+ stores in slow wave activity.
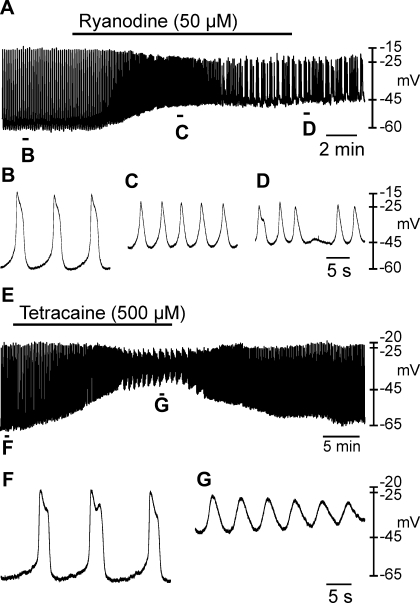
The effects of caffeine described above, suggest that ryanodine-sensitive Ca2+ stores may be involved in the generation of slow waves. Therefore, we tested the effects of ryanodine and tetracaine. Ryanodine (50 μM) caused RMP depolarization from −65 ± 2 mV to −49 ± 1 mV (Fig. 7, A–E; n = 3; P = 0.029) and decreased slow wave amplitude from 43 ± 2 mV to 24 ± 3 mV (P = 0.026; Fig. 7, A–D and F). During initial exposure to ryanodine, slow wave frequency increased markedly (Fig. 7, A and C). In the continued presence of ryanodine, slow wave frequency (10 ± 1.8 cycles/min under control conditions and 6.1 ± 3.3 in ryanodine) became irregular and often occurred in clusters. Similar results were obtained with tetracaine (500 μM), which also inhibits RyR receptors (27). Tetracaine depolarized RMP from −67 ± 2 mV under control conditions to −35 ± 4 mV (n = 5; Fig. 7, E–G; P = 0.001) and decreased slow wave amplitude from 46 ± 1 mV to 13 ± 6 mV (Fig. 7, E–G; P = 0.003).
Fig. 7.
Effects of ryanodine and tetracaine on oviduct resting membrane potential and slow waves. A: effect of ryanodine (50 μM) on oviduct electrical activity. B–D: regions identified in A at an expanded time scale. Ryanodine caused a depolarization in membrane potential that was associated with a reduction in amplitude but a transient increase in slow wave frequency. In the continued presence of ryanodine slow waves became irregular in frequency and waveform. E: effect of tetracaine (500 μM) on oviduct electrical activity. Regions indicated in E are shown at a faster sweep speed in F and G. RMP was significantly depolarized, and slow wave amplitude was significantly reduced by tetracaine.
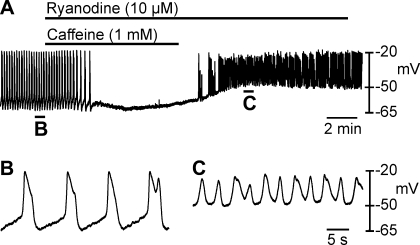
Since caffeine (1 mM) produced a different effect to ryanodine (50 μM) and tetracaine (500 μM); i.e., caffeine hyperpolarized membrane potential and inhibited slow wave generation, but ryanodine and tetracaine depolarized membrane potential and reduced slow wave amplitude; it suggests that caffeine may have effects other than its effects on RyRs. In the next series of experiments we tested the effects of a combination of caffeine (1 mM) and ryanodine (10 μm) and then continued ryanodine (10 μM) (Fig. 8, A–C; n = 4). Coapplication of caffeine and ryanodine inhibited slow waves (Fig. 8A), but washout of caffeine in the continued presence of ryanodine caused depolarization and increased frequency of slow waves with irregular waveforms (Fig. 8C). These results suggested that caffeine inhibits slow waves through a mechanism that does not involve RyRs.
Fig. 8.
Combined effects of caffeine and ryanodine on slow waves. To test whether caffeine was depleting ryanodine sensitive stores, pulse experiments were performed where tissues were treated with ryanodine in the presence of caffeine (A). Caffeine (1 mM) and ryanodine (10 μM) caused inhibition of slow waves. After washout of caffeine, membrane potential depolarized above control levels and irregular slow waves reappeared. B and C show traces with a faster sweep speed from the regions indicated in A.
Role of IP3-sensitive intracellular Ca2+ stores in slow wave activity.
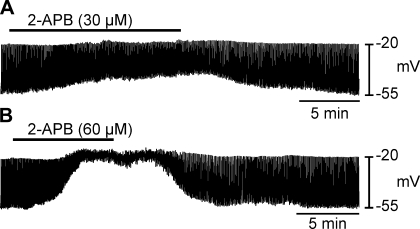
We also tested the effects of the IP3 receptor blocker, 2-APB (30 and 60 μM) on slow waves. 2-APB (30 μM) caused depolarization from −67 ± 4 to −35 ± 7 mV (n = 5; P = 0.01; Fig. 9A). Similar effects were elicited by 60 μM 2-APB (i.e., depolarization from −67 ± 3 to −33 ± 8 mV; n = 5; P = 0.005; Fig. 9B). Slow wave amplitude was also decreased from an average of 45 ± 2 to 17 ± 6 mV with 30 μM (P = 0.02; Fig. 9A) and 43 ± 3 to 12 ± 5 mV with 60 μM 2-APB (P = 0.008; Fig. 9B).
Fig. 9.
Role of inositol 1,4,5 trisphosphate (IP3)-sensitive intracellular stores in oviduct slow waves. A and B: intracellular recordings of oviduct electrical activity before, during and after the application of 2-aminoethyl diphenylborinate (APB) (30 and 60 μM, respectively). 2-APB significantly depolarized RMP and decreased slow wave amplitude in a dose-dependent manner.
Role of the SERCA pump in oviduct slow waves and calcium waves.
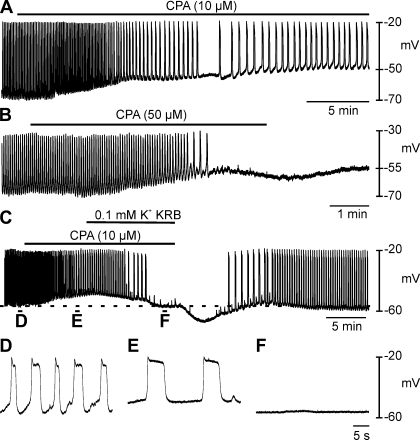
In the next series of experiments we examined the effects of the SERCA pump inhibitor CPA (10 and 50 μM). CPA (10 μM) caused depolarization from −60 ± 2 to −53 ± 3 mV (n = 5; P = 0.023; Fig. 10A). At 50 μM, CPA depolarized cells from −67 ± 2 to −52 ± 5 mV (n = 6; P = 0.009; Fig. 10B). Slow wave frequency was reduced by 10 μM CPA (from 9.8 ± 3.2 to 3.2 ± 0.8 cycles/min; P < 0.001; Fig. 10, A and C–E), and slow waves were blocked by 50 μM CPA (Fig. 10B). The half-maximal duration of slow waves was markedly increased by CPA (10 μM) from 1.8 ± 0.2 to 5.7 ± 0.7 s (P = 0.006; Fig. 10E).
Fig. 10.
Effect of the SERCA pump inhibitor cyclopiazonic acid (CPA) on slow waves. A and B: effects of CPA (10 and 50 μM, respectively) on membrane potential and slow waves. At 10 μM, CPA caused membrane depolarization and an increase in the duration of slow waves, which was associated with an initial increase, followed by a decrease in slow wave frequency. At 50 μM, CPA caused membrane depolarization, an increase in slow wave duration before slow waves were inhibited. To determine whether the reduction or inhibition in slow wave frequency was due to membrane depolarization, 0.1 mM K+ KRB was used to hyperpolarize the membrane in the presence of CPA (C). In CPA, membrane hyperpolarization to control levels (dashed line) did not cause a return in slow wave activity. D–F: faster sweep speeds of the regions indicated in C showing the change in the waveform of slow waves.
To determine whether the block of slow waves by CPA was, in part, due to membrane depolarization. Cells were repolarized by reduced [K+]o (0.1 mM) in the continued presence of CPA (10 μM, n = 3, Fig. 10, C–F). Reduced [K+]o caused repolarization that included a period when control RMP was restored. Slow waves were not restored by repolarization (Fig. 10, C and F). These results suggest that intact intracellular calcium stores are necessary for slow wave generation in the oviduct and that the SERCA pump activity is necessary for refilling these stores.
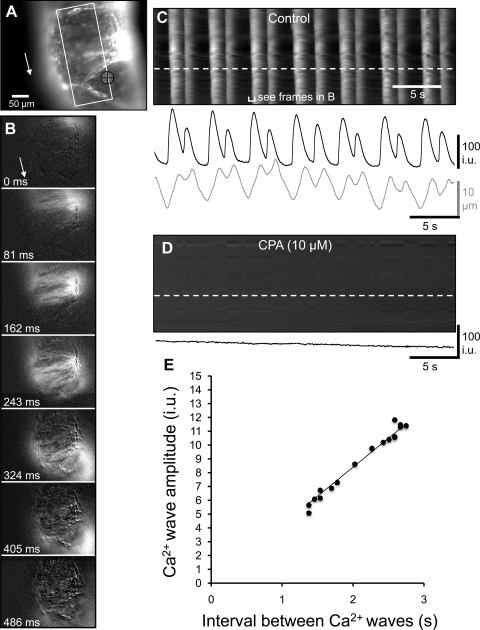
The role of the SERCA pump on the generation and propagation of Ca2+ waves was examined using Ca2+ imaging. Ca2+ waves consisting of propagating Ca2+ transients that spread along the length of the oviduct (Fig. 11, A–C). Ca2+ waves occurred at a frequency of 10.0 ± 2.2 cycles/min (i.e., interval between was 6.0 ± 1.3 s; n = 7). The velocity of Ca2+ waves was 1.6 ± 0.3 mm/s. The addition of CPA (10 μM) abolished Ca2+ transients in all preparations (n = 8; Fig. 11D).
Fig. 11.
Effects of CPA Ca2+ waves. A: Fluo-4-loaded oviduct orientated with the ovarian pole uppermost. The area in which a STMap was constructed is marked by the white rectangle. Tissue movement was tracked in the region underneath the black crosshairs. The white arrow shows the direction of Ca2+ wave propagation along the oviduct. B: frames show differentiated Ca2+ fluorescence (Δt = 162 ms) during the spread of a Ca2+ wave toward the uterine pole (direction indicated by white arrow). C: white streaks represent Ca2+ waves that propagate from the top to the bottom of the field of view. At higher frequencies, two Ca2+ transients often followed each other in quick succession, followed by a long refractory period after the second wave. The change in Ca2+ fluorescence in one region of the oviduct (denoted by the white dashed line) is shown in the black trace below the STMap. Tissue movement is shown in the gray trace. D: addition of CPA (10 μM) abolished Ca2+ waves within the myosalpinx. The black trace underneath the STMap calculated from a region shown by the white dashed line in the STMap shows the absence of Ca2+ waves after CPA. A: example showing irregular frequency pattern of Ca2+ waves in mouse oviduct. E: relationship between interval (frequency) and amplitude of Ca2+ waves. The interval between successive Ca2+ waves is plotted on the x-axis (s) and the amplitude of the Ca2+ wave is plotted on the y-axis (i.u. = arbitrary intensity units). When the time between a preceding and current Ca2+ wave was short (e.g., ∼1.5 s), the amplitude of the current Ca2+ wave was reduced. Similarly, when the time between a preceding and current Ca2+ wave was longer (e.g., ∼2.5 s), the amplitude of the current Ca2+ wave was larger.
DISCUSSION
In the present study we investigated the role of Ca2+ in the generation of oviduct pacemaker activity. When [Ca2+]o was reduced from 2.5 to 0 mM, the amplitude, frequency, and rate of rise of slow waves decreased, and pacemaker activity was abolished when [Ca2+]o was reduced below 0.25 mM. Previous studies have shown that slow waves of the proximal colon (24, 54), stomach (15, 29), and small intestine (9, 14) were similarly dependent on [Ca2+]o. Our results, however, suggested that the relationship between [Ca2+]o and slow waves is more complex than Ca2+ serving as the charge carrier for slow wave depolarization. We found that inhibitors of voltage-dependent Ca2+ channels (Cav1 and 3) did not block slow waves directly, but inhibition of pacemaker activity was linked indirectly via changes in resting membrane potential. It appears that membrane potential is regulated by [Ca2+]o, and possibly by maintenance of [Ca2+]i levels, which may influence Ca2+-dependent conductances in the plasma membrane. The generation of slow wave activity was dependent on Ca2+ stores; most likely by release of Ca2+ from both ryanodine receptors and IP3 receptor-operated channels. Further studies of ICC-OVI and smooth muscle cells will be required to fully understand the mechanism of pacemaker activity in the myosalpinx.
Increases in [Ca2+]i in smooth muscles can occur either by influx through ion channels in the plasma membrane or by release from intracellular stores (41). Cav1.2 channels, commonly expressed in smooth muscle cells, are activated by high voltages with maintained “window currents” in the range −50 to −10 mV (7, 16, 23). Although L-type calcium channels play a prominent role in E-C coupling in smooth muscle cells, they are not involved in the generation of slow waves in other visceral smooth muscles (1, 21, 24, 39, 46, 55). We confirmed that oviducts express the transcripts Cacna1c, Cacna1d, and Cacna1f that encode L-type Ca2+ channels (Cav1.2, 1.3, and 1.4) and antagonists of these channels inhibited oviduct myosalpinx contractions (11). Here we examined whether these channels played a role in pacemaker activity using the L-type calcium channel antagonist nifedipine and agonist BAY K8644. Nifedipine produced a 13-mV depolarization in membrane potential and caused cessation of slow waves. This effect is similar to that reported previously in the guinea pig myometrium where nifedipine produced an identical 13-mV depolarization and abolished spontaneous electrical activity (8). In uterine muscles, depolarization caused by nifedipine was thought to be due to suppression of Kv or KCa channels. If Ca2+-independent K+ conductances contribute to RMP in the oviduct, then it is possible that suppression of such a conductance might cause the depolarization we noted. Opposite to nifedipine, BAY K8644 caused a 5-mV hyperpolarization and increased the amplitude and dV/dt of the upstroke of slow waves, suggesting that the effects of dihydropyridines on myosalpinx slow waves was related to calcium entry and not a nonspecific side effect of these compounds.
With at least two cell types involved in pacemaker activity and voltage responses in the oviduct, it is difficult to know the site of action of drugs in whole tissue experiments. Yet it is important to perform these experiments because isolated cells may not recapitulate the richness of behavior generated by intact muscles. Intracellular experiments in intact muscles can help to develop hypotheses for future cellular studies of ion channels and mechanisms of regulation in isolated cells. In the present study we observed that the oviduct syncytium (composed of ICC-OVI and smooth muscle cells) and the pacemaker mechanism are highly sensitive to changes in [Ca2+]o and to blockade of voltage-dependent Ca2+ entry. Reduction in [Ca2+]o resulted in block of pacemaker activity with little change in RMP, but block of Ca2+ entry via voltage-dependent channels resulted in significant depolarization. These data suggest that Ca2+-dependent conductances may regulate RMP in oviduct cells, but these conductances may be compartmentalized, either in specific regions of a cell or in specific cell types (ICC-OVI vs. smooth muscle cells). Only cells or cellular compartments with coupling between voltage-dependent Ca2+ channels and other Ca2+-dependent conductances may be affected when voltage-dependent Ca2+ entry is blocked.
The pacemaker mechanism appears to depend on Ca2+ stores, and Ca2+ stores may be quite sensitive to and rapidly depleted by reductions in [Ca2+]o. Thus CPA and inhibition of SERCA pumps blocking sequestration of Ca2+ into stores simulated the effects of reducing [Ca2+]o. In contrast, the effects of nifedipine on pacemaker activity did not appear to be related to Ca2+ entry via this mechanism. Membrane depolarization may inhibit slow waves due to inactivation of a voltage-dependent mechanism (30, 38). We found that block of slow waves by nifedipine could be reversed simply by repolarizing membrane potential by reducing [K+]o or with the K+ channel opener pinacidil.
Since L-type Ca2+ channels are not essential for pacemaker activity, we investigated the role of other voltage-dependent membrane Ca2+ channels, the dihydropyridine-resistant T-type (Cav3 subfamily) Ca2+ channels. T-type Ca2+ channels activate at low voltages, having “window” currents in the range −80 to −20 mV (23, 26). Antagonists of these channels slow the rate of the initial upstroke of the slow wave depolarization in GI smooth muscles and at higher concentrations can block slow wave generation and propagation (24, 30, 52, 55). Although we found that Cacna1g, Cacna1h, and Cacna1i transcripts encoding Cav3.1, 3.2, and 3.3 are expressed in murine oviducts, nickel which blocks Cav3 calcium channels at low concentrations [IC50 = 250 μM for Cav 3.1; IC50 = 13 μM for Cav 3.2; IC50 = 216 μM for Cav 3.3; (7, 33)] did not have a significant effect on oviduct slow waves. At higher concentrations, Ni2+ (100–500 μM) caused membrane depolarization similar to that of nifedipine, and these effects were likely to be nonspecific effects on L-type Ca2+ channels (22). The possibility remains that Ca2+ channels such as the dihydropyridine and Ni2+ insensitive Cav1.3 channels, transcripts of which were found in the oviduct, might have a role in the generation of slow waves.
Despite the clear inhibition of pacemaker activity by CPA, responses to ryanodine and IP3 receptor blockers were obscured by secondary effects on membrane potential. Thus the precise role of Ca2+ stores in pacemaker activity is not easy to determine in whole tissue experiments. Ryanodine and 2-APB both caused depolarization but failed to fully inhibit pacemaker activity. The strong effects of these drugs on membrane potential suggest tight coupling between Ca2+ stores and Ca2+-dependent conductances in the plasma membranes of ICC-OVI or smooth muscle cells. Such relationships between Ca2+ stores and plasma membrane ion channels are common in smooth muscles, and it is well known, for example, that Ca2+ release from stores can couple to Ca2+-activated K+ channels (to elicit net outward current) and to Ca2+-activated Cl− or nonselective cation channels (to elicit inward currents) (49). In the case of the oviduct, it appears that outward currents are the dominant regulator of RMP because blockers of ryanodine and IP3 channels resulted in depolarization. The nature of the Ca2+-dependent K+ conductances that participate in the regulation of membrane potential in oviduct cells will be the subject of future experiments.
The response to caffeine was of particular interest in the present study. Caffeine is often used to test the role of Ca2+ stores in smooth muscles. Ca2+ activates ryanodine receptors and can empty stores by this mechanism (3). In the present study we found that caffeine rapidly inhibited pacemaker activity, but this did not appear to be due to emptying of RyR-sensitive stores, since a low concentration of ryanodine, known to maintain the open state of RyR, did not maintain the block of pacemaker activity imposed by caffeine. These observations suggest that caffeine might have another more dominant effect in either ICC-OVI or smooth muscle cells, by blocking metabolism of cAMP by inhibiting phophodiesterase (2, 5, 9, 10).
In summary, the present study investigated the roles of extracellular and intracellular calcium sources in the generation of pacemaker activity in the murine oviduct. Oviduct pacemaker activity occurs over a broad membrane potential window and is dependent on extracellular calcium. Likewise, calcium waves propagating along the myosalpinx require extracellular sources. Individually, ryanodine receptors and IP3-sensitive stores appear not to be essential for the generation of oviduct slow waves but play a role regulating slow wave frequency. However, the SERCA pump is essential for slow wave generation and the propagation of calcium waves within the oviduct.
GRANTS
This study was supported by a National Institutes of Health Grant DK-57236 (to S. M. Ward) and DK-41315 (to S. M. Ward and K. M. Sanders). F. C. Britton was partially supported by HL-091238 and G. W. Henning by P20RR-018751.
DISCLOSURES
No conflicts of interest, financial or otherwise, are declared by the author(s).
AUTHOR CONTRIBUTIONS
Author contributions: R.E.D., F.C.B., S.A.B., G.W.H., K.M.S., and S.M.W. conception and design of research; R.E.D., F.C.B., S.A.B., G.W.H., C.M.R., and S.M.W. performed experiments; R.E.D., F.C.B., S.A.B., G.W.H., C.M.R., and S.M.W. analyzed data; R.E.D., F.C.B., S.A.B., G.W.H., C.M.R., K.M.S., and S.M.W. interpreted results of experiments; R.E.D., S.A.B., G.W.H., C.M.R., and S.M.W. prepared figures; R.E.D., K.M.S., and S.M.W. drafted manuscript; K.M.S. and S.M.W. edited and revised manuscript; S.M.W. approved final version of manuscript.
ACKNOWLEDGEMENTS
All experiments were performed at the University of Nevada School of Medicine, Reno, NV. The authors express sincere appreciation to Lauren E. Peri for excellent technical assistance. Thanks also to Kellan Bigley for assistance in analysis of the calcium imaging data.
REFERENCES
- 1. Bayguinov O, Ward SM, Kenyon JL, Sanders KM. Voltage-gated Ca2+ currents are necessary for slow-wave propagation in the canine gastric antrum. Am J Physiol Cell Physiol 293: C1645–C1659, 2007 [DOI] [PubMed] [Google Scholar]
- 2. Beavo JA. Cyclic nucleotide phosphodiesterases: functional implications of multiple isoforms. Physiol Rev 75: 725–748, 1995 [DOI] [PubMed] [Google Scholar]
- 3. Berridge MJ. Inositol trisphosphate and calcium signalling. Nature 361: 315–325, 1993 [DOI] [PubMed] [Google Scholar]
- 4. Berridge MJ. Smooth muscle cell calcium activation mechanisms. J Physiol 586: 5047–5061, 2008 [DOI] [PMC free article] [PubMed] [Google Scholar]
- 5. Butcher RW, Sutherland EW. Adenosine 3′,5′-phosphate in biological materials. I. Purification and properties of cyclic 3′,5′-nucleotide phosphodiesterase and use of this enzyme to characterize adenosine 3′,5′-phosphate in human urine. J Biol Chem 237: 1244–1250, 1962 [PubMed] [Google Scholar]
- 6. Caputo A, Caci E, Ferrera L, Pedemonte N, Barsanti C, Sondo E, Pfeffer U, Ravazzolo R, Zegarra-Moran O, Galietta LJ. TMEM16A, a membrane protein associated with calcium-dependent chloride channel activity. Science 322: 590–594, 2008 [DOI] [PubMed] [Google Scholar]
- 7. Catterall WA, Perez-Reyes E, Snutch TP, Striessnig J. International Union of Pharmacology. XLVIII. Nomenclature and structure-function relationships of voltage-gated calcium channels. Pharmacol Rev 57: 411–425, 2005 [DOI] [PubMed] [Google Scholar]
- 8. Coleman HA, Hart JD, Tonta MA, Parkington HC. Changes in the mechanisms involved in uterine contractions during pregnancy in guinea-pigs. J Physiol 523: 785–798, 2000 [DOI] [PMC free article] [PubMed] [Google Scholar]
- 9. Dahms V, Prosser CL, Suzuki N. Two types of “slow waves” in intestinal smooth muscle of cat. J Physiol 392: 51–69, 1987 [DOI] [PMC free article] [PubMed] [Google Scholar]
- 10. Dixon R, Hwang S, Britton F, Sanders K, Ward S. Inhibitory effect of caffeine on pacemaker activity in the oviduct is mediated by cAMP-regulated conductances. Br J Pharmacol 163: 745–754, 2011 [DOI] [PMC free article] [PubMed] [Google Scholar]
- 11. Dixon RE, Hwang SJ, Hennig GW, Ramsey KH, Schripsema JH, Sanders KM, Ward SM. Chlamydia infection causes loss of pacemaker cells and inhibits oocyte transport in the mouse oviduct. Biol Reprod 2009 [DOI] [PMC free article] [PubMed] [Google Scholar]
- 12. Eddy CA, Pauerstein CJ. Anatomy and physiology of the fallopian tube. Clin Obstet Gynecol 23: 1177–1193, 1980 [DOI] [PubMed] [Google Scholar]
- 13. Edwards FR, Hirst GD, Suzuki H. Unitary nature of regenerative potentials recorded from circular smooth muscle of guinea-pig antrum. J Physiol 519: 235–250, 1999 [DOI] [PMC free article] [PubMed] [Google Scholar]
- 14. El Sharkaway TY, Daniel EE. Ionic mechanisms of intestinal electrical control activity. Am J Physiol 229: 1287–1298, 1975 [DOI] [PubMed] [Google Scholar]
- 15. El Sharkaway TY, Szurszewski JH. Modulation of canine antral circular smooth muscle by acetylcholine, noradrenaline and pentagastrin. J Physiol 279: 309–320, 1978 [DOI] [PMC free article] [PubMed] [Google Scholar]
- 16. Fleischmann BK, Murray RK, Kotlikoff MI. Voltage window for sustained elevation of cytosolic calcium in smooth muscle cells. Proc Natl Acad Sci USA 91: 11914–11918, 1994 [DOI] [PMC free article] [PubMed] [Google Scholar]
- 17. Gomez-Pinilla PJ, Gibbons SJ, Bardsley MR, Lorincz A, Pozo MJ, Pasricha PJ, Van de RM, West RB, Sarr MG, Kendrick ML, Cima RR, Dozois EJ, Larson DW, Ordog T, Farrugia G. Ano1 is a selective marker of interstitial cells of Cajal in the human and mouse gastrointestinal tract. Am J Physiol Gastrointest Liver Physiol 296: G1370–G1381, 2009 [DOI] [PMC free article] [PubMed] [Google Scholar]
- 18. Hennig GW, Costa M, Chen BN, Brookes SJ. Quantitative analysis of peristalsis in the guinea-pig small intestine using spatio-temporal maps. J Physiol 517: 575–590, 1999 [DOI] [PMC free article] [PubMed] [Google Scholar]
- 19. Hirst GD, Bramich NJ, Teramoto N, Suzuki H, Edwards FR. Regenerative component of slow waves in the guinea-pig gastric antrum involves a delayed increase in [Ca(2+)](i) and Cl(-) channels. J Physiol 540: 907–919, 2002 [DOI] [PMC free article] [PubMed] [Google Scholar]
- 20. Hirst GD, Edwards FR. Generation of slow waves in the antral region of guinea-pig stomach–a stochastic process. J Physiol 535: 165–180, 2001 [DOI] [PMC free article] [PubMed] [Google Scholar]
- 21. Hirst GD, Ward SM. Interstitial cells: involvement in rhythmicity and neural control of gut smooth muscle. J Physiol 550: 337–346, 2003 [DOI] [PMC free article] [PubMed] [Google Scholar]
- 22. Hobai IA, Hancox JC, Levi AJ. Inhibition by nickel of the L-type Ca channel in guinea pig ventricular myocytes and effect of internal cAMP. Am J Physiol Heart Circ Physiol 279: H692–H701, 2000 [DOI] [PubMed] [Google Scholar]
- 23. Hollywood MA, Woolsey S, Walsh IK, Keane PF, McHale NG, Thornbury KD. T- and L-type Ca2+ currents in freshly dispersed smooth muscle cells from the human proximal urethra. J Physiol 550: 753–764, 2003 [DOI] [PMC free article] [PubMed] [Google Scholar]
- 24. Huizinga JD, Farraway L, Den Hertog A. Generation of slow-wave-type action potentials in canine colon smooth muscle involves a non-L-type Ca2+ conductance. J Physiol 442: 15–29, 1991 [DOI] [PMC free article] [PubMed] [Google Scholar]
- 25. Hwang SJ, Blair PJ, Britton FC, O'Driscoll KE, Hennig G, Bayguinov YR, Rock JR, Harfe BD, Sanders KM, Ward SM. Expression of anoctamin 1/TMEM16A by interstitial cells of Cajal is fundamental for slow wave activity in gastrointestinal muscles. J Physiol 587: 4887–4904, 2009 [DOI] [PMC free article] [PubMed] [Google Scholar]
- 26. Janssen LJ. T-type and L-type Ca2+ currents in canine bronchial smooth muscle: characterization and physiological roles. Am J Physiol Cell Physiol 272: C1757–C1765, 1997 [DOI] [PubMed] [Google Scholar]
- 27. Johnston L, Sergeant GP, Hollywood MA, Thornbury KD, McHale NG. Calcium oscillations in interstitial cells of the rabbit urethra. J Physiol 565: 449–461, 2005 [DOI] [PMC free article] [PubMed] [Google Scholar]
- 28. Kishikawa T, Kuriyama H. Electrical and mechanical activities recorded from smooth muscle cells of the human fallopian tube. Jpn J Physiol 31: 417–422, 1981 [DOI] [PubMed] [Google Scholar]
- 29. Kito Y, Fukuta H, Suzuki H. Components of pacemaker potentials recorded from the guinea pig stomach antrum. Pflügers Arch 445: 202–217, 2002 [DOI] [PubMed] [Google Scholar]
- 30. Kito Y, Suzuki H. Properties of pacemaker potentials recorded from myenteric interstitial cells of Cajal distributed in the mouse small intestine. J Physiol 553: 803–818, 2003 [DOI] [PMC free article] [PubMed] [Google Scholar]
- 31. Kito Y, Suzuki H, Edwards FR. Properties of unitary potentials recorded from myenteric interstitial cells of Cajal distributed in the guinea-pig gastric antrum. J Smooth Muscle Res 38: 165–179, 2002 [DOI] [PubMed] [Google Scholar]
- 32. Lee HT, Hennig GW, Park KJ, Bayguinov PO, Ward SM, Sanders KM, Smith TK. Heterogeneities in ICC Ca2+ activity within canine large intestine. Gastroenterology 136: 2226–2236, 2009 [DOI] [PMC free article] [PubMed] [Google Scholar]
- 33. Lee JH, Gomora JC, Cribbs LL, Perez-Reyes E. Nickel block of three cloned T-type calcium channels: low concentrations selectively block alpha1H. Biophys J 77: 3034–3042, 1999 [DOI] [PMC free article] [PubMed] [Google Scholar]
- 34. Lindblom B, Wikland M. Simultaneous recording of electrical and mechanical activity in isolated smooth muscle of the human oviduct. Biol Reprod 27: 393–398, 1982 [DOI] [PubMed] [Google Scholar]
- 35. Liu LW, Thuneberg L, Huizinga JD. Cyclopiazonic acid, inhibiting the endoplasmic reticulum calcium pump, reduces the canine colonic pacemaker frequency. J Pharmacol Exp Ther 275: 1058–1068, 1995 [PubMed] [Google Scholar]
- 36. Malysz J, Donnelly G, Huizinga JD. Regulation of slow wave frequency by IP(3)-sensitive calcium release in the murine small intestine. Am J Physiol Gastrointest Liver Physiol 280: G439–G448, 2001 [DOI] [PubMed] [Google Scholar]
- 37. McHale NG, Hollywood MA, Sergeant GP, Shafei M, Thornbury KT, Ward SM. Organization and function of ICC in the urinary tract. J Physiol 576: 689–694, 2006 [DOI] [PMC free article] [PubMed] [Google Scholar]
- 38. Nose K, Suzuki H, Kannan H. Voltage dependency of the frequency of slow waves in antrum smooth muscle of the guinea-pig stomach. Jpn J Physiol 50: 625–633, 2000 [DOI] [PubMed] [Google Scholar]
- 39. Ozaki H, Stevens RJ, Blondfield DP, Publicover NG, Sanders KM. Simultaneous measurement of membrane potential, cytosolic Ca2+, and tension in intact smooth muscles. Am J Physiol Cell Physiol 260: C917–C925, 1991 [DOI] [PubMed] [Google Scholar]
- 40. Parkington HC. Intracellularly recorded electrical activity of smooth muscle of guinea pig oviduct. Am J Physiol Cell Physiol 245: C357–C364, 1983 [DOI] [PubMed] [Google Scholar]
- 41. Sanders KM. Regulation of smooth muscle excitation and contraction. Neurogastroenterol Motil 20, Suppl 1: 39–53, 2008 [DOI] [PMC free article] [PubMed] [Google Scholar]
- 42. Sanders KM, Koh SD, Ward SM. Interstitial cells of cajal as pacemakers in the gastrointestinal tract. Annu Rev Physiol 68: 307–343, 2006 [DOI] [PubMed] [Google Scholar]
- 43. Schroeder BC, Cheng T, Jan YN, Jan LY. Expression cloning of TMEM16A as a calcium-activated chloride channel subunit. Cell 134: 1019–1029, 2008 [DOI] [PMC free article] [PubMed] [Google Scholar]
- 44. Sergeant GP, Hollywood MA, McCloskey KD, Thornbury KD, McHale NG. Specialised pacemaking cells in the rabbit urethra. J Physiol 526: 359–366, 2000 [DOI] [PMC free article] [PubMed] [Google Scholar]
- 45. Sergeant GP, Hollywood MA, McHale NG, Thornbury KD. Ca2+ signalling in urethral interstitial cells of Cajal. J Physiol 576: 715–720, 2006 [DOI] [PMC free article] [PubMed] [Google Scholar]
- 46. Suzuki H, Hirst GD. Regenerative potentials evoked in circular smooth muscle of the antral region of guinea-pig stomach. J Physiol 517: 563–573, 1999 [DOI] [PMC free article] [PubMed] [Google Scholar]
- 47. Suzuki H, Takano H, Yamamoto Y, Komuro T, Saito M, Kato K, Mikoshiba K. Properties of gastric smooth muscles obtained from mice which lack inositol trisphosphate receptor. J Physiol 525: 105–111, 2000 [DOI] [PMC free article] [PubMed] [Google Scholar]
- 48. Talo A, Hodgson BJ. Electrical slow waves in oviductal smooth muscle of the guinea-pig, mouse and the immature baboon. Experientia 34: 198–200, 1978 [DOI] [PubMed] [Google Scholar]
- 49. Thorneloe KS, Nelson MT. Ion channels in smooth muscle: regulators of intracellular calcium and contractility. Can J Physiol Pharmacol 83: 215–242, 2005 [DOI] [PubMed] [Google Scholar]
- 50. Tokutomi N, Maeda H, Tokutomi Y, Sato D, Sugita M, Nishikawa S, Nishikawa S, Nakao J, Imamura T, Nishi K. Rhythmic Cl- current and physiological roles of the intestinal c-kit-positive cells. Pflügers Arch 431: 169–177, 1995 [DOI] [PubMed] [Google Scholar]
- 51. von der Weid PY, Rahman M, Imtiaz MS, van Helden DF. Spontaneous transient depolarizations in lymphatic vessels of the guinea pig mesentery: pharmacology and implication for spontaneous contractility. Am J Physiol Heart Circ Physiol 295: H1989–H2000, 2008 [DOI] [PubMed] [Google Scholar]
- 52. Ward SM, Dixon RE, de FA, Sanders KM. Voltage-dependent calcium entry underlies propagation of slow waves in canine gastric antrum. J Physiol 561: 793–810, 2004 [DOI] [PMC free article] [PubMed] [Google Scholar]
- 53. Ward SM, Ordog T, Koh SD, Baker SA, Jun JY, Amberg G, Monaghan K, Sanders KM. Pacemaking in interstitial cells of Cajal depends upon calcium handling by endoplasmic reticulum and mitochondria. J Physiol 525: 355–361, 2000 [DOI] [PMC free article] [PubMed] [Google Scholar]
- 54. Ward SM, Sanders KM. Dependence of electrical slow waves of canine colonic smooth muscle on calcium gradient. J Physiol 455: 307–319, 1992 [DOI] [PMC free article] [PubMed] [Google Scholar]
- 55. Ward SM, Sanders KM. Upstroke component of electrical slow waves in canine colonic smooth muscle due to nifedipine-resistant calcium current. J Physiol 455: 321–337, 1992 [DOI] [PMC free article] [PubMed] [Google Scholar]
- 56. Yang YD, Cho H, Koo JY, Tak MH, Cho Y, Shim WS, Park SP, Lee J, Lee B, Kim BM, Raouf R, Shin YK, Oh U. TMEM16A confers receptor-activated calcium-dependent chloride conductance. Nature 455: 1210–1215, 2008 [DOI] [PubMed] [Google Scholar]
- 57. Zhu MH, Kim TW, Ro S, Yan W, Ward SM, Koh SD, Sanders KM. A Ca(2+)-activated Cl(-) conductance in interstitial cells of Cajal linked to slow wave currents and pacemaker activity. J Physiol 587: 4905–4918, 2009 [DOI] [PMC free article] [PubMed] [Google Scholar]


