Abstract
Urea transporters UT-A2 and UT-B are expressed in epithelia of thin descending limb of Henle's loop and in descending vasa recta, respectively. To study their role and possible interaction in the context of the urine concentration mechanism, a UT-A2 and UT-B double knockout (UT-A2/B knockout) mouse model was generated by targeted deletion of the UT-A2 promoter in embryonic stem cells with UT-B gene knockout. The UT-A2/B knockout mice lacked detectable UT-A2 and UT-B transcripts and proteins and showed normal survival and growth. Daily urine output was significantly higher in UT-A2/B knockout mice than that in wild-type mice and lower than that in UT-B knockout mice. Urine osmolality in UT-A2/B knockout mice was intermediate between that in UT-B knockout and wild-type mice. The changes in urine osmolality and flow rate, plasma and urine urea concentration, as well as non-urea solute concentration after an acute urea load or chronic changes in protein intake suggested that UT-A2 plays a role in the progressive accumulation of urea in the inner medulla. These results suggest that in wild-type mice UT-A2 facilitates urea absorption by urea efflux from the thin descending limb of short loops of Henle. Moreover, UT-A2 deletion in UT-B knockout mice partially remedies the urine concentrating defect caused by UT-B deletion, by reducing urea loss from the descending limbs to the peripheral circulation; instead, urea is returned to the inner medulla through the loops of Henle and the collecting ducts.
Keywords: UT-B, urea secretion, protein diet, vasa recta, urea cycling
urea transporters (UT) are transmembrane urea-selective channel proteins expressed in a few specialized cell types (11, 14). Up to now, at least seven facilitated UTs have been cloned. They belong to two different subfamilies encoded by two different genes, Slc14a2 and Slc14a1, which share a high homology and locate at the same chromosome (3, 16, 18, 21–23, 28). Six UT-As are derived from the UT-A gene by various promoters and alternative splicing, four of which are expressed in the kidney and localized in very specific parts of the nephron but not in the vasculature (4, 9, 17, 19, 20, 24, 26, 27). UT-A1, UT-A3, and possibly UT-A4 (in the rat) are expressed in the most distal part of the collecting ducts (CD) located approximately in the deepest third of the inner medulla, and UT-A2 is expressed in the lower half of the thin descending limb of Henle's loops (TDL) in short-looped nephrons, and in the initial inner medullary (IM) segments of the TDL in long-looped nephrons. UT-B is highly expressed in the endothelium of the arterial vasa recta throughout the renal medulla. UT-B is also expressed in multiple tissues, such as erythrocytes, brain, spleen, heart, testis, and bladder.
UT-B, UT-A1/3 and UT-A2 knockout mice have been generated, and some aspects of their phenotype have been described (5, 8, 25, 29). These UT-specific knockout models confirmed the major role of UT-A1/3 and UT-B in the urine concentrating mechanism. UT-A1/3 knockout mice exhibit a strong urine concentrating defect and UT-B knockout mice a milder defect. In basal conditions, their urine osmolality (Uosm) is reduced by ∼70 and 50%, respectively. Moreover, UT-A1/3 knockout mice were unable to raise their Uosm after 2 days of severe restriction in fluid intake (5), while UT-B knockout mice did raise their Uosm after 24 h of dehydration, although proportionately less than did wild-type mice (29). These results highlighted the major role of UT-A1/3 in the delivery of urea to the deep inner medulla and that of UT-B in the countercurrent exchange of urea between ascending and descending vasa recta (5, 29). In contrast to these findings and contrary to predictions, mice with UT-A2 knockout showed no defect in urine concentrating ability (25). This observation is not compatible with the commonly accepted view that UT-A2 was responsible for a significant recycling of medullary urea from ascending vasa recta back to the nephron lumen (8, 28).
To further evaluate the contribution of UT-A2 and UT-B to the urine concentrating mechanism and their possible interaction, it was interesting to generate a mouse model in which urea recycling through both the vasa recta and the thin limbs would be impaired, with. however, the maintenance of normal urea delivery to the inner medulla (via UT-A1/3). For this purpose, we generated double UT-A2 and UT-B knockout mice (UT-A2/B). Surprisingly, the simultaneous deletion of these two transporters partially corrected the urine concentrating defect caused by UT-B deficiency alone, a result that leads to reconsider previous assumptions about the role of UT-A2-mediated urea transport that had been accepted for several decades.
METHODS
Generation of UT-A2/B knockout mice.
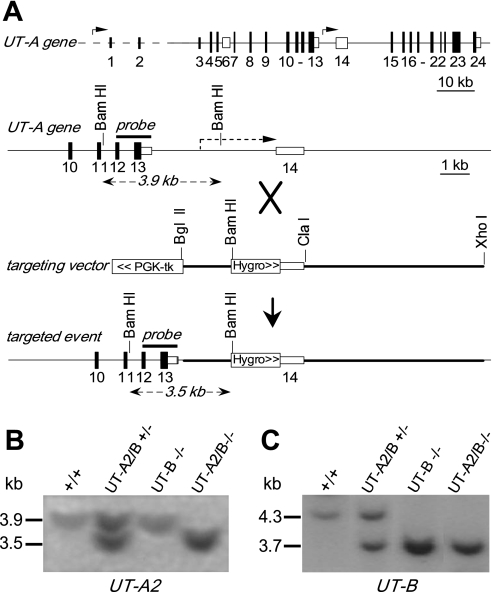
Based on mouse UT-A gene structure (6), a gene replacement targeting vector was constructed, as shown in Fig. 1A. The vector contained a 7.5-kb mouse genomic DNA fragment containing introns 13–14 of the UT-A gene. UT-A2 promoter was replaced with a hygromycin selection cassette for stopping of UT-A2 expression and positive selection with hygromycin, and a PGKtk cassette was inserted at the 3′-end of the UT-A gene targeting sequence for negative selection with FIAU. The vector was linearized at a unique NotI site and electroporated into UT-B knockout embryonic stem (ES) cells (29). Transfected ES cells were selected with G418, hygromycin, and FIAU for 7 days, yielding 6 targeted clones of 160 doubly resistant colonies upon PCR screening using a sense primer specific for the hygromycin cassette and an antisense primer specific for the UT-A2 gene located beyond the 5′-end of the construct. Homologous recombination was confirmed by Southern blot analysis using a 1.2-kb genomic fragment as a probe as indicated in Fig. 1A. ES cells were injected into PC 2.5-day 8-cell morula stage CD1 zygotes, cultured overnight to blastocysts, and transferred to pseudopregnant B6D2 females. Offspring were genotyped by PCR followed by Southern blot analysis. Heterozygous mice were mated with wild-type mice to yield mice heterozygous for both UT-A and UT-B genes. The second crossing of heterozygous mice yielded homozygous UT-A2/B knockout mice. Protocols were approved by the Peking University Health Center, Committee on Animal Research.
Fig. 1.
Gene targeting strategy for urea transporter UT-A2 knockout. A, top: organization and restriction map of the mouse UT-A gene. Rectangles indicate exon segments with coding regions shaded; middle: targeting strategy for UT-A2 gene promoter deletion. Homologous recombination results in replacement of the indicated segments (thick line) of the UT-A gene. PGK-tk and a hygromycin selectable marker were engineered (boxed); bottom: UT-A gene structure after gene targeting. Probe used for Southern blot analysis is indicated (“probe”) along with expected sizes of hybridized fragments after BamHI digestion. B: Southern blot of genomic DNA from liver of different genotypes as indicated (+/+, wild-type; UT-A2/B +/−, UT-A2/B knockout heterozygotes; UT-A2/B −/−, UT-A2/B knockout homozygotes; UT-B −/−, UT-B knockout homozygotes) digested with BamHI and probed as indicated. B and C: Southern blot of the same genomic DNA digested with SpeI and probed by a UT-B gene fragment as indicated (29).
Southern and Northern blot analysis.
UT-A2 and UT-B gene targeting and deletion were confirmed by Southern hybridization in which 10 μg of genomic DNA was digested with BamHI or SpeI, electrophoresed, transferred to a Nylon+ membrane (Amersham Biosciences, Piscataway, NJ), and hybridized with a 1.2-kb UT-A genomic fragment (indicated in Fig. 1A) or 1.1-kb UT-B genomic fragment (29). For Northern blot analysis, total RNA from the kidney was isolated using TRIzol reagent (Invitrogen, Carlsbad, CA). RNAs (10 μg/lane) were resolved on a 1.2% formaldehyde-agarose denaturing gel, transferred to a Nylon+ membrane, and hybridized at high stringency with a 32P-labeled probe corresponding to the mouse UT-A2 or UT-B cDNA coding sequence.
Immunofluorescence and immunoblot analysis.
Kidneys were fixed with 4% paraformaldehyde in PBS for 4 h, infiltrated with 30% sucrose in PBS overnight, frozen in OCT with liquid nitrogen, and cut into 3-μm-thick sections using a cryostat. Tissues were incubated using a rabbit polyclonal antibody against the C terminus of UT-A or against the C terminus of UT-B as described (10). Immunoblot analysis of the tissue homogenate was carried out with the same polyclonal serums. Tissues were homogenized with a glass Dounce homogenizer in 250 mM sucrose containing 1 mM EDTA, 20 μg/ml PMSF, 1 μg/ml pepstatin A, and 1 μg/ml leupeptin (pH 7.4), and centrifuged at 4,000 g for 15 min to remove whole cells, nuclei, and mitochondria. Total protein was assayed in the supernatant fractions using a Bio-Rad DC protein assay kit (Bio-Rad, Richmond, CA) and loaded on a 12% SDS-PAGE gel (10 μg/lane). Proteins were transferred to polyvinylidene difluoride membranes (Gelman Scientific, Ann Arbor, MI) and immunoblotted by procedures as described previously (10).
Fluorescence-based real-time RT-PCR.
mRNA from whole mouse kidney was isolated by using an Oligotex mRNA minikit (Qiagen, Valencia, CA). cDNA was reverse transcribed from mRNA with oligo(dT) (Super-Script First Strand Synthesis System II, Invitrogen). Fluorescence-based RT-PCR was carried out by LightCycler and with a LightCycler FastStart DNA MasterPLUS SYBR Green I kit (Roche Diagnostics, Indianapolis, IN). Primers were as described previously (10). Real-time PCR was carried out according to the manufacturer's instructions. β-Actin was used as the reference gene, and pooled wild-type cDNA was used as the calibrator. Results are described as a normalized, calibrated ratio. All samples are normalized to the reference gene. Concentration ratios for each sample are then calibrated to calibrator sample such that the quantification results are reported as a normalized ratio with the calibrator sample as the denominator: relative mRNA level = ratio of sample (target/reference)/ratio of calibrator (target/reference).
Urinary concentrating studies.
Urine samples were collected by placing mice on a wire mesh platform in a clean glass beaker until spontaneous voiding was observed. In some experiments, urine samples were obtained from the same mice under basal conditions (unrestricted access to food and water), and after 18-h deprivation of food and water. Twenty-four-hour urine output and water consumption were measured in metabolic cages adapted for mice (Harvard Apparatus, Holliston, MA) as previously described (29). Blood samples were collected in heparinized glass tubes by puncture of the periorbital venous sinus. Plasma was separated from blood cells by centrifugation. Urine osmolality was measured by freezing point osmometry (micro-osmometer, Precision Systems, Natick, MA). Urine and plasma chemistries were measured by the Jilin University Clinical Chemistry Laboratory.
Studies of solute concentration in inner medulla tissue.
Inner medulla tissue homogenates were obtained by homogenizing ∼2 mg of papillary tissue in a 15-fold excess of distilled water, and the supernatant after centrifugation was assayed for urea, chloride, sodium, and potassium by the Jilin University Clinical Chemistry Laboratory.
Acute urea load.
Adult female UT-A2/B knockout, UT-B knockout and wild-type mice (6 mice/group, body wt 24–26 g) were adapted for 2 days before the urea load experiment to metabolic cages and to receiving only 4 g dry food/day (AIN 93G, 20% casein). Three hundred μl of a 1 M urea solution was administered by intraperitoneal injection. Urine was collected in 2-h fractions for 2 h before and 10 h after the urea load, and analyzed as described previously (1). Non-urea solute concentration was calculated by substracting urea from urine osmolality (considering that osmolality represents the sum of all urinary solutes).
Blood sampling.
In separate groups of female mice of the three genotypes, treated as those used for urine collection, blood (∼30 μl) from small incisions on the tail was collected in heparinized hematocrit capillary tubes before and 10, 30, 60, 120, 240, 360, and 480 min after the urea load. Two sets of five mice were used for these seven time points (3 measurements in each mouse). The tubes were centrifuged. Urea and creatinine concentrations in plasma were measured as in urine.
Chronic alteration in protein intake.
Adult female UT-A2/B knockout, UT-B knockout, or wild-type mice (6 mice/group, body wt 24–26 g) were offered synthetic food (AIN 93G Bioserv) with either low (LP)-, normal (NP)-, or high (HP)-protein content (10, 20, or 40% casein, respectively, as the only source of protein). After 7 days on these diets, 24-h urine was collected and analyzed as described previously (1).
Statistical analysis.
Data are shown as means ± SE. Results obtained in UT-A2/B knockout mice were compared with those in wild-type mice or UT-B knockout mice by Student's t-test. When three groups were compared, one-way ANOVA was performed. P < 0.05 was considered statistically significant.
RESULTS
Generation of UT-A2 and UT-B double knockout mice.
Figure 1A shows the gene-targeting strategy for generating UT-A2 functional knockout mice. The UT-A2 promoter sequence was replaced with a hygromycin resistance cassette in the gene-targeting vector. Gene targeting was done in UT-B gene-targeted ES cells that were used for generating UT-B knockout mice (29). Homologous recombination was confirmed by Southern blot analysis of ES cell genomic DNA using a 1.2-kb genomic fragment as a probe as indicated in Fig. 1A. BamHI digestion produced a fragment at 3.5 kb corresponding to the replaced gene containing a BamHI site in the hygromycin resistance cassette, and a fragment at 3.9 kb corresponding to the wild-type gene, indicating correct UT-A2 gene targeting (Fig. 1B). Original UT-B gene targeting was confirmed by Southern blot analysis (Fig. 1C) as described previously (29).
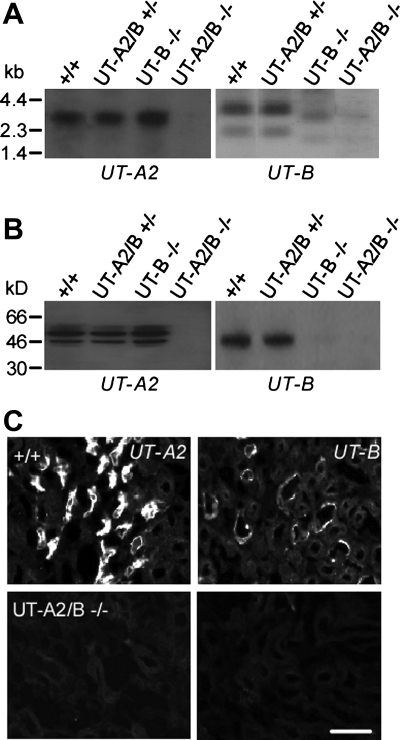
Homozygous UT-A2/B knockout mice were generated by breeding heterozygous mice with both UT-A and UT-B gene targeting. Northern blot analysis in Fig. 2A shows the 3.1-kb UT-A2 and 3.8-kb UT-B transcripts in kidneys of wild-type mice, with neither detectable UT-A2 nor UT-B transcripts in homozygous UT-A2/B gene knockout mice. Immunoblot analysis showed the expected 45- to 60-kDa UT-A2 band and 41- to 54-kDa UT-B band in kidneys of wild-type mice, which were not seen in the homozygous UT-A2/B gene knockout mice (Fig. 2B).
Fig. 2.
UT-A2 and UT-B expression in kidney. A: Northern blot of kidney from indicated genotypes probed with the mouse UT-A2 or UT-B coding sequence. B: immunoblot analysis using purified polyclonal UT-A2 or UT-B antibody. C: UT-A2 and UT-B immunofluorescence of kidney outer medulla stained by polyclonal UT-A2 or UT-B antibody. Scale bar = 50 μm.
UT-A2 and UT-B proteins were localized in mouse kidney tissue by immunofluorescence. Figure 2C shows specific UT-A2 and UT-B expression in TDL and descending vasa recta, respectively, of wild-type kidneys (top). There was no UT-A2 and UT-B immunostaining in homozygous UT-A2/B knockout mice (bottom). Body weight and kidney weight were not influenced by combined UT-A2 and UT-B deletion. Histological examination showed no dilatation of collecting ducts in the renal cortex and medulla in homozygous UT-A2/B knockout mice (data not shown).
UT-A2 deletion in UT-B knockout mice partially remedies the urine concentrating defect caused by UT-B deletion.
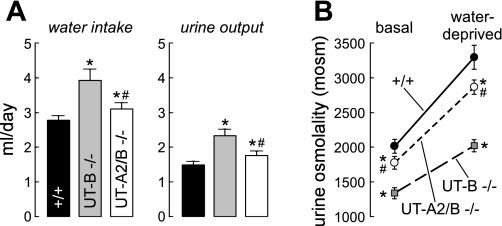
Urinary concentrating function was compared in UT-A2/B knockout mice, UT-B knockout mice, and wild-type mice. Daily urine volume in UT-A2/B knockout mice was 1.8 ± 0.1 ml urine, a rate that significantly exceeded that in litter-matched wild-type mice (1.5 ± 0.1 ml/day) but was distinctly lower than that in UT-B knockout mice (2.4 ± 0.2 ml/day) (Fig. 3A, Table 1). Urine osmolality in UT-A2/B knockout mice (1,775 ± 87 mosmol/kgH2O) was lower than that in wild-type mice (2,052 ± 77 mosmol/kgH2O), but significantly exceeded that in UT-B knockout mice (1,318 ± 72 mosmol/kgH2O) (Fig. 3B). In response to 18-h water deprivation, urine osmolality increased by ∼50–60% in all three genotypes, reaching 2,866 ± 206, 2,014 ± 174, and 3,294 ± 347 mosmol/kgH2O in UT-A2/B knockout, UT-B knockout, and wild-type mice, respectively (Fig. 3B). Total body weight loss after water deprivation was similar in all three genotypes (12.2 ± 1.3, 12.9 ± 1.1, and 12.1 ± 0.9%, respectively).
Fig. 3.
Urinary concentrating function. A: 24-h fluid consumption (left) and urine output (right) in mice of indicated genotype. B: urine osmolality (Uosm) measured in mice given free access to food and water (basal) and after an 18-h water deprivation. Data for 6 individual mice/group are shown together with means ± SE. *P < 0.01 compared with wild-type mice. #P < 0.01 compared with UT-B knockout mice.
Table 1.
Urea handling in wild-type, UT-B knockout, and UT-A2/B double knockout mice in normal conditions
| Wild-Type | UT-B KO | UT-A2/B KO | |
|---|---|---|---|
| Body weight, g | 26.3 ± 0.3 | 25.9 ± 0.4 | 26.2 ± 0.4 |
| Kidney weight, mg | 346 ± 27 | 352 ± 31 | 343 ± 29 |
| Urine | |||
| Urine output, ml/day | 1.5 ± 0.1 | 2.4 ± 0.2* | 1.8 ± 0.1*† |
| Urine osmolality, mosmol/kgH2O | 2,052 ± 77 | 1,318 ± 72* | 1,775 ± 87*† |
| Urine urea concentration, mmol/l | 1,401 ± 68 | 797 ± 62* | 1,205 ± 56*† |
| Urine creatinine concentration, mmol/l | 1.9 ± 0.1 | 1.2 ± 0.1* | 1.6 ± 0.1*† |
| Osmolar excretion, osmol/day | 3.1 ± 0.1 | 3.1 ± 0.1 | 3.2 ± 0.2 |
| Urea excretion, mmol/day | 2.1 ± 0.1 | 2.0 ± 0.1 | 2.2 ± 0.2 |
| Plasma and clearances | |||
| Plasma osmolality, mosmol/kgH2O | 319 ± 1 | 324 ± 2 | 322 ± 1 |
| Plasma urea concentration, mmol/l | 7.5 ± 0.4 | 13.2 ± 0.8* | 10.6 ± 0.8*† |
| Plasma creatinine concentration, μmol/l | 20.2 ± 0.3 | 20.2 ± 0.5 | 20.2 ± 0.3 |
| Plasma potassium concentration, mmol/l | 5.6 ± 0.1 | 5.6 ± 0.2 | 5.7 ± 0.1 |
| Plasma sodium concentration, mmol/l | 152.2 ± 1.1 | 152.6 ± 0.9 | 151.8 ± 1.0 |
| Plasma chloride concentration, mmol/l | 120.3 ± 0.8 | 118.6 ± 0.8 | 121.1 ± 1.8 |
| Urea clearance, ml/day | 287 ± 10 | 144 ± 9* | 212 ± 32*† |
| Creatinine clearance, ml/day | 144 ± 3 | 143 ± 5 | 144 ± 2 |
| Urea clearance/creatinine clearance | 2.0 ± 0.1 | 1.0 ± 0.1* | 1.5 ± 0.1*† |
| Urine-to-plasma ratios | |||
| U/Posm | 6.4 ± 0.3 | 4.1 ± 0.2* | 5.5 ± 0.3*† |
| U/Pcreatinine | 94 ± 5 | 60 ± 3* | 80 ± 3*† |
| U/Purea | 189 ± 12 | 61 ± 6* | 117 ± 13*† |
Values are means ± SE of 5 mice/group. KO, knockout.
P < 0.05 compared with wild-type mice.
P < 0.05 compared with UT-B knockout mice.
Osmolality and urea concentration were measured in plasma under basal conditions. Plasma osmolality was similar in mice of all three genotypes (322 ± 1, 324 ± 2, and 320 ± 1 mosmol/kgH2O, not significant). The urine-to-plasma ratio for osmolality was 5.5 ± 0.3 in UT-A2/B knockout, 4.1 ± 0.2 in UT-B knockout mice, and 6.4 ± 0.3 in wild-type mice (P < 0.01). Plasma urea concentration was significantly higher, and urinary urea concentration significantly lower, in the UT-B knockout mice than in the two other groups. However, both plasma urea concentration and urinary urea concentration in UT-A2/B knockout mice were between those in UT-B null and wild-type mice. The urine-to-plasma ratio of urea concentration in UT-A2/B was also intermediate (Table 1). In contrast, there was no significant difference in sodium, potassium, and chloride concentrations among the three genotypes. Plasma creatinine and creatinine clearance (an index of glomerular filtration rate) were similar in the three groups, suggesting that UT-A2 and UT-B deletion does not influence glomerular hemodynamics (Table 1).
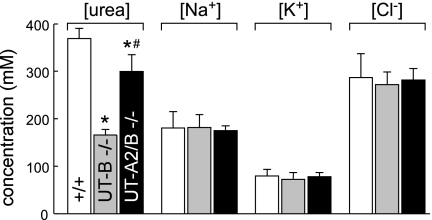
Figure 4 shows the composition of the aqueous component of the inner medulla as measured in the supernatants of centrifuged homogenates of inner medullas in mice of the three genotypes. The inner medullary urea concentration in UT-A2/B knockout mice was between those in wild-type and UT-B knockout mice.
Fig. 4.
Urea concentration, sodium concentration, potassium concentration, and chloride concentration in homogenized inner medullas. Values are means ± SE; n = 6. *P < 0.01 compared with wild-type mice. #P < 0.01 compared with UT-B knockout mice.
UT-A2 plays a role in the long-term accumulation of urea in the inner medulla.
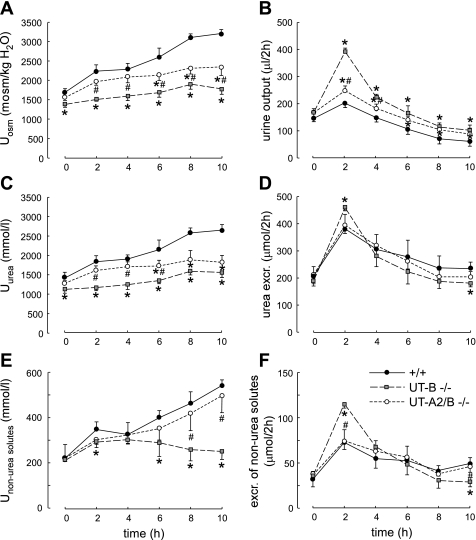
To evaluate the contribution of UT-A2 to the urea-dependent enhancement of urine concentrating capacity, mice of the three genotypes were subjected to an acute modest hyperosmotic urea load (0.3 ml of 1 M urea ip, an amount equal to 1/10 of their daily urea excretion) (1). After a 2-day adaption with the same amounts of food and water intake, wild-type, UT-A2/B knockout, and UT-B knockout mice had similar urine volume and composition [osmolality, urea concentration and excretion, non-urea solute concentration, and excretion in the basal period (time 0 in Fig. 5, A–F)]. After administration of the urea load, urea excretion increased abruptly during the first 2 h in all groups and decreased progressively thereafter, with a similar time course and intensity in mice of the three genotypes (Fig. 5D). However, this increase resulted from a very different pattern of changes in urine concentration and urine flow rate in the three groups. During the early phase (0–4 h), urine osmolality rose more in UT-A2/B knockout than in UT-B knockout mice (Fig. 5A), and urine flow rate rose only modestly, as in wild-type mice. In contrast, UT-B knockout mice exhibited a much higher increase in urine flow rate (Fig. 5B). During the late phase (6–10 h), neither the UT-A2/B knockout mice nor the UT-B knockout mice were able to raise urea concentration in the urine, contrary to wild-type mice (Fig. 5C). Thus, even if UT-A2 deletion on top of UT-B deletion restored a close to normal urine osmolality and flow rate in the 24-h urine collection (Fig. 3), UT-A2 deletion did not allow the kidney to progressively accumulate urea in the medulla after an acute urea load. This suggests that UT-A2 plays a role in the long-term accumulation of urea in the inner medulla.
Fig. 5.
Effect of acute urea loading on urinary concentrating ability and renal handling of urea. Three hundred micromoles of urea were injected (ip) just after the first 2-h urine collection (time 0). A: urinary osmolality (Uosm). B: urinary output. C: urinary urea concentration (Uurea). D: urea excretion (excr.). E: nonurea solute concentration (Unon-urea solutes). F: excretion of non-urea solutes. Values are means ± SE; n = 6. *P < 0.01 compared with wild-type mice. #P < 0.01 compared with UT-B knockout mice.
In the early phase, the large rise in urine flow rate seen in UT-B knockout mice drove an increase in the excretion of urea and non-urea solutes that was greater than in the two other mice models (Fig. 5, D and F). This was followed by a fall in the excretion of non-urea solutes in the late phase for UT-B knockout mice. In contrast, during this late phase, the concentration of non-urea solutes rose continuously in UT-A2/B knockout mice so that the excretion of these solutes remained stable and similar to that in wild-type mice (Fig. 5E).
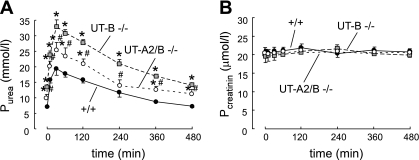
After the urea load, plasma urea rose promptly, reached a peak at 30 min in all groups, and then returned to almost basal values after 8 h. The magnitude of the rise from basal to peak level was different in the three groups. Plasma urea concentration in UT-B knockout mice was the highest (32.7 ± 2.9 mmol/l) compared with UT-A2/B knockout mice (25 ± 2.5 mmol/l) and wild-type mice (19.4 ± 2.2 mmol/l) (Fig. 6A). However, the plasma creatinine level was similar in the three groups (∼20 μmol/l, Fig. 6B), suggesting that the glomerular filtration rate was roughly similar in all genotypes in the basal condition and after the urea load.
Fig. 6.
Plasma urea and creatinine concentration in wild-type, UT-B knockout, and UT-A2/B knockout mice before and after the administration of acute urea load. Values are means ± SE; n = 6. *P < 0.01 compared with wild-type mice. #P < 0.01 compared with UT-B knockout mice.
A high-protein diet did not increase the plasma urea level in UT-A2/B knockout mice.
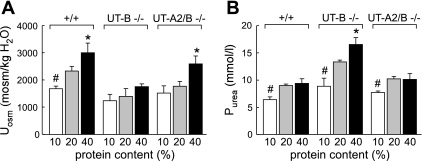
To evaluate how UT-A2/B knockout mice chronically adapt their renal function and plasma urea concentration to different levels of urea excretion, mice of the three genotypes were fed ad libitum a diet containing 10, 20, or 40% protein. The urinary osmolality reached after 1 wk on these diets in each group is shown in Fig. 7A. Urinary osmolality in UT-A2/B knockout mice was consistently lower than that in wild-type mice and higher than that in UT-B knockout mice. The high-protein diet significantly increased urine osmolality in UT-A2/B null mice and wild-type mice, but the low-protein diet did not decrease it significantly. Urinary urea concentrations in the three groups changed in parallel with urinary osmolality (data not shown). The level of protein content in the diet did not modify plasma urea concentration in wild-type and UT-A2/B knockout mice (Fig. 7B). The high-protein diet did not increase the plasma urea concentration in these two genotypes. However, the 40% protein diet significantly increased plasma urea concentration in UT-B knockout mice.
Fig. 7.
Urinary concentrating ability in mice fed diets containing 10, 20, or 40% protein. A: urine osmolality (Uosm). B: plasma urea concentration (Purea). Values are means ± SE; n = 6. *P < 0.01 compared with wild-type mice. #P < 0.01 compared with UT-B knockout mice.
Expression regulation of urea transporters and aquaporins in UT-A2/B knockout mice.
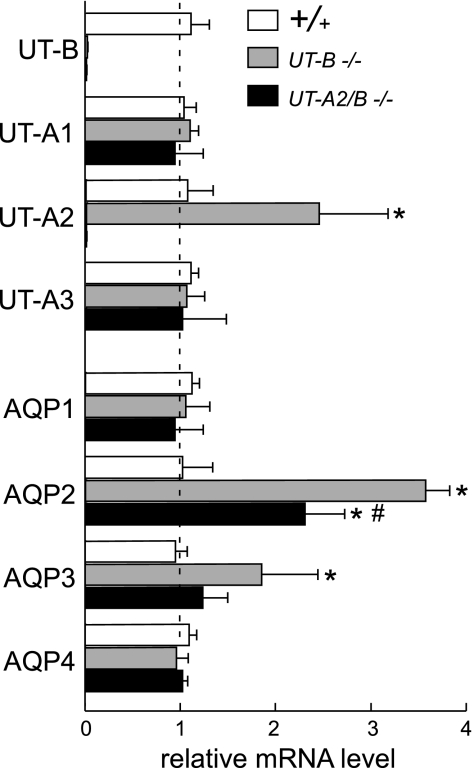
To evaluate whether the simultaneous deletion of UT-A2 and UT-B altered the expression of other UTs and water channel aquaporins (AQPs), the relative quantification of the changes in the abundance of the mRNA was determined by fluorescence-based real-time RT-PCR. The normalized, calibrated ratios of urea transporter and AQP transcript levels are shown in Fig. 8. In the kidneys of UT-B knockout mice, UT-A2, AQP2, and AQP3 mRNA expression was significantly increased, as shown in a previous study (10). In UT-B/A2 knockout mice, there was no UT-B and UT-A2 mRNA expression, as expected. AQP2 mRNA expression was significantly higher than in wild-type mice, but significantly lower than in UT-B knockout mice. In UT-A2/B knockout mice, there was no change in the mRNA expression levels of UT-A1, UT-A3, AQP1, AQP3, and AQP4.
Fig. 8.
Transcript expression of aquaporins (AQPs) and urea transporters (UTs) in the kidney of wild-type, UT-B knockout, and UT-A2/B knockout mice. mRNA expression level for each sample is expressed relative to wild-type kidney, which is arbitrarily considered equal to 1.0 in each individual comparison. Values are means ± SE; n = 5. *P < 0.01 compared with wild-type mice. #P < 0.01 compared with UT-B knockout mice.
DISCUSSION
We report here a new model of urea transporter gene knockout mouse. UT-A2 and UT-B are expressed in the TDL and descending vasa recta, respectively (15). While both urea transporters were believed to play a significant role in the urine concentrating mechanism, UT-B deletion alone caused a significant urea-selective urine concentrating defect (29), but UT-A2 deletion alone did not significantly change urine concentrating ability (25). To study UT-A2 functions in the absence of a possible confounding effect of UT-B, we developed a UT-A2/B double knockout mouse model, which has no detectable UT-A2 and UT-B full-length mRNA and protein expression. Physiological function of UT-A2 can be identified by comparing UT-A2/B knockout mice with UT-B knockout mice.
Both UT-A and UT-B genes are located at the same chromosome (chromosome 18 in the mouse) (6). It was impossible to generate the double UT-A2 and UT-B gene knockout mice by simply breeding single UT-A2 knockout mice with single UT-B knockout mice, because these two genes are closely linked. Our strategy was to delete the UT-A2 gene promoter by targeted gene replacement in UT-B gene-targeted ES cells to stop both UT-A2 and UT-B expression and function. Without significant upregulation of aquaporin and other urea transporter expression in this model, the results indicate that UT-A2 deletion partially remedies the defect in renal urea handling caused by UT-B deletion.
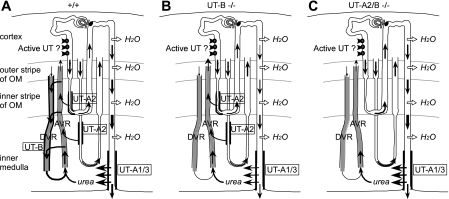
Adult UT-A2/B knockout mice exhibited a modest urinary concentrating defect with mild polyuria, urine hypoosmolality, and a significant responsiveness to water deprivation. Somewhat surprisingly, this pattern of nephrogenic diabetes insipidus was substantially less severe and differed from that in the UT-B knockout mouse model. UT-A2/B double knockout mice exhibited a milder phenotype that made them resemble wild-type mice. Compared with UT-B single knockout mice, UT-A2/B double knockout mice had a less severe urine concentrating defect, better accumulation of urea in the inner medulla, and less elevated plasma urea concentration. At variance with UT-B single knockout, an acute urea load allowed them to raise urea concentration in their urine within a few hours. However, their urine urea did not keep increasing for a longer time as observed in wild-type mice. Intriguingly, the double knockout mice were able to raise the concentration of other solutes almost as well as did wild-type mice. In protein diet experiments, a high-protein diet increased their urine urea concentration and did not increase their plasma urea concentration. Conversely, a low-protein diet did not significantly change urine urea, but decreased plasma urea in UT-A2/B knockout mice. Taken together, these results suggest that, in wild-type mice, UT-B (in vasa recta) and UT-A2 (in thin limbs) contribute to the intrarenal cycling of urea and in the generation of a concentrated urine in different ways (Fig. 9) because the deletion of one or both of the transporters induced opposite changes.
Fig. 9.
Schematic diagrams that illustrate urea cycling pathways in wild-type (A) UT-B knockout (B), and UT-A2/B knockout (C) mice. A significant amount of urea is assumed to be secreted by an active transport in the pars recta of both short and long loops in the deep cortex and outer stripe of outer medulla (OM) in all genotypes. In wild-type mice, urea is cycling between the ascending (AVR) and descending vasa recta (DVR) via UT-B-mediated fluxes, and also between descending limb of loops of Henle and AVR immediately followed by transfer from ascending to DVR, via UT-A2 and UT-B-mediated fluxes, respectively. Both of those pathways are disrupted in UT-B knockout mice, in which less urea goes to the inner medulla and more urea to blood circulation. The additional UT-A2 deletion in UT-B knockout mice promotes urea cycling through the collecting duct and improves the urine concentrating capability, compared with the single UT-B knockout mice.
To explain the milder urine concentrating defect induced by the deletion of UT-A2 on top of UT-B, we postulate that, when UT-A2 is normally expressed in the TDL, a significant amount of urea is added to the ascending vasa recta, i.e., that urea is reabsorbed rather than secreted (as previously assumed) through UT-A2. In rats, and even more so in mice, TDL of short looped nephrons are in close proximity to ascending vasa recta in the vascular bundles throughout the inner stripe of the outer medulla (12). A passive diffusion of urea from TDL to ascending vasa recta could take place only if there is an outward-directed urea concentration gradient across the TDL epithelium (Fig. 9A). Such a gradient can be generated by an active urea secretion into the pars recta, as previously proposed (2, 28). Urea secretion has been postulated recently because of the high fractional excretion of urea observed in wild-type mice (5, 28), as also in this study (Table 1).
The defect in the urine concentrating ability of UT-B knockout mice is most likely due to the dramatic reduction in countercurrent exchange of urea from ascending to descending vasa recta, as discussed previously (1, 3, 28). The impaired vascular countercurrent exchange compromises urea delivery to the inner medulla via the descending vasa recta, augments the lag in the vascular urea concentration and osmolality of the interstitial fluid, and increases blood flow in the deep inner medulla, thus resulting in a decrease in urine osmolality (Fig. 9B). This interpretation is consistent with simulation results in a modeling study (13).
The simultaneous deletion of both the vasa recta and the TDL urea transporters resulted in a significantly milder defect in the urine concentrating ability than the deletion of UT-B alone. In the UT-A2/B double knockout, substantially less urea is reabsorbed from the short TDL in the inner stripe, compared with wild-type or UT-B knockout mice. Instead, that urea is delivered, via the ascending limb and distal tubule, into the collecting duct and returned to the inner medulla (Fig. 9C). This alternative mechanism for cycling urea in the absence of UT-A2 results in a urine concentrating capability that exceeds that of the UT-B single knockout, in which the urea reabsorbed from the inner stripe short TDL segment leaves the medulla via the ascending vasa recta.
The fact that the concentration of non-urea solutes raised continuously in the urine of the double knockout mice for 10 h after the urea load, as it did in wild-type mice, confirms that, contrary to previous assumptions, NaCl accumulation in the inner medulla does not depend on prior urea accumulation, as also deduced from experiments in UT-A1/3 knockout mice (7).
Experiments that showed no urine concentrating defect in single UT-A2 knockout mice were based on 24-h urine collection in steady-state conditions or after a slow and progressive rise in urine concentration due to water deprivation (25). In contrast, the present experiments included an acute perturbation of the steady state (urea load) and urine collection every 2 h for 10 h. This revealed a marked defect in mice with UT-A2 deletion (on top of UT-B deletion). The fact that these mice were unable to raise urine urea concentration despite a close to normal rise in the concentration of non-urea solutes in the last 4 h of the experiment revealed a significant role for UT-A2 in the progressive and selective accumulation of urea in the inner medulla after a sudden change in urine concentration. This role of UT-A2 should probably also be detectable in single UT-A2 knockout mice after experimental protocols inducing abrupt changes in the osmotic gradient of the medulla and fractionated urine collection.
In summary, the present experiments have allowed us to evaluate some aspects of UT-A2 function by comparing mice with and without UT-A2 expression in a model lacking UT-B, another possibly confounding urea transporter. We studied the mice in basal conditions and after either a chronic or an acute challenge (change in protein intake or acute urea load, respectively). The main results show that the urine concentrating defect of UT-B knockout mice was partially corrected by the simultaneous deletion of UT-A2 but that urea concentration did not rise in the urine in the late phase of the urea load experiment. Taken together, these results suggest a novel role for UT-A2 in the concentrating mechanism. UT-A2 might contribute to the accumulation of urea in the inner medulla during transition from diuresis to antidiuresis rather than to maintenance of a high urea concentration during steady state. This hypothesis could be tested in further studies using single UT-A2 mice, submitted to acute changes in water and urea handling.
GRANTS
This work was supported by National Natural Science Foundation of China Grants 30870921 and 81170632 (B. Yang) and 30370572 (X. Zhao), 985 Projects of Ministry of Education of China 985-2-094-121 (B. Yang), and National Institute of Diabetes and Digestive and Kidney Diseases Grant DK089066 (A. T. Layton). Part of this study was presented at the 2010 Experimental Biology Annual Meeting and published in abstract form as Generation and phenotype of a transgenic knockout mouse lacking the urea transporters UT-A2 and UT-B.
DISCLOSURES
No conflicts of interest, financial or otherwise, are declared by the authors.
AUTHOR CONTRIBUTIONS
T. Lei, L. Zhou, H. Zhou, and B. Yang performed experiments; T. Lei, L. Zhou, A. T. Layton, H. Zhou, X. Zhao, and B. Yang analyzed data; T. Lei, L. Zhou, A. T. Layton, H. Zhou, L. Bankir, and B. Yang interpreted results of experiments; T. Lei and B. Yang prepared figures; T. Lei and B. Yang drafted the manuscript; T. Lei, A. T. Layton, L. Bankir, and B. Yang edited and revised the manuscript; T. Lei, L. Zhou, A. T. Layton, H. Zhou, H. Zhou, L. Bankir, and B. Yang approved final version of the manuscript; and B. Yang provided conception and design of research.
REFERENCES
- 1. Bankir L, Chen K, Yang B. Lack of UT-B in vasa recta and red blood cells prevents the urea-induced improvement in urinary concentrating ability. Am J Physiol Renal Physiol 286: F144–F151, 2004 [DOI] [PubMed] [Google Scholar]
- 2. Bankir L, Trinh-Trang-Tan MM. Urea and the kidney. In: The Kidney (6th ed.), edited by Brenner BM. Philadelphia, PA: Saunders, 2000, p. 637–679 [Google Scholar]
- 3. Fenton RA. Urea transporters and renal function: lessons from knockout mice. Curr Opin Nephrol Hypertens 17: 513–518, 2008 [DOI] [PubMed] [Google Scholar]
- 4. Fenton RA. Essential role of vasopressin-regulated urea transport processes in the mammalian kidney. Pflügers Arch 458: 169–177, 2009 [DOI] [PubMed] [Google Scholar]
- 5. Fenton RA, Chou CL, Stewart GS, Smith CP, Knepper MA. Urinary concentrating defect in mice with selective deletion of phloretin-sensitive urea transporters in the renal collecting duct. Proc Natl Acad Sci USA 101: 7469–7474, 2004 [DOI] [PMC free article] [PubMed] [Google Scholar]
- 6. Fenton RA, Cottingham CA, Stewart GS, Howorth A, Hewitt JA, Smith CP. Structure and characterization of the mouse UT-A gene (Slc14a2). Am J Physiol Renal Physiol 282: F630–F638, 2002 [DOI] [PubMed] [Google Scholar]
- 7. Fenton RA, Flynn A, Shodeinde A, Smith CP, Schnermann J, Knepper MA. Renal phenotype of UT-A urea transporter knockout mice. J Am Soc Nephrol 16: 1583–1592, 2005 [DOI] [PMC free article] [PubMed] [Google Scholar]
- 8. Fenton RA, Knepper MA. Urea and renal function in the 21st century: insights from knockout mice. J Am Soc Nephrol 18: 679–688, 2007 [DOI] [PubMed] [Google Scholar]
- 9. Klein JD, Fröhlich O, Blount MA, Martin CF, Smith TD, Sands JM. Vasopressin increases plasma membrane accumulation of urea transporter UT-A1 in rat inner medullary collecting ducts. J Am Soc Nephrol 17: 2680–2686, 2006 [DOI] [PubMed] [Google Scholar]
- 10. Klein JD, Sands JM, Qian L, Wang X, Yang B. Upregulation of urea transporter UT-A2 and water channels AQP2 and AQP3 in mice lacking urea transporter UT-B. J Am Soc Nephrol 15: 1161–1167, 2004 [DOI] [PubMed] [Google Scholar]
- 11. Knepper MA, Mindell JA. Molecular coin slots for urea. Nature 462: 733–734, 2009 [DOI] [PubMed] [Google Scholar]
- 12. Kriz W. Structural organization of the renal medulla: comparative and functional aspects. Am J Physiol Regul Integr Comp Physiol 241: R3–R16, 1981 [DOI] [PubMed] [Google Scholar]
- 13. Layton AT. Role of UT-B urea transporters in the urine concentrating mechanism of the rat kidney. Bull Math Biol 69: 887–929, 2007 [DOI] [PubMed] [Google Scholar]
- 14. Levin EJ, Quick M, Zhou M. Crystal structure of a bacterial homologue of the kidney urea transporter. Nature 462: 757–761, 2009 [DOI] [PMC free article] [PubMed] [Google Scholar]
- 15. Promeneur D, Rousselet G, Bankir L, Bailly P, Cartron JP, Ripoche P, Trinh-Trang-Tan MM. Evidence for distinct vascular and tubular urea transporters in the rat kidney. J Am Soc Nephrol 7: 852–860, 1996 [DOI] [PubMed] [Google Scholar]
- 16. Sands JM. Mammalian urea transporters. Annu Rev Physiol 65: 543–566, 2003 [DOI] [PubMed] [Google Scholar]
- 17. Sands JM. Critical role of urea in the urine-concentrating mechanism. J Am Soc Nephrol 18: 670–671, 2007 [DOI] [PubMed] [Google Scholar]
- 18. Shayakul C, Hediger MA. The SLC14 gene family of urea transporters. Pflügers Arch 447: 603–609, 2004 [DOI] [PubMed] [Google Scholar]
- 19. Shayakul C, Knepper MA, Smith CP, DiGiovanni SR, Hediger MA. Segmental localization of urea transporter mRNAs in rat kidney. Am J Physiol Renal Physiol 272: F654–F660, 1997 [DOI] [PubMed] [Google Scholar]
- 20. Shayakul C, Steel A, Hediger MA. Molecular cloning and characterization of the vasopressin-regulated urea transporter of rat kidney collecting ducts. J Clin Invest 98: 2580–2587, 1996 [DOI] [PMC free article] [PubMed] [Google Scholar]
- 21. Smith CP. Mammalian urea transporters. Exp Physiol 94: 180–185, 2009 [DOI] [PubMed] [Google Scholar]
- 22. Spector DA, Yang Q, Wade JB. High urea and creatinine concentrations and urea transporter B in mammalian urinary tract tissues. Am J Physiol Renal Physiol 292: F467–F474, 2007 [DOI] [PubMed] [Google Scholar]
- 23. Stewart G. The emerging physiological roles of the SLC14A family of urea transporters. Br J Pharmacol 2011; March 30 doi: 10.1111/j.1476-5381.2011.01377.x. [Epub ahead of print] [DOI] [PMC free article] [PubMed] [Google Scholar]
- 24. Tsukaguchi H, Shayakul C, Berger UV, Tokui T, Brown D, Hediger MA. Cloning and characterization of the urea transporter UT3: localization in rat kidney and testis. J Clin Invest 99: 1506–1515, 1997 [DOI] [PMC free article] [PubMed] [Google Scholar]
- 25. Uchida S, Sohara E, Rai T, Ikawa M, Okabe M, Sasaki S. UT-A2 Impaired urea accumulation in the inner medulla of mice lacking the urea transporter UT-A2. Mol Cell Biol 25: 7357–7363, 2005 [DOI] [PMC free article] [PubMed] [Google Scholar]
- 26. Wade JB, Lee AJ, Liu J, Ecelbarger CA, Mitchell C, Bradford AD, Terris J, Kim GH, Knepper MA. UT-A2: a 55-kDa urea transporter in thin descending limb whose abundance is regulated by vasopressin. Am J Physiol Renal Physiol 278: F52–F62, 2000 [DOI] [PubMed] [Google Scholar]
- 27. Xu Y, Olives B, Bailly P, Ripoche P, Fisher E, Ronco P, Cartron JP, Rondeau E. Endothelial cells of the kidney vasa recta express the urea transporter HUT11. Kidney Int 51: 138–146, 1997 [DOI] [PubMed] [Google Scholar]
- 28. Yang B, Bankir L. Urea and urine concentrating ability: new insights from studies on mice. Am J Physiol Renal Physiol 288: F881–F896, 2005 [DOI] [PubMed] [Google Scholar]
- 29. Yang B, Bankir L, Gillespie A, Epstein CJ, Verkman AS. Urea-selective concentrating defect in transgenic mice lacking urea transporter UT-B. J BIol Chem 277: 10633–10637, 2002 [DOI] [PubMed] [Google Scholar]


