Abstract
Two-photon (2P) optical properties of cyanine dyes were evaluated using a 2P fluorescence spectrophotometer with 1.55 μm excitation. We report the 2P characteristics of common NIR polymethine dyes, including their 2P action cross-sections and the 2P excited fluorescence lifetime. One of the dyes, DTTC showed the highest 2P action cross-section (~103 ± 19 GM) and relatively high 2P excited fluorescence lifetime and can be used as a scaffold for the synthesis of 2P molecular imaging probes. The 2P action cross-section of DTTC and the lifetime were also highly sensitive to the solvent polarity, providing other additional parameters for its use in optical imaging and the mechanism for probing environmental factors Overall, this study demonstrated the quantitative measurement of 2P properties of NIR dyes and established the foundation for designing molecular probes for 2P imaging applications in the NIR region.
Keywords: imaging, cyanine dyes, solvatochromism, fluorescence lifetime
INTRODUCTION
Two photon (2P) imaging has made a significant contribution to the field of microscopy in the last two decades. 2P excitation of exogenous and endogenous fluorophores optically active in the visible range provides three-dimensional sectioning, reduces the out-of-focus background associated with single photon (1P) excitation, attenuates scattering, and achieves higher depth penetration in the biological tissue. As a result, the finest details of the cell architecture can be exposed and the cell machinery investigated. A conventional 2P system operates in the NIR excitation (750–1000 nm) and visible emission (375–600 nm) wavelengths, which efficiently excites endogenous fluorophores such as elastin, collagen, and flavoproteins, providing valuable intrinsic structural and biochemical information during intravital imaging.1 However, such visible autofluorescence restricts molecular imaging with exogenous contrast agents, particularly when target concentrations are low. Additionally, operating in the visible range limits depth penetration due to the scattering and re-absorption of the emitted light.
To overcome these problems, we recently proposed a complementary regime for 2P imaging, using NIR dyes absorbing and emitting at 700–900 nm. In our previous report,2 we demonstrated that this all-infrared approach for 2P imaging virtually eliminated background fluorescence, minimized light scattering, and enabled high contrast imaging of tissue. A recent study has extended our fiber-based, turnkey ultrafast lasers to all-fiber based 2P endomicroscopy.3 This feasibility prompted us to develop fluorescent probes with high 2P excited fluorescence (action) cross-section to fully harness the advantage of 2P in deep tissue imaging.
In this study, our primary goals were to select the dyes with large 2P action cross-section, evaluate their sensitivities to the environment, and identify a lead compound for further modifications to generate a library of 2P molecular probes for in vivo imaging applications. As a first step to achieving these goals, we characterized a number of NIR dyes commonly used for optical imaging in deep tissue using conventional 1P methods4–6 and demonstrated the utility of the selected probe in 2P excited fluorescence imaging of thick tissue.
MATERIALS AND METHODS
Samples preparation
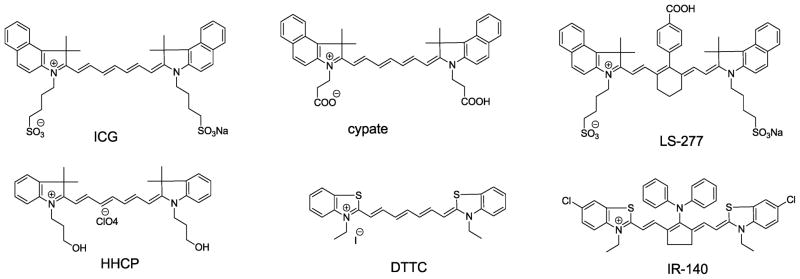
Solvents were purchased from Fisher Scientific. Millipore quality water was used throughout the work. NIR dyes (Figure 1) ICG (Cardiogreen), DTTC (3,3′-diethylthiatricarbocyanine perchlorate), IR-140, Styryl 9M were received from Sigma-Aldrich Inc. and used without purification. Cypate and LS-277 were synthesized according to our previously published protocols.7 Dye HHCP was a gift from General Electric. For 1P absorption and fluorescence measurements, the samples were dissolved in DMSO, so the total concentration of the dye did not exceed 0.2 absorbance units at the wavelength of excitation. For solvents other than DMSO (water, methanol, ethanol, acetone, dimethylene chloride (DCM) the aliquots of dyes (~10 μL)) were diluted with the solvent of interest down to an absorbance of ≤0.2. For 2P measurements, stock solutions of each compound in the solvent were diluted to lower concentrations made through serial dilution from stock. At each concentration, approximately 50 μL of solution was pipetted onto a well slide, covered, and sealed. The sample was then mounted vertically in front of the objective lens for measurement.
Figure 1.
Structures of the NIR dyes investigated for 2P optical properties.
1P optical characterization
Absorption spectra were recorded on a Beckman Coulter DU 640 UV-visible spectrophotometer. Fluorescence spectra were conducted on a Fluorolog-3 spectrofluorometer (Horiba Jobin Yvon, Inc., Edison, NJ) using excitation at 720 nm, emission scan from 735–950 nm. All measurements were conducted at room temperature.
1P fluorescence lifetimes (FLT) were measured using time-correlated single photon counting (TCSPC, Horiba) with a 700 nm excitation source NanoLed® (impulse repetition rate 1 MHz) at 90° to the detector (R928P, Hamamatsu Photonics, Japan) as described previously.8 1P absorption and emission cross sections were calculated from molar absorptivities and fluorescence quantum yields using the following equations:
| Eq. 1 |
| Eq. 2 |
where σ1P,776 1P absorption cross section, cm2, ε776 – molar absorptivity at the 776 nm, σ1P,em – 1P action cross section, cm2, Q1P – 1P fluorescence quantum yield
The fluorescence quantum yields of the dyes and a reference dye Styryl 9M were measured using a comparative method using ICG in DMSO (Q = 0.12)9 as a standard at 700 nm for Styryl 9M and 720 nm (for other dyes).
2P optical characterization
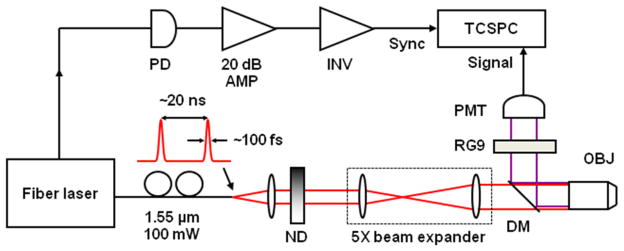
The previously reported 2P imager was modified for steady-state and time-resolved studies (Figure 2). The excitation light was provided by a mode-locked femtosecond fiber laser (Mercury 1000, PolarOnyx) delivering 100 mW of average power centered at 1.55 μm (1552 nm). At the output of the fiber, the pulse duration was 100 fs with a nominal repetition rate of 50 MHz. The light was collimated and passed through neutral density filters for controlling the incident power on the sample. The beam was expanded by a factor of 5, directed through a dichroic mirror (LP02-980RS, Semrock), and focused onto the sample using a 20x, 0.8-NA objective lens (Zeiss Plan-Apochromat.) Two-photon epifluorescence from the sample was collected through the same objective and directed towards the detector using the dichroic mirror. The detector was a thermoelectrically cooled, red-enhanced photomultiplier tube (PMT) (PMC-100-20, Becker-Hickl). The laser seed monitor was used to trigger a TCSPC card (SPC-730, Becker-Hickl). The seed signal was first detected using a high speed InGaAs photodiode (DET10C, Thorlabs), amplified by 20dB using a low-noise, wideband RF amplifier (ZFL-500, Mini-Circuits) and inverted (PPI, Becker-Hickl). Although the PMT cathode sensitivity appeared to be negligible at the excitation wavelength, residual excitation light was further removed using a 1 mm thick RG9 (Schott) glass filter. This filter also served to minimize stray light in the visible wavelength range. The entire instrument was enclosed in a covered black box to eliminate ambient light. The collected TCSPC photon counts and lifetime curves were analyzed with SPCM and SPCImage software (Becker-Hickl). 2P excited FLT were measured using the aforementioned approach of 1P excited FLT.
Figure 2.
Pictures and schematic diagram of a near infrared multiphoton microscopy instrument. PD, photodiode; INV, inverter; ND, neutral density filter; DM, dichroic mirror; OBJ, objective lens; RG9, Schott filter; PMT, photomultiplier tube; TCSPC, time-correlated single photon counting card.
2P absorption and cross section calculations
Two photon action cross-sections of the dyes were calculated using a comparative method with a commercially available dye Styryl 9M previously suggested as a reference standard.10 For that, a number of emitted photons F(λ) after the 2P excitation pulse were measured across the whole emission spectra. This number was used to calculate the 2P action cross-section (Eq. 3). The refractive index n is incorporated to take into account the optical difference in solvent systems.11 (See the discussion regarding the refractive index in the Results and Discussion section)
| Eq. 3 |
where c – concentration, n – refractive index, F(λ) – photon counts, subscripts: S - sample, R - reference (Styryl 9M), σ2P,em – 2P action cross section, cm2
The 2P action cross-section of Styryl 9M was derived from Eq. 4.
| Eq. 4 |
where σ2P,abs,R = 8.4 GM in chloroform,10 The 1P fluorescence quantum yield of Styryl 9M in chloroform was measured relative to a common standard ICG in DMSO and determined as Q1R =0.54 ±12%.
2P absorption cross-sections σ2P,abs′ of the investigated dyes were calculated from Eq. 5:
| Eq. 5 |
The accuracy of measurement of total number of photons was ~ 20% and a typical error in measuring fluorescence quantum yield is 10%.
2P imaging in ex- vivo
All animal studies were performed in compliance with the Washington University School of Medicine Animal Studies Committee requirements for the humane care and use of laboratory animals in research. For kidney samples, ten-week-old male NCR nude mice were anesthetized with ketamine and xylazine (100 mg/kg and 10 mg/kg IP, respectively) and injected with 0.5 mg/kg of DTTC (in 100 μL PBS, IV). Mice were euthanized 15 minutes after injection by cervical dislocation under anesthesia. Kidney tissue was removed, rinsed in PBS, blotted dry and snap-frozen in OCT. Samples were stored at −80 °C. For imaging, tissues were thawed at room temperature for 30 minutes and coverslipped prior to 2P microscopy. Raster scanning of the laser beam was performed with a galvanometric mirror pair (6215H, Cambridge Technology), which provided the line and frame sync signals to the TCSPC card. Images were acquired with 20X, 0.8 NA objective with 1 mm working distance at 20 micron steps using the 2P microscope setup described previously.2
RESULTS AND DISCUSSION
1P and 2P optical properties of the NIR dyes
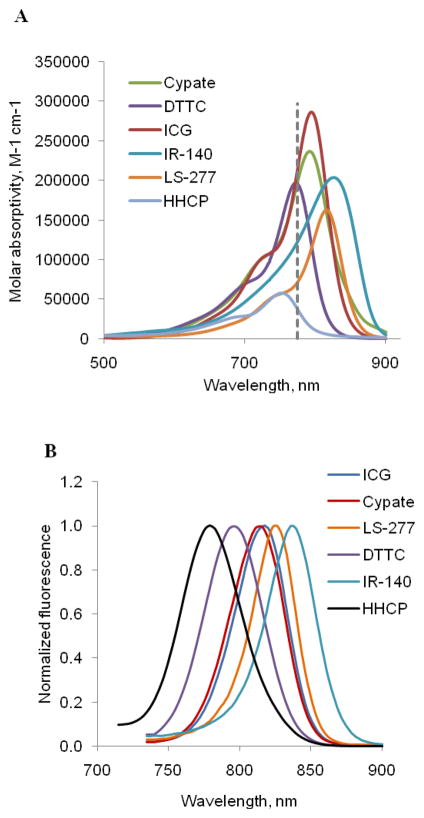
As shown in Figure 1, the dyes share the same conjugated polymethine skeleton modified by the presence of different groups. They exhibited absorption and emission spectra in the 700–900 nm range (Figure 3). All dyes demonstrate high 1P molar absorptivities at 776 nm corresponding to half the 2P excitation wavelength of 1.55 μm (vertical dotted line) and were therefore suitable for 2P excitation with this light source.
Figure 3.
(A) 1P molar absorptivities of selected dyes in DMSO. Vertical dotted line corresponds to a laser light at 1552/2=776 nm. (B) Normalized fluorescence of the dyes after 1P excitation at 720 nm (emission scan 735–900 nm).
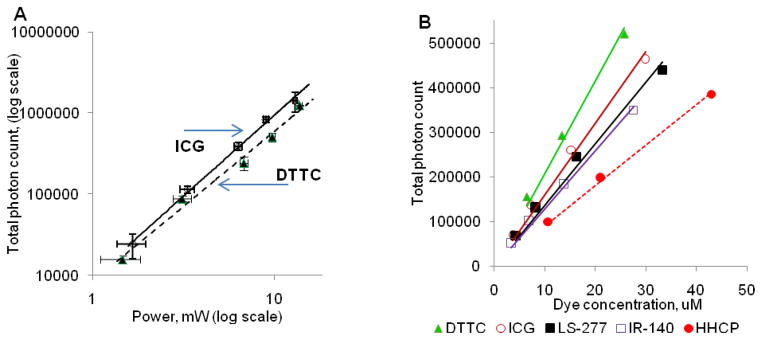
To verify that the measured fluorescence signals from the studied dyes at 1.55 μm excitation were due to a nonlinear absorption, the power dependence of the fluorescence signal was investigated. For a 2P process, the total fluorescence photon count due to the simultaneous absorption of two incident photons scales quadratically with the change of an incident power. Indeed, the slopes of the fluorescence signal on excitation power on a log-log plot for two selected dyes ICG and DTTC were close to 2, thus verifying a 2P excitation mechanism of the dyes (Figure 4, A).
Figure 4.
(A) 2P excited fluorescence of selected cyanine dyes as a function of incident laser power. Dye concentration in DMSO: ICG - 12 μM, DTTC - 8 μM; integration time 1 sec. Slopes: ICG: 1.9 ±0.15, R2 = 0.988; DTTC: 2.0 ±0.15, R2 = 0.997. Quadratic dependence of the fluorescence signal on excitation power is indicative of a 2P process. (B) 2P NIR fluorescence from all the dyes demonstrate a linear dependence on concentration (solvent: DMSO, laser power: 5 mW, pixel integration time: 1 sec)
The measured 2P excited fluorescence exhibited a linear dependence on concentration for all the compounds, as shown in Figure 4, B. This linear dependence of the signal is important in quantitative spectroscopy and imaging, allowing for correlation of the measured fluorescence with the fluorophore concentration. Technically, from these curves, the absolute 2P action cross section could be calculated, following the method reported by Xu and Webb.12 However, such absolute measurement requires a precise characterization of the laser beam’s temporal profile, which has been broadened due to material dispersion of various optical elements. In addition, the profile is particularly challenging to characterize at the focal plane of high numerical aperture objectives commonly used in 2P imaging. Instead a comparative method using a recently proposed standard (Styryl 9M) with a known 2P absorption cross-section can be utilized.13 The 2P absorption cross-section (σ2R) of this reference dye upon excitation with 1550 nm has been reported as 8.4 GM (in chloroform) with the relative error ± 15%.10 In our experiments, each set of measurements was conducted in parallel with a sample of Styryl 9M using similar concentrations under identical excitation conditions. The generated emission photons F(λ) were counted across the emission spectra to calculate 2P action cross-sections (see the Materials and Methods section).
The measured 1P and 2P optical properties of the dyes are tabulated in Table 1. The table features 1P steady state absorption and emission maxima as well as molar absorptivities of the dyes in DMSO. The choice of DMSO was dictated by blood mimicking polarity properties.14 The 1P cross-section at 776 nm (corresponding to the excitation of the dyes with 1552 nm) was determined from molar absorptivities. The calculations of the 2P cross-sections include the correction factor on the refractive indexes of the sample (DMSO) and the reference solvent (chloroform). To correct the 2P cross-section for the solvent, the refractive index for 2P spectroscopy has to be defined. The commonly reported refractive indexes (nD) utilize the second D line of sodium, which corresponds to 589 nm. However, refractive index is wavelength dependent and typically decreases with increasing the wavelength of measurement. In the 2P process, the refractive index can be considered as a composite value of two photophysical events, excitation at 1552 nm and emission at 700–900 nm, and therefore an average index has to be used. It is possible to show that the ratio of the two average refractive indexes from can be calculated using Eq. 6.
Table 1.
One- and two-photon properties of the NIR dyes in DMSO.
| Compound | λabs, nm | λem, nm | εabs, M−1cm−1 | ε776, M−1cm−1 | σ1P,776, cm21014 | Q1P | τ1P, ns | τ2P, ns | σ2P,1552, GM | σ2P,em, G |
|---|---|---|---|---|---|---|---|---|---|---|
| ICG | 794 | 817 | 286,000 | 214,800 | 8.22 | 0.12 | 0.97 | 0.96 | 590 | 71 |
| cypate | 796 | 817 | 237,000 | 119,200 | 7.63 | 0.13 | 0.87 | 0.88 | 520 | 63 |
| LS-277 | 809 | 829 | 163,000 | 72,000 | 2.75 | 0.07 | 0.98 | 0.99 | 900 | 63 |
| HHCP | 753 | 780 | 58,000 | 35,500 | 1.36 | 0.17 | 1.34 | 1.25 | 240 | 40 |
| DTTC | 771 | 800 | 197,000 | 196,000 | 7.49 | 0.64 | 1.49 | 1.47 | 160 | 100 |
| IR-140 | 825 | 820 | 204,000 | 123,400 | 4.72 | 0.0617 | 1.02 | 0.95 | 950 | 57 |
λabs – absorption maximum, λem – emission maximum, εabs - molar absorptivity at the absorption maximum, ε776 - molar absorptivity at the excitation Q1P – 1P fluorescence quantum yield, σ1P,776 – 1P cross section, τ1P - 2P excited fluorescence lifetime, τ2P - 2P excited fluorescence lifetime, σ2P,1552 – 2P absorption cross section, σ2P,em – 2P action cross section (σ2P,em = σ2P,1552 × Q1P)
| Eq. 6 |
where and are the average refractive indexes for the sample and reference solvent, nem and n1552 is the refractive index of pure solvents at emission wavelengths and 1552 nm correspondingly.
Literature data of refractive indexes of solvents at different wavelengths is scarce with only several publications reporting data for 1550 nm.15,16 With the data published for water, methanol, acetone, and DMSO, the ratio of the two refractive indexes was found to be within 1% difference to that of measured at 589 nm. Hence, the wavelength effect can be considered negligible for the studied solvents and more convenient well-known nD values can be safely used.
These results demonstrate that changes in the dye structures moderately affect the 2P emission properties. Changes in functional groups at distal positions to the chromophore core, such as replacing a sulfonate group (in ICG) with carboxylic groups (as in cypate) had a limited impact on the 2P cross-section (71 and 63 GM correspondingly). The two dyes share identical benzo[e]indol heptamethine type fluorophores in their structure and have similar fluorescence lifetime, molar absorptivities and fluorescence quantum yields. The presence of substituents in the meso-position (IR-140, LS-277) had also a limited effect on the 2P action cross-section (57 and 63 GM correspondingly). It is important to note that the excitation wavelength for the used laser is fixed at 1552 nm, which leads to the use of suboptimal excitation wavelengths for some of the dyes. Thus, the peak 2P cross-sections for these compounds are likely to exceed the values determined in this study.
2P absorption cross-sections were calculated from the corresponding fluorescence quantum yields (measured under 1P excitation). ICG and cypate demonstrated similar values of 2P absorption cross-sections within experimental error: ~590 ±110 GM and ~520 ±94 GM for ICG and cypate, respectively. Incorporating the phenyl group in the meso position as in LS-277 and diphenylamine in IR-140 substantially increases the 2P absorption cross-section (900 ±160 and 950 ±240 GM, respectively). However, due to the low fluorescence quantum yield, their emission cross-sections were among the lowest for the dyes used in this study. In contrast, DTTC, despite its low absorption cross-section, demonstrated the highest emission cross section and was therefore chosen for further studies.
In our 2P cross-section calculations we utilized fluorescence quantum yields determined for a 1P excitation process (Q1P or Q1S). Since in a 2P excitation process two photons are absorbed, the fluorescence quantum yield under 2P excitation conditions should be approximately equal to half of that of 1P (Eq. 7).
| Eq. 7 |
The results are in accordance with Kasha-Vavilov rule, which states that the quantum yield of luminescence is independent of the wavelength of irradiation for 1P excitation process if the processes proceed through the same de-excitation mechanism. Our results with fluorescence lifetime measurements validated this Eq. 7. The 2P excited fluorescence lifetimes for all studied samples were monoexponential and remarkably close to the 1P values, within 5% (Table 1), suggesting identical 1P and 2P mechanisms of de-excitation.
Solvatochromic properties under 2P excitation
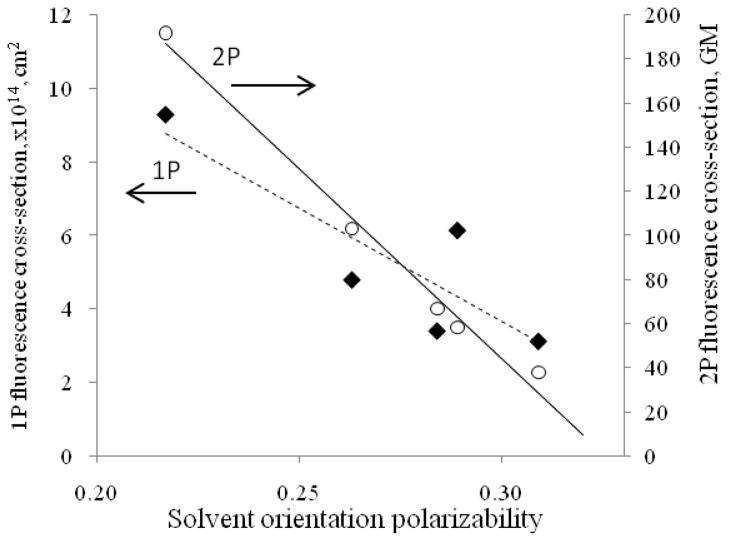
Next, we investigated the solvatochromic properties of the dyes under 2P excitation. These properties can be used to assess the highly heterogeneous nature of biological tissue. Our previous study showed that biomacromolecules such as serum proteins with binding pockets of different hydrophobicities form strong complexes with NIR probes. This molecular interaction affects the dye’s 1P optical parameters, including the absorption and emission maxima and the fluorescence lifetime.18 Solvatochromic properties of NIR dyes can be tuned for higher sensitivity, which can be utilized in the design of new contrast probes. For example, we recently developed a cyanine NIR dye with fluorescence lifetime sensitivity for noninvasive monitoring of renal function in vivo by fluorescence lifetime.19 In this work, we investigated the 2P optical solvatochromic properties of two dyes: DTTC, due to its high 2P emission cross-section, and ICG, a standard NIR dye used for in vivo applications. The polarity was defined in terms of solvent orientation polarizability20 derived as a combination of dielectric constant and refractive index. Solvents (water, methanol, ethanol, acetone, DMSO and DCM) were selected to cover a wide range of solvent orientation polarizabilities from polar (0.320 – water) to non-polar (0.217 – DCM) mediums.
As shown in Figure 5 and Table 2, the results demonstrate significant sensitivity of 2P action cross-section of DTTC (~5X) and ICG (~11X) on solvent polarity. Non-polar environments resulted in an increase in 2P action cross-section leading to a strong emission enhancement. This feature is enhanced ~5X for 2P excitation relative to the effect of solvent polarity on the 1P emission cross-section, which was found to be ~3X (Figure 5). The results show that the 2P excitation action cross section has a larger solvent polarization dynamic response than the 1P excitation. It should be noted that the 2P solvatochromic properties of visible dyes have been observed previously,21–23 but these studies were mostly in the context of the spectral shifts in accordance with the Lippert-Mataga model.20,24 To the best of our knowledge, the change and the linear trend in 2P cross-section as a function of solvent polarity has not been reported.
Figure 5.
DTTC 1P and 2P excited fluorescence cross-section as a function of solvent polarity (data points from left to right: methanol, ethanol, acetone, DMSO and DCM). Solvent orientation polarizabilities for each solvent were calculated previously.8
Table 2.
Solvent dependent 2P optical properties of ICG and DTTC
| Solvent | nD | Δf | σ2P,1552 (GM) | σ2P,em (GM) | σ2P,1552 (GM) | σ2P,em (GM) | τ2P, (ns) |
|---|---|---|---|---|---|---|---|
| ICG | DTTC | ||||||
| water | 1.3325 | 0.320 | 210 | 6.3 | weak fluorescence | ||
| methanol | 1.3200 | 0.309 | 390 | 35 | 74 | 38 | 1.12 |
| ethanol | 1.3578 | 0.289 | 310 | 34 | 66 | 58 | 1.24 |
| acetone | 1.3600 | 0.284 | 630 | 32 | 130 | 67 | 1.26 |
| DMSO | 1.4790 | 0.263 | 590 | 74 | 160 | 100 | 1.47 |
| DCM | 1.4200 | 0.217 | weak fluorescence | 240 | 190 | 1.97 | |
Δf – solvent orientation polarizability, the values were calculated in ref8
The observed 2P sensitivity provides an important opportunity in imaging as a novel contrast mechanism. As demonstrated in our previous publication, the fluorescence lifetime of NIR dyes is highly sensitive to their immediate micropolarity.8 Correspondingly, the 2P induced fluorescence lifetime is also sensitive to the environment (see 2P excited fluorescence lifetime values of DTTC in different solvents in Table 2). Because the lifetime is less affected by concentration artifacts and photobleaching,25 light scattering,26,27 excitation intensity, or sample turbidity,28 fluorescence lifetime-dependent measurement of polarity proved to be effective in imaging of heterogeneous systems such as cells and tissues.29 Due to the dual sensitivity, 2P emission and lifetime 2P imaging are complementary mechanisms for high contrast imaging.
2P fluorescence imaging of biological tissue
In the preceding publication we demonstrated the ability of 2P fluorescence microscopy to image thin biological tissues stained with NIR dyes.2 Herein, we present further benefits of 2P imaging in thick tissues. DTTC was selected for this study because of its highest cross-section. Mouse kidneys were chosen because previous reports have shown that heptamethine dyes exhibit renal clearance.19,30 Specifically, we used ex vivo mouse kidneys that were fresh-frozen after intravenous injection of DTTC for the 2P excitation microscopy. Figure 6 shows a set of representative 2P fluorescence images indicating accumulation of the dye in kidney. Fine details of renal tubules at depths up to 180 μm below the renal capsule can be clearly visualized (Fig. 6C). The achieved depth represents ~3X improvement over conventional 2P microscopy with excitation near 800 nm, where maximum depth penetration at 60 μm was observed within the kidney.31 Relatively homogeneous distribution of fluorescence intensity across the image suggests similar polarity of the tissue in the area of interest and might be considered as a benchmark for healthy tissue. Future studies will investigate the change in 2P intensity as well as 2P excited fluorescence lifetime in kidney with different diseases.
Figure 6.
Kidney tissue at 20 μm deep (A), 80 μm deep (B) and 180 μm deep (C). Tubular structures in kidney tissue can be resolved up to 180 microns below the surface using NIR 2P fluorescence lifetime imaging with DTTC as a staining agent. Scale bar 50 μm, 256 × 256 pixels, ~250 μm × 250 μm field of view.
CONCLUSIONS
In summary, we have characterized the 2P optical properties of several NIR polymethine dyes. DTTC demonstrated superior 2P optical properties among the dyes studied exhibiting relatively large 2P action cross-section and comparatively long fluorescence lifetime, with both parameters highly sensitive to the polarity of the media. These properties of dyes could be utilized in for 2P based histological studies of thick tissue and 2P in vivo imaging. In further developments, DTTC could serve as a lead scaffold for chemical modifications. The modifications include the incorporation of the functionalities such as carboxylic groups, amines, azides for conjugation with biologically important targeting groups such as peptides, antibodies, and carbohydrates for imaging applications.
Acknowledgments
The authors would like to thank Anup Sood for preparing and providing the HHCP sample. This study was supported by a grant from the National Institutes of Health (R21/R33 CA12353701 and R01 EB008111).
References
- 1.Helmchen F, Denk W. Nat Methods. 2005;2:932. doi: 10.1038/nmeth818. [DOI] [PubMed] [Google Scholar]
- 2.Yazdanfar S, Joo C, Zhan C, Berezin MY, Akers WJ, Achilefu S. J Biomed Opt. 2010;15:030505. doi: 10.1117/1.3420209. [DOI] [PMC free article] [PubMed] [Google Scholar]
- 3.Murari K, Zhang Y, Li S, Chen Y, Li MJ, Li X. Opt Lett. 2011;36:1299. doi: 10.1364/OL.36.001299. [DOI] [PMC free article] [PubMed] [Google Scholar]
- 4.Achilefu S, Dorshow RB, Bugaj JE, Rajagopalan R. Invest Radiol. 2000;35:479. doi: 10.1097/00004424-200008000-00004. [DOI] [PubMed] [Google Scholar]
- 5.Gioux S, Lomnes SJ, Choi HS, Frangioni JV. J Biomed Opt. 2010;15:026005. doi: 10.1117/1.3368997. [DOI] [PMC free article] [PubMed] [Google Scholar]
- 6.Berezin MY, Guo K, Akers W, Livingston J, Solomon M, Lee H, Liang K, Agee A, Achilefu S. Biochemistry. 2011;50:2691. doi: 10.1021/bi2000966. [DOI] [PMC free article] [PubMed] [Google Scholar]
- 7.Lee H, Berezin MY, Henary M, Strekowski L, Achilefu S. J Photochem Photobiol A Chem. 2008;200:438. doi: 10.1016/j.jphotochem.2008.09.008. [DOI] [PMC free article] [PubMed] [Google Scholar]
- 8.Berezin MY, Lee H, Akers W, Achilefu S. Biophys J. 2007;93:2892. doi: 10.1529/biophysj.107.111609. [DOI] [PMC free article] [PubMed] [Google Scholar]
- 9.Benson RC, Kues HA. Phys Med Biol. 1978;23:159. doi: 10.1088/0031-9155/23/1/017. [DOI] [PubMed] [Google Scholar]
- 10.Makarov NS, Drobizhev M, Rebane A. Opt Express. 2008;16:4029. doi: 10.1364/oe.16.004029. [DOI] [PubMed] [Google Scholar]
- 11.Eliseeva SV, Aubock G, van Mourik F, Cannizzo A, Song B, Deiters E, Chauvin AS, Chergui M, Bunzli JC. J Phys Chem B. 2010;114:2932. doi: 10.1021/jp9090206. [DOI] [PubMed] [Google Scholar]
- 12.Xu C, Webb WW. J Opt Soc Am B: Opt Phys. 1996;13:481. [Google Scholar]
- 13.Makarov NS, Campo J, Hales JM, Perry JW. Opt Mater Express. 2011;1:551. [Google Scholar]
- 14.Akers WJ, Berezin MY, Lee H, Achilefu S. J Biomed Opt. 2008;13:054042. doi: 10.1117/1.2982535. [DOI] [PMC free article] [PubMed] [Google Scholar]
- 15.Hochreiner H, Cada M, Wentzell PD. J Lighwave Technol. 2008;26:1986. [Google Scholar]
- 16.Kim CB, Su CB. Meas Sc Technol. 2004;15:1683. [Google Scholar]
- 17.Mohanty J, Palit DK, Mittal JO. Proc Indian Natl Sci Acad, Part A. 2000;66:303. [Google Scholar]
- 18.Berezin MY, Lee H, Akers W, Nikiforovich G, Achilefu S. Photochem Photobiol. 2007;83:1371. doi: 10.1111/j.1751-1097.2007.00173.x. [DOI] [PubMed] [Google Scholar]
- 19.Goiffon RJ, Akers WJ, Berezin MY, Lee H, Achilefu S. J Biomed Opt. 2009;14:020501. doi: 10.1117/1.3095800. [DOI] [PMC free article] [PubMed] [Google Scholar]
- 20.Lakowicz JR. Principles of Fluorescence Spectroscopy. 3. Springer; New York, NY, USA: 2006. [Google Scholar]
- 21.Le Droumaguet C, Mongin O, Werts MHV, Blanchard-Desce M. Chem Commun. 2005:2802. doi: 10.1039/b502585k. [DOI] [PubMed] [Google Scholar]
- 22.Strehmel B, Sarker AM, Detert H. Chemphyschem. 2003;4:249. doi: 10.1002/cphc.200390041. [DOI] [PubMed] [Google Scholar]
- 23.Svetlichnyi VA, Ishchenko AA, Vaitulevich EA, Derevyanko NA, Kulinich AV. Opt Commun. 2008;281:6072. [Google Scholar]
- 24.Sung J, Kim P, Lee YO, Kim JS, Kim D. J Phys Chem Lett. 2011:818. [Google Scholar]
- 25.Lichtman JW, Conchello JA. Nat Methods. 2005;2:910. doi: 10.1038/nmeth817. [DOI] [PubMed] [Google Scholar]
- 26.Cerussi AE, Maier JS, Fantini S, Franceschini MA, Mantulin WW, Gratton E. Applied Optics. 1997;36:116. doi: 10.1364/ao.36.000116. [DOI] [PubMed] [Google Scholar]
- 27.Kuwana E, Sevick-Muraca EM. Biophys J. 2002;83:1165. doi: 10.1016/S0006-3495(02)75240-5. [DOI] [PMC free article] [PubMed] [Google Scholar]
- 28.Ntziachristos V, Weissleder R. Med Phys. 2002;29:803. doi: 10.1118/1.1470209. [DOI] [PubMed] [Google Scholar]
- 29.Berezin MY, Achilefu S. Chem Rev. 2010;110:2641. doi: 10.1021/cr900343z. [DOI] [PMC free article] [PubMed] [Google Scholar]
- 30.Guo K, Berezin MY, Zheng J, Akers W, Lin F, Teng B, Vasalatiy O, Gandjbakhche A, Griffiths GL, Achilefu S. Chem Commun (Camb) 2010;46:3705. doi: 10.1039/c000536c. [DOI] [PMC free article] [PubMed] [Google Scholar]
- 31.Bao H, Allen J, Pattie R, Vance R, Gu M. Opt Lett. 2008;33:1333. doi: 10.1364/ol.33.001333. [DOI] [PubMed] [Google Scholar]


