Abstract
In environments containing sensory events at competing locations, selecting a target for orienting requires prioritization of stimulus values. Although the superior colliculus (SC) is causally linked to the stimulus selection process, the manner in which SC multisensory integration operates in a competitive stimulus environment is unknown. Here we examined how the activity of visual-auditory SC neurons is affected by placement of a competing target in the opposite hemifield, a stimulus configuration that would, in principle, promote interhemispheric competition for access to downstream motor circuitry. Competitive interactions between the targets were evident in how they altered unisensory and multisensory responses of individual neurons. Responses elicited by a cross-modal stimulus (multisensory responses) proved to be substantially more resistant to competitor-induced depression than were unisensory responses (evoked by the component modality-specific stimuli). Similarly, when a cross-modal stimulus served as the competitor, it exerted considerably more depression than did its individual component stimuli, in some cases producing more depression than predicted by their linear sum. These findings suggest that multisensory integration can help resolve competition among multiple targets by enhancing orientation to the location of cross-modal events while simultaneously suppressing orientation to events at alternate locations.
Keywords: depression, superior colliculus, target selection, salience
survival depends on the ability to rapidly detect, localize, and orient toward biologically relevant events. The superior colliculus (SC) plays a key role in this task by translating sensory signals into the motor commands required for orienting the eyes, ears, and head toward salient visual, auditory, and tactile stimuli as well as to their various cross-modal combinations (Fecteau and Munoz 2006; Lomber et al. 2001; Sparks 1986; Stein and Meredith 1993). In a typical environment containing multiple potential targets, response selection is a competitive process in which targets are chosen on the basis of stimulus attributes (e.g., size, intensity) and intrinsic motivation. While several studies have shown the neural correlates of competition among modality-specific stimulus representations within SC activity (Basso and Wurtz 1997, 1998; Jiang and Stein 2003; Kadunce et al. 1997; Li and Basso 2005; Mysore et al. 2011; Rizzolatti et al. 1974), real world scenes are multisensory and contain concordant cross-modal signals competing with other stimuli. It is well established that concordant cross-modal signals are integrated in the cat SC, a process that is known to significantly increase the physiological salience of such events (Kadunce et al. 2001; Meredith et al. 1987; Meredith and Stein 1996; Rowland et al. 2007; Wallace et al. 1998). Theoretically, such multisensory enhancement should afford cross-modal stimuli a competitive advantage over their modality-specific counterparts; however, the rules that govern such competitive interactions at the level of the single multisensory neuron are not well understood.
To understand how neurons in the cat SC integrate sensory information within a competitive multisensory environment, we presented modality-specific and/or cross-modal stimuli at two locations simultaneously. Stimuli were placed in opposite hemifields to simulate target choices that would require interhemispheric competition to resolve mutually exclusive (i.e., left/right) demands on the motor apparatus. We evaluated several postulates pertaining to the potential benefits of multisensory integration by testing the ability of cross-modal and modality-specific stimuli to both maintain and degrade the physiological salience of the excitatory stimulus. In addition, we sought to determine if the activity of single multisensory neurons is consistent with a simple linear model for integrating the various stimulus-specific excitatory and inhibitory influences inherent in a given stimulus configuration, or if a novel combinatorial rule is required to predict outcomes in competitive sensory environments.
METHODS
All procedures were compliant with the Guide for the Care and Use of Laboratory Animals (National Institutes of Health Publication 86–23) and approved by the Animal Care and Use Committee of Wake Forest University School of Medicine and the Association for Assessment and Accreditation of Laboratory Animal Care International.
Surgical preparation.
Three adult cats were implanted with stainless-steel recording chambers using previously described methods (Mchaffie and Stein 1983). Each animal was first anesthetized with a mixture of ketamine hydrochloride (25 mg/kg) and acepromazine maleate (0.2–0.4 mg/kg). The animal was then intubated, placed in a stereotaxic head holder, and anesthetized for surgery with isoflurane (1.5–3%). A craniotomy was performed to allow access to the SC, and the recording chamber was attached with stainless steel screws and dental acrylic. Postsurgical analgesics (0.01 mg/kg buprenorphine and 2 mg/kg ketoprofen) and antibiotics (5 mg/kg enrofloxacin) were administered as needed.
Single neuron recording.
In each session the animal was anesthetized with a dose of ketamine hydrochloride (20 mg/kg im) and acepromazine maleate (0.1–0.2 mg/kg), intubated, ventilated, and paralyzed with an injection of pancuronium bromide (0.1 mg/kg iv) to prevent the eyes from changing position. Respiratory rate and volume, heart rate, blood pressure, and CO2 were monitored by a VetSpecs-VSM7 and corrected as needed. Anesthesia, paralysis, and hydration were maintained by continuous intravenous infusion of ketamine hydrochloride (4–6 mg·kg−1·h−1), pancuronium bromide (0.05 mg·kg−1·h−1), and 5% dextrose in 0.9% saline (3–6 ml/h). Body temperature was maintained at 37–38°C using a circulating water pad. Contact lenses were inserted to correct refractive errors and prevent corneal drying.
Single neuron extracellular recordings used conventional methods. The electrode (tip diameter 1–3 μm, impedance 2–3.5 MΩ at 1 kHz) was positioned on a microdrive stage and lowered into the SC. After reaching the superficial layers of the SC, the electrode was advanced with the hydraulic microdrive while monitoring neural activity and presenting search stimuli. Single neuron activity was recorded, amplified, and then sent to an oscilloscope, audio monitor, and computer. At the end of an experiment the animal was returned to its home cage after it regained respiratory and ambulatory control.
Apparatus and search paradigm.
Sensory-responsive neurons were identified with visual and auditory stimuli. Visual search stimuli consisted of moving bars of light (projected from an LC 4445 Philips projector) onto a screen located 45 cm from the animal. Auditory stimuli consisted of broadband (20–20,000 Hz) noise bursts of 100-ms duration presented from any of a series of speakers positioned on a mobile hoop 15° apart and 15 cm from the animal's head. Stimuli were controlled using custom software operating a NIDAQ controller. When a multisensory neuron was isolated, its modality-specific visual and auditory receptive fields were mapped as in the past (Alvarado et al. 2007).
Test stimuli.
Auditory stimuli consisted of brief (100-ms) 50–56 decibel (dB) sound pressure level (SPL) bursts of broadband noise presented against ambient background SPL 48.4 dB. Visual stimuli were 100- to 200-ms duration, 4° × 1° moving bars of light (1.68–13.67 cd/m2) of optimal velocity for each neuron and presented against a uniform gray background (0.16 cd/m2). When a “within-modal” pair of visual stimuli was presented, the two bars of light had a horizontal separation of 5°. During cross-modal stimulation, visual stimulus onset preceded auditory stimulus onset by 50 ms to maximize the likelihood of multisensory integration (Meredith et al. 1987).
Stimulus paradigms.
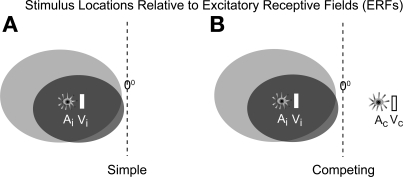
Only visual and auditory stimuli were employed in the current experiments, and they were arranged in two main configurations: “simple” and “competing.” In a simple configuration, visual (1 or 2 bars), auditory, or visual-auditory (i.e., cross-modal) stimuli were presented within the neuron's excitatory receptive fields (ERFs). In a competing configuration, an additional (i.e., “competitor”) stimulus was presented simultaneously in the opposite hemifield (ipsilateral to the electrode) and outside the neuron's ERFs. Stimuli were placed in the opposite hemifield to assure that the motor plans required to target one or the other would have minimal overlap. Bilaterally presented auditory stimuli were composed of noise that was statistically uncorrelated (r2 < 0.01) and had an azimuthal separation of at least 75° to reduce summing localization. Visual stimuli moved in the medial to lateral direction. In blocks testing multisensory integration in competing configurations, 12 different stimulus configurations (3 simple, 9 competing) were presented in a pseudo-randomly interleaved fashion. In blocks testing within-modal visual integration in competing configurations, 18 different stimulus configurations (3 simple, 15 competing) were pseudo-randomly interleaved. Fourteen of the 51 neurons were tested in both cross-modal and within-modal blocks. Figure 1 illustrates the difference between simple and competing stimulus configurations. An interstimulus interval of 5–6.5 s was used to minimize habituation.
Fig. 1.
Graphical depiction of the simple and competing stimulus paradigms. The gray circles represent a neuron's visual (dark gray) and auditory (light gray) excitatory receptive fields (ERFs). A: the simple paradigm: 2 stimuli are either separately or jointly presented inside the neuron's ERFs. This excitatory stimulus is denoted by the subscript “i.” B: the competing paradigm: stimuli are presented simultaneously inside (excitatory stimulus) and outside (competitor stimulus) the neuron's ERFs in all possible combinations. The competitor stimuli are denoted by the subscript “c.” The dotted lines represent the vertical meridian.
Data acquisition and analysis.
Custom software was used to acquire raw data waveforms and impulses from single neurons (after A/D conversion) with action potential amplitudes at least three times greater than the background noise. Impulse times were recorded with 1-ms resolution. The mean cumulative impulse count was computed from each raster by counting the number of impulses generated on or before each time bin and averaging across trials for 300 ms after stimulus onset. A response window of 300 ms was chosen because it incorporates the entire stimulus-driven activity of the vast majority of neurons studied. The mean cumulative impulse count was then converted to the mean cumulative stimulus-driven impulse count (Qsum) by subtracting, at each moment in time, the number of impulses expected based on the mean spontaneous firing rate calculated in the 500-ms window preceding the stimulus. Changes in the slope of the Qsum indicated changes in the underlying instantaneous firing rate. Response latency was calculated using a geometric function involving changes in the slope of the Qsum (Rowland et al. 2007).
Multisensory integration.
The criterion for multisensory integration was met when the response to the cross-modal stimulus (i.e., the multisensory response) was significantly greater than the response to the largest unisensory response (Meredith and Stein 1983). The multisensory index (MSI), a relative measure of multisensory integration, was calculated as the percent increase in the multisensory response over the largest unisensory response. Response depression was calculated as the percent decrease in stimulus-driven mean impulse count, but is reported here as percent depression, a positive quantity. Depression values greater than 100% indicate a decrease in response magnitude below the spontaneous firing rate. Statistical comparisons between response magnitudes among conditions were performed with t-tests and ANOVA.
RESULTS
Fifty-one multisensory neurons in the deep (i.e., multisensory) layers of the SC were analyzed. Their response properties were evaluated using simple and competing stimulus configurations (Fig. 1). Briefly, in all configurations, cross-modal or modality-specific stimuli were presented within a neuron's ERFs to establish their relative effectiveness. In the competing configurations, an additional stimulus (cross-modal or modality-specific) was presented simultaneously in the opposite hemifield to promote interhemispheric competition. This configuration also precluded the possibility that the competing stimulus encroached on an unidentified subthreshold portion of the neuron's ERF (Jiang and Stein 2003; Kadunce et al. 1997; Stein et al. 1988).
The magnitude and incidence of multisensory integration observed in the simple stimulus paradigm were similar to prior observations (Perrault et al. 2005; Stanford et al. 2005). For the majority (66%, 25/38) of neurons studied with this stimulus configuration, the multisensory response was significantly (t-test, P < 0.05) greater than the largest unisensory comparator response, thereby meeting the criterion for multisensory enhancement (Meredith and Stein 1983). In the competing stimulus configurations, the incidence of neurons exhibiting significant multisensory enhancement increased to 71% (27/38) with concurrent presentation of a visual competitor, 74% (28/38) with an auditory competitor, and 82% (31/38) with a cross-modal competitor. As described below, increases in both the incidence and magnitude of multisensory enhancement could be attributed to a disproportionately greater suppressive effect of competing stimuli on unisensory responses, whereas the multisensory responses were substantially more resistant to this suppressive influence.
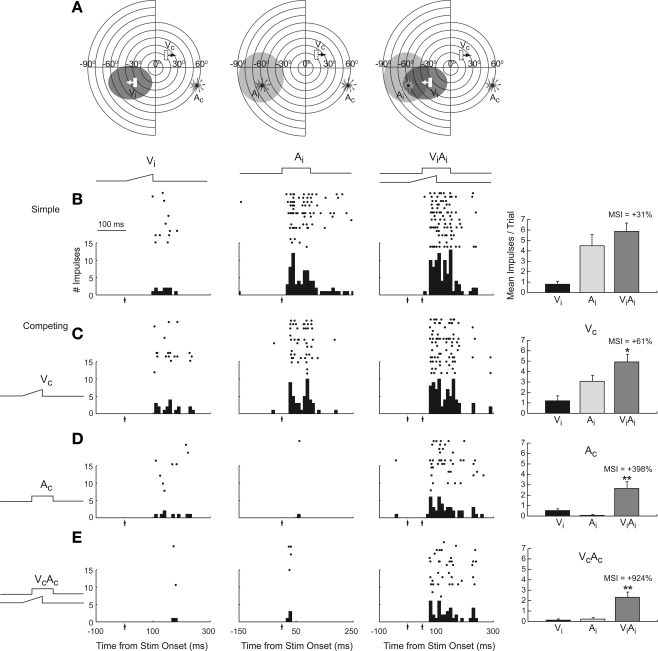
The results from an example neuron illustrate the relative potency of multisensory integration in both resisting and provoking suppression in the competing stimulus configuration (Fig. 2). Although in the simple configuration, cross-modal stimuli generally produced significantly larger responses than did either of their component stimuli; in this particular case, the multisensory response was only marginally greater than the largest component unisensory (auditory) response (Fig. 2B). The addition of a visual competitor changed the relative magnitudes of the unisensory and multisensory responses. It moderately depressed the auditory response, but only slightly degraded the multisensory response, thereby increasing the relative magnitude of the latter (Fig. 2C). The multisensory response was now statistically greater (P < 0.05) than the largest component unisensory response, achieving the criterion for multisensory integration, and nearly doubling the MSI to 61% (Fig. 2C). The effect was considerably greater when an auditory stimulus was the competitor (Fig. 2D), but it was most dramatic in the presence of a competing cross-modal stimulus (Fig. 2E). In this stimulus configuration, the unisensory responses were nearly extinguished, while the multisensory response retained a substantial degree of its original magnitude (Fig. 2E). Consequently, the MSI increased to 924%.
Fig. 2.
The effect of competitive stimulus interactions on unisensory and multisensory responses in an example neuron. A: within the schematics of visual-auditory space (each concentric circle represents 10°), icons denote the locations of visual (V), auditory (A), and cross-modal (VA) stimuli relative to the neuron's ERFs. Visual and auditory stimuli were presented in simple and competing stimulus configurations to generate 12 stimulus conditions (B–E) with conventions described in Fig. 1. Below the schematics are traces representing the time course of visual (ramp) and auditory (square wave) stimuli. Histograms, rasters, and a summary bar graph depict the neuron's unisensory and multisensory responses in simple (B) and competing (C–E) conditions, calculated from the mean cumulative impulse counts at 300 ms after stimulus onset. A window of 300 ms incorporated the entire stimulus-driven response in the vast majority of neurons studied. The vertical arrows underneath the PSTHs indicate the time(s) of stimulus onset. The competing visual (C), auditory (D), and cross-modal (E) stimuli are in the opposite hemifield. Note that the neuron's unisensory responses were disproportionately depressed in the competing conditions relative to its multisensory responses, and that the most effective inhibitory competitor was cross-modal. The disproportionate inhibition of unisensory responses increased the relative magnitude of multisensory responses, thereby significantly increasing the degree of multisensory enhancement from 31% (simple condition) to 61%–924% (competing conditions). *P < 0.05; **P < 0.01. Error bars indicate 1 SE. MSI, multisensory index.
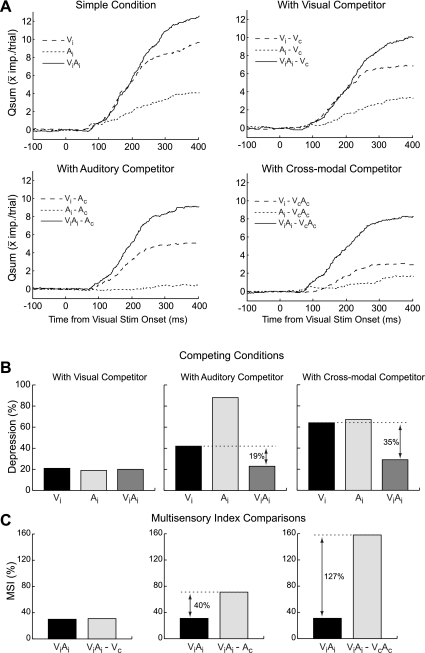
A second example, shown in Fig. 3, further illustrates the phenomenon by demonstrating the relative impact of competing stimuli on the temporal profiles of the multisensory and unisensory responses. In the simple configuration, the firing rate of the largest unisensory response (visual) and the multisensory response were equivalent for up to 200 ms following stimulus onset (Fig. 3A). In the competing configuration, a visual competitor had no effect on the temporal relationship between the visual and multisensory responses, but competing auditory and cross-modal stimuli preferentially depressed the early phase of the visual response, as manifested by a reduction in the slope and plateau of the Qsum plot. The cross-modal competitor had the most potent depressive effects (Fig. 3B). The multisensory response proved most resistant to the depressive influences of competing stimulation, thus accounting for the increases in MSI observed in these configurations (Fig. 3C). In the simple condition, multisensory response latency was 7 ms shorter than visual response latency. In conditions with competing auditory and cross-modal stimuli, multisensory response latency was 18 ms and 24 ms shorter than visual response latency, respectively.
Fig. 3.
The effect of competitive stimulus interactions on the temporal profile of responsiveness in an example neuron. A: the cumulative number of stimulus-driven impulses (Qsum) in the simple and competing stimulus conditions. In the simple conditions, the largest unisensory response (visual) had a temporal profile similar to the multisensory response for 200 ms after stimulus onset. B: however, in the presence of an auditory or cross-modal competitor, the visual response was depressed more than the multisensory response. C: this differential depression is evident in the early and later phases of the visual response, resulting in a notable increase in the MSI. Conventions are the same as in Fig. 2.
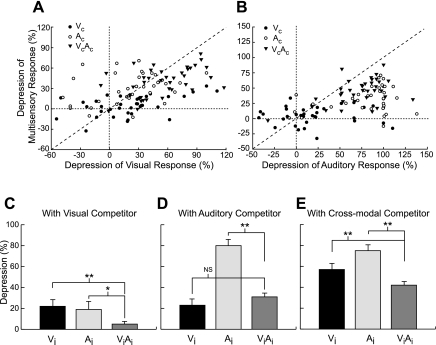
In general, the effects seen in these examples were evident across the population of neurons examined under these conditions (n = 38, Fig. 4, A and B). In a number of cases, one or both of the unisensory responses were nearly eliminated by a competing stimulus, while the multisensory response retained a larger degree of its original magnitude. The specific differences in the effectiveness of these different stimulus conditions on unisensory and multisensory responses are shown in Table 1, and the relationships are shown for the population in Fig. 4, C–E. To determine if differences in the effectiveness between cross-modal and modality-specific ERF stimuli can explain the observed differences in resistance to depression, the relationship between response depression (cross-modal competitor) and simple response magnitude was examined. There was no systematic relationship between response magnitude and depression revealed by the pooled population analysis (R2 < 0.005), regardless of ERF stimulus type. Note that the lack of a relationship in the population does not preclude a relationship for individual neurons. Interestingly, multisensory responses (n = 18, μ = 7.69) were depressed significantly less (44% vs. 80%, P < 0.001) than auditory responses (n = 12, μ = 7.34), but approximately equal (44% vs. 55%, P < 0.26) to visual responses (n = 15, μ = 7.09) of similar magnitude.
Fig. 4.
Population data summarizing the disproportionate depression of unisensory responses from competing stimulation. A and B: scatter plots of the relative depressive impact of different competitor stimuli on unisensory and multisensory superior colliculus responses for the population of neurons sampled. The symbol for each competitor stimulus type is shown in the legend. Note that multisensory responses are generally more resistant to the depressive effects of competing stimuli than are unisensory responses, with auditory responses being particularly sensitive to degradation from auditory and cross-modal competitors, and visual responses being particularly sensitive to depression from cross-modal competitors. C–E: bar graphs summarize the average (n = 38) depression levels for each competitor stimulus type and their statistical relationships (paired t-test). Conventions are the same as in previous figures.
Table 1.
Differential depression
| Vc | Ac | VcAc | |
|---|---|---|---|
| Visual response (Vi) | 74% | 42% | 76% |
| Auditory response (Ai) | 61% | 89% | 84% |
The proportion of neurons in each sensory condition where the unisensory response was depressed more than the multisensory response.
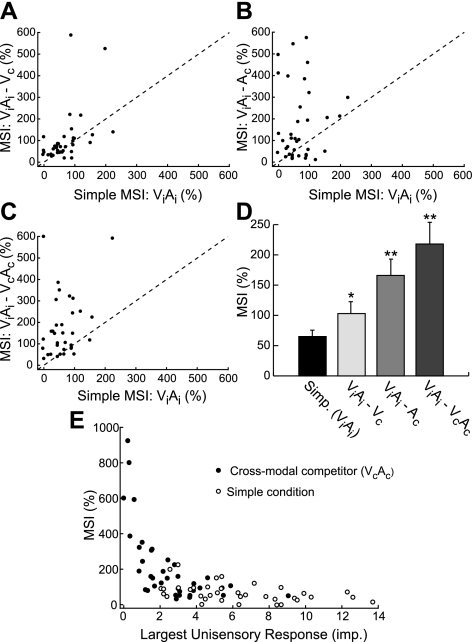
Consistent changes in the MSI evoked by competing stimuli were evident across the sample. Weakly depressive competitors produced correspondingly small increases in MSI, and strongly suppressive competitors yielded large increases in MSI. As noted above, competing cross-modal stimuli were generally the most powerful at degrading responses, disproportionately suppressing unisensory responses. Accordingly, cross-modal competitors yielded increases in MSI for a high percentage of neurons (Fig. 5C) that were, on average, larger than those produced by competing visual or auditory stimuli (Fig. 5D). By comparison, weakly suppressive visual competitors produced small increases in MSI (Fig. 5, A and D). The effects of auditory competitors were mixed, producing some of the largest increases but also decreases in MSI (Fig. 5B), depending on whether the neuron's preferred modality was auditory or visual. Responses to auditory stimuli tended to be strongly suppressed by competing auditory stimulation (MSI increased), while visual responses tended to better resist suppression by competing auditory stimulation. In accordance with previous research investigating the computation underlying multisensory integration (Meredith and Stein 1986), MSI was inversely related to unisensory response magnitude (Fig. 5E).
Fig. 5.
The effect of competitive stimulus interactions on the MSI. Scatter plots and a summary bar graph compare the MSI in simple and competing conditions. The MSI increased significantly in the presence of visual (A, P < 0.05), auditory (B, P < 0.01), and cross-modal (C, P < 0.01) competitors. A: in the presence of a visual competitor, most data points clustered slightly above the line of unity, demonstrating consistent, albeit small increases in the MSI across the sample of neurons. B: this elevation of MSI was greater in the presence of an auditory competitor. C: however, it was the strongest on average in the presence of a cross-modal competitor, where nearly all the data points fell above the line of unity. D: these effects are compared in a bar graph. E: MSI was inversely related to unisensory response magnitude. Filled circles represent a competing condition (cross-modal competitor) and open circles represent the simple condition with no competing stimuli. Conventions are the same as in previous figures.
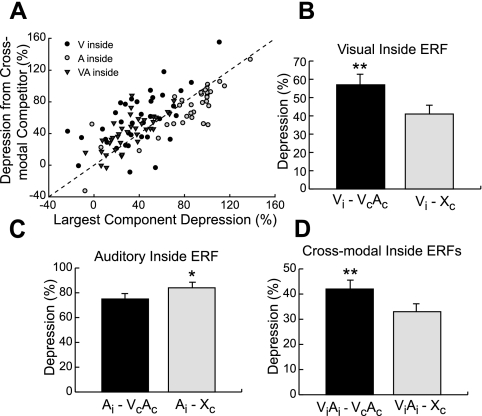
To further illustrate the potency of depression from a cross-modal competitor, the magnitude of its effect was compared with its largest component depression, induced from either of its component competitors (Fig. 6, A–C). Depression of visual (Fig. 6A) and multisensory (Fig. 6C) responses from competing cross-modal stimuli was significantly (P < 0.01) greater than their largest component depressions. An interesting finding was that auditory responses were more depressed on average by auditory competitors than cross-modal competitors (n = 38, P < 0.05) and thus showed an opposite trend (Fig. 6B). There are several different interpretations of this seemingly counterintuitive finding, and the reader is referred to the discussion.
Fig. 6.
Population data comparing the magnitude of depression from a cross-modal competitor (VcAc) to its largest component depression (Xc). A: visual and multisensory response depression induced by a competing cross-modal stimulus was significantly (P < 0.01) greater than the largest depression induced by one of its component stimuli. This trend is evident in the distribution of data points well above the line of unity. Auditory response depression from a competing cross-modal stimulus was significantly less (P < 0.05) than that induced by one of its component stimuli. The most effective component stimulus depressor was nearly always auditory. In this condition, the cluster of data points is just below the line of unity. B–D: the statistical differences in depression magnitude are summarized in bar graphs. Conventions are the same as in previous figures.
Additional analyses of visual and multisensory response depression revealed both linear and nonlinear summation of depression (Fig. 7). A good example of nonlinear summation of depression is shown for a single neuron in Fig. 7, A and B. In this neuron, a single visual competitor produced no depression in the neuron's visual response, an auditory competitor produced a fair amount of depression, and a cross-modal competitor almost eliminated the response. Quantitatively, the depression produced by a competing cross-modal stimulus configuration was 79%, but the predicted depression by a simple summation of the depression induced by its two modality-specific component stimuli was only 16%. A population analysis (n = 38) confirmed the generality of the observation (Fig. 7C). The magnitude of depression from competing cross-modal stimulation was superadditive when the modality-specific components were weak (<45%, P < 0.05). However, if the competing cross-modal stimulus was composed of strongly effective modality-specific components, the magnitude of depression was accurately predicted by simple linear summation (P > 0.23). The effect of a cross-modal competitor on a cross-modal excitatory stimulus was more linear throughout the same range, although a similar relationship was still evident (Fig. 7D).
Fig. 7.
The visual and multisensory response depression induced by a competing cross-modal stimulus often exceeded that predicted by the linear sum of its component stimulus effects. A: an example neuron showing the cumulative number of stimulus-driven impulses (Qsum) in simple and competing visual stimulus configurations. In the competing configuration, a cross-modal competitor profoundly degraded the visual response. In contrast, depression induced by its modality-specific components was either absent (visual) or moderate (auditory). B: a bar graph summarizing the visual response depression from competing modality-specific and cross-modal stimuli. C and D: a scatter plot of the population data revealed that the magnitude of depression from a competing cross-modal stimulus exceeded the predicted linear sum when the modality-specific competitors were individually weakly depressive. However, the linear sum accurately predicted the magnitude of depression from a cross-modal competitor when the modality-specific competitors were strong individually. Conventions are the same as in previous figures.
Cross-modal vs. within-modal comparisons.
The observations that multisensory responses are far more resistant to depression by competing stimuli and are also far more effective response suppressors when placed in the opposite hemifield are consistent with the known consequences of multisensory integration. However, it was also possible that this result was simply due to target redundancy (multisensory aspect was irrelevant). To examine this possibility, responses to simultaneously presented adjacent pairs of visual stimuli were also evaluated for resistance to competitor depression. In addition, the depressive power of within-modal pairs of visual stimuli was examined. The visual stimulus pairs were created by replacing the auditory component of the cross-modal stimulus with a second visual stimulus that was identical to the first.
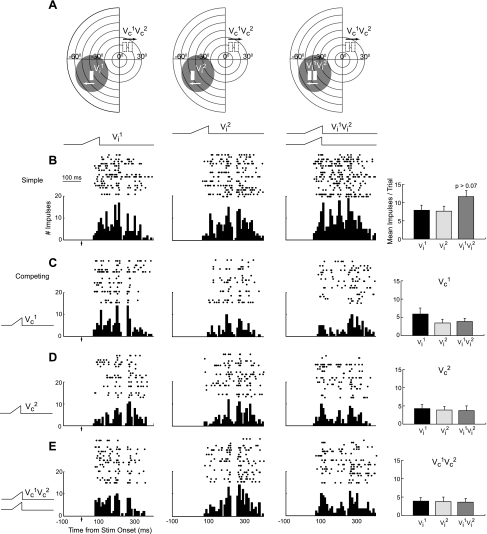
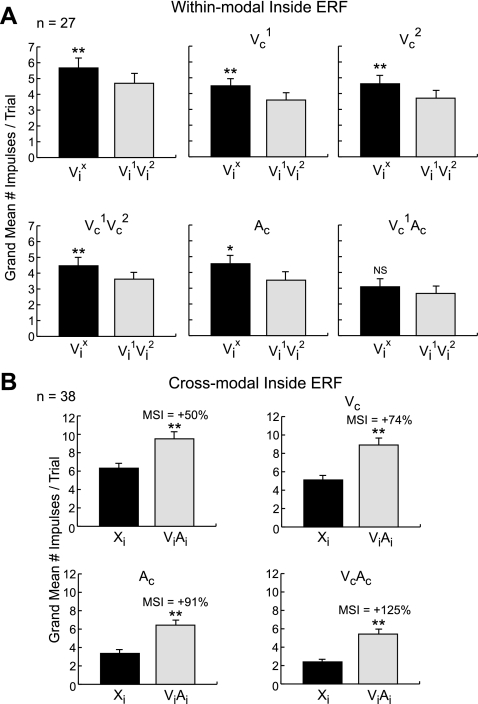
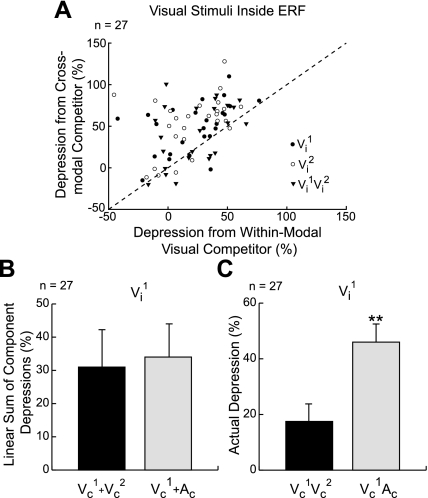
Responses to the within-modal stimulus lacked resistance to depression from competing stimuli. Figure 8 shows an example neuron. In the simple configuration (Fig. 8B), the response evoked by the within-modal stimulus was marginally better than that evoked by either of the component visual stimuli. However, the within-modal response was greatly decreased in each of the competing stimulus configurations tested (Fig. 8, C–E), so that its magnitude was rendered approximately equal to, or smaller than, the responses to single visual stimuli. This phenomenon reflected the general pattern (n = 27, Fig. 9A) that within-modal responses were suppressed by competing stimuli to approximately the same degree as the best single-stimulus component response, thereby demonstrating that simple target redundancy does not confer resistance to depression. On average, within-modal excitatory responses were weaker than those evoked by the largest modality-specific visual response, a finding consistent with previous observations (Alvarado et al. 2007). These observations suggest that multisensory responses are resistant to the depressive effects of competing stimuli (Fig. 9B). The depression induced by a cross-modal competitor was also significantly stronger than that induced by a within-modal pair of visual stimuli (n = 27, P < 0.01, Fig. 10, A and C). In some notable examples, there was more than a fivefold difference in depression between cross-modal and within-modal competitors, even though the simple sums of their component depressions were approximately equal (P > 0.83; Fig. 10B).
Fig. 8.
Within-modal pairs of visual stimuli neither induced more depression nor were more resistant to depression than were their individual component stimuli. A: polar coordinate lines show the location of the visual stimuli (Vi1,Vi2,Vc1,Vc2) relative to the neuron's ERF. Visual stimuli were presented in simple (B) and competing (C–E) configurations, and their effects are displayed in a 12-component matrix. Within-modal stimuli and their individual component stimuli did not differ significantly in their resistance to depression, or the magnitude of depression they induced in any of the stimulus configurations. Conventions are the same as in previous figures.
Fig. 9.
The differential effect of competitive stimulus interactions on unisensory and multisensory integration. A: bar graphs compare the mean of the largest modality-specific visual responses (Vix) to the mean of the within-modal visual responses (Vi1Vi2). The within-modal visual response was significantly smaller than the largest visual response, and competing stimuli had little effect on this relationship. B: however, competing stimuli increased the percent difference between the multisensory response and the largest unisensory response (Xi). Conventions are the same as in previous figures.
Fig. 10.
Cross-modal competitors depressed visual responses more than did pairs of within-modal competitors. A: a scatter plot compares depression from cross-modal competitors (VoAo) to depression from within-modal visual competitors (Vo1Vo2) on modality-specific (Vi1 or Vi2) and within-modal (Vi1Vi2) visual responses. B: a bar graph shows how the linear sum of the depressions from competing modality-specific stimulation yielded equivalent values for both visual and auditory components. C: depression from a competing cross-modal stimulus was significantly greater than depression from a competing within-modal visual stimulus.
DISCUSSION
The SC participates in guiding orientation behaviors by translating sensory signals into appropriate motor commands. Given a competitive stimulus environment, SC sensory maps can temporarily represent multiple conflicting targets that require resolution before an accurate motor command towards a selected target can be issued (Keller and McPeek 2002; Li and Basso 2005; McPeek and Keller 2002). Numerous prior studies have shown that multisensory integration of spatiotemporally concordant modality-specific cues leads to enhanced activity for individual SC neurons (Jiang et al. 2001; King and Palmer 1985; Meredith et al. 1987; Meredith and Stein 1996; Stein and Meredith 1993). In principle, this process should prioritize cross-modal stimuli for access to SC motor output, as multisensory neurons provide input to the brainstem circuits that control orientation (Meredith and Stein 1985). However, this hypothesis has not been tested explicitly, as earlier studies on SC neurons have not tested the impact of multisensory integration in the presence of competing stimuli.
With the present dataset, we demonstrate that the responses of SC neurons to cross-modal stimuli are considerably more resistant to the depressive effects of stimulus competition. This greater resistance relative to component visual responses is likely due to differences in response magnitude produced by multisensory integration. Similarly, visual response magnitude is inversely related to the magnitude of its depression from competing auditory stimulation (Jiang and Stein 2003). However, in the current study, multisensory responses were suppressed less than auditory responses of equal magnitude, indicating that differences in simple response magnitude do not explain all of the results (see discussion on sound translocation below).
Cross-modal stimuli generally produced the greatest depressive effect on responses, presumably due to the multisensory enhancement of activity at the competing SC location. Consequently, multisensory integration not only enhances the magnitude of sensory signals, but also minimizes the potentially distracting effects of competing stimuli, which is consistent with the hypothesis of cross-modal “priority” and “winner-take-all” algorithms (Basso and Kim 2010; Fecteau and Munoz 2006). These findings suggest that in competitive environments, multisensory integration augments the relative salience of events composed of cross-modal cues, and are largely consistent with observations in the owl optic tectum that the strongest stimulus prevails (Mysore et al. 2011). In addition, these data provide insight into how competitive interactions at the level of single neurons might underlie some of the benefits in behavioral localization attributed to multisensory processing (Corneil et al. 2002; Gingras et al. 2009; Jiang et al. 2002; Stein et al. 1988).
The present findings suggest that SC multisensory integration augments orientating behavior in complementary ways: potentially facilitating orientation to cross-modal events within corresponding sensory space while simultaneously suppressing orientation to events at alternate locations. Several of the input sources required to support the enhancement role of multisensory integration within the cat SC have been established (Alvarado et al. 2009; Jiang et al. 2001; Meredith 1999). Those accounting for the depressive effects of competing stimuli are somewhat less clear, but likely candidates include inhibitory projections arising from the opposite SC, crossed inhibitory projections derived from the basal ganglia, as well as projections from the anterior ectosylvian sulcus that contact SC GABA-ergic interneurons en route to the multisensory output neurons (Fuentes-Santamaria et al. 2009; Jiang and Stein 2003; Kadunce et al. 1997). It is well established that the superior colliculi on opposite sides are mutually inhibitory, each sending a GABA-ergic projection via the intercollicular commissure (Appell and Behan 1990; Munoz and Istvan 1998; Sooksawate et al. 2011; Takahashi et al. 2010). Likewise, recent studies have demonstrated that the substantia nigra pars reticulata (SNr), in addition to its well-known inhibitory projection to the ipsilateral SC (Chevalier et al. 1984; Hikosaka and Wurtz 1983; Karabelas and Moschovakis 1985; May and Hall 1984), provides a crossed inhibitory input to the opposite SC (Jiang et al. 2003; Liu and Basso 2008). Critically, these SNr projections perform complementary functions, simultaneously facilitating contralateral stimulus/movement representations (via disinhibition) while suppressing those to the ipsilateral side. In the present study, competing stimuli were placed in opposite hemifields to simulate mutually exclusive alternatives that would pit opposing SCs against one another. However, it is important to point out that the present findings should generalize beyond interhemispheric interactions to stimulus/target selection mechanisms responsible for choosing among potential targets in the same hemifield. Although this may rely more on GABA-ergic neurons intrinsic to the SC (Fuentes-Santamaria et al. 2009; Meredith and Ramoa 1998; Sooksawate et al. 2011), there is no a priori reason to suggest that the principles observed here would fail to apply to intracollicular competitive interactions. Nevertheless, this remains an empirical question for future study.
The resistance of multisensory responses to depression by competing stimuli and the ability of competing cross-modal stimuli to produce substantial depression are consistent with the observed effects of multisensory integration on response magnitude. As demonstrated, these effects were specific to cross-modal pairings and could not be replicated by simply increasing the number of stimuli within or outside the ERFs. As reported previously, the responses evoked by multiple modality-specific stimuli were generally not enhanced (Alvarado et al. 2007; Gingras et al. 2009), and, accordingly, they proved no more resilient to depression than were responses to the individual component stimuli. However, we did note one exception to the rule of cross-modal potency. While a cross-modal competitor was the most effective at depressing visual and multisensory responses, in many instances, an auditory response was depressed slightly less by a competing cross-modal stimulus than a competing modality-specific auditory stimulus (Fig. 6B). While this result might in part be due to activation of a large auditory-specific inhibitory surround (Kadunce et al. 1997), it may also be attributable to summing localization, and the associated translocation of the perceived auditory stimulus (Cranford 1982; Kelly 1974). In this regard, it is interesting to note that the presence of the visual component in the cross-modal stimulus may have moderated this effect by “calibrating” or “capturing” the location of the competing auditory stimulus (Bishop et al. 2011; Burr and Alais 2004; Donohue et al. 2011; Hairston et al. 2003; Wozny and Shams 2011), thereby reducing sound translocation and the associated auditory response suppression. This result is intriguing in its own right, as it suggests that multisensory integration could play a role in segregating sounds in noisy environments, an important issue deserving of future study.
In simple stimulus conditions, the behavioral enhancement of event detection and reaction time may be attributable in part to physiological enhancement at a corresponding location within the SC sensory topography (Stein and Stanford 2008). The current study has implications for a wider range of multisensory effects, particularly those in which there are multiple response alternatives to be considered. For example, in a study requiring saccades to target stimuli presented against a background of audio-visual noise, saccades to cross-modal targets exhibit the accuracy of visually guided saccades while still maintaining the short latency of auditory-guided saccades (Corneil et al. 2002). By increasing the number of competitors for a single response, the addition of extraneous stimuli may represent a greater cognitive load. In humans, cross-modal cues have been shown to significantly reduce reaction time under conditions of high perceptual load, while modality-specific cues have no effect in this condition (Santangelo and Spence 2007). The present study examines the impact of multisensory integration on interstimulus competition, a scenario that (like those just described) more closely resembles the complex environment in which this capacity evolved. Within SC activity, multisensory integration confers a strong competitive advantage onto cross-modal events at the expense of their modality-specific counterparts, a finding that has strong implications for stimulus-guided orienting behavior in natural scenes.
GRANTS
This work was supported by National Institutes of Health Grants EY-016716 and NS-036916.
DISCLOSURES
No conflicts of interest, financial or otherwise, are declared by the author(s).
AUTHOR CONTRIBUTIONS
Author contributions: S.R.P., B.A.R., T.R.S., and B.E.S. conception and design of research; S.R.P. performed experiments; S.R.P. analyzed data; S.R.P., B.A.R., T.R.S., and B.E.S. interpreted results of experiments; S.R.P. prepared figures; S.R.P., B.A.R., T.R.S., and B.E.S. drafted manuscript; S.R.P., B.A.R., T.R.S., and B.E.S. edited and revised manuscript; S.R.P., B.A.R., T.R.S., and B.E.S. approved final version of manuscript.
ACKNOWLEDGMENTS
We thank Nancy London for technical assistance.
REFERENCES
- Alvarado JC, Stanford TR, Rowland BA, Vaughan JW, Stein BE. Multisensory integration in the superior colliculus requires synergy among corticocollicular inputs. J Neurosci 29: 6580–6592, 2009 [DOI] [PMC free article] [PubMed] [Google Scholar]
- Alvarado JC, Vaughan JW, Stanford TR, Stein BE. Multisensory versus unisensory integration: contrasting modes in the superior colliculus. J Neurophysiol 97: 3193–3205, 2007 [DOI] [PubMed] [Google Scholar]
- Appell PP, Behan M. Sources of subcortical gabaergic projections to the superior colliculus in the cat. J Comp Neurol 302: 143–158, 1990 [DOI] [PubMed] [Google Scholar]
- Basso MA, Kim B. A probabilistic strategy for understanding action selection. J Neurosci 30: 2340–2355, 2010 [DOI] [PMC free article] [PubMed] [Google Scholar]
- Basso MA, Wurtz RH. Modulation of neuronal activity by target uncertainty. Nature 389: 66–69, 1997 [DOI] [PubMed] [Google Scholar]
- Basso MA, Wurtz RH. Modulation of neuronal activity in superior colliculus by changes in target probability. J Neurosci 18: 7519–7534, 1998 [DOI] [PMC free article] [PubMed] [Google Scholar]
- Bishop CW, London S, Miller LM. Visual influences on echo suppression. Curr Biol 21: 221–225, 2011 [DOI] [PMC free article] [PubMed] [Google Scholar]
- Burr D, Alais D. The ventriloquist effect results from near-optimal bimodal integration. Curr Biol 14: 257–262, 2004 [DOI] [PubMed] [Google Scholar]
- Chevalier G, Vacher S, Deniau JM. Inhibitory nigral influence on tectospinal neurons, a possible implication of basal ganglia in orienting behavior. Exp Brain Res 53: 320–326, 1984 [DOI] [PubMed] [Google Scholar]
- Corneil BD, Van Wanrooij M, Munoz DP, Van Opstal AJ. Auditory-visual interactions subserving goal-directed saccades in a complex scene. J Neurophysiol 88: 438–454, 2002 [DOI] [PubMed] [Google Scholar]
- Cranford JL. Localization of paired sound sources in cats - effects of variable arrival times. J Acoust Soc Am 72: 1309–1311, 1982 [DOI] [PubMed] [Google Scholar]
- Donohue SE, Roberts KC, Grent-'t-Jong T, Woldorff MG. The cross-modal spread of attention reveals differential constraints for the temporal and spatial linking of visual and auditory stimulus events. J Neurosci 31: 7982–7990, 2011 [DOI] [PMC free article] [PubMed] [Google Scholar]
- Fecteau J, Munoz D. Salience, relevance, and firing: a priority map for target selection. Trends Cogn Sci 10: 382–390, 2006 [DOI] [PubMed] [Google Scholar]
- Fuentes-Santamaria V, Alvarado JC, McHaffie JG, Stein BE. Axon morphologies and convergence patterns of projections from different sensory-specific cortices of the anterior ectosylvian sulcus onto multisensory neurons in the cat superior colliculus. Cereb Cortex 19: 2902–2915, 2009 [DOI] [PMC free article] [PubMed] [Google Scholar]
- Gingras G, Rowland BA, Stein BE. The differing impact of multisensory and unisensory integration on behavior. J Neurosci 29: 4897–4902, 2009 [DOI] [PMC free article] [PubMed] [Google Scholar]
- Hairston WD, Wallace MT, Vaughan JW, Stein BE, Norris JL, Schirillo JA. Visual localization ability influences cross-modal bias. J Cognitive Neurosci 15: 20–29, 2003 [DOI] [PubMed] [Google Scholar]
- Hikosaka O, Wurtz RH. Visual and oculomotor functions of monkey substantia nigra pars reticulata. 4. Relation Of Substantia Nigra to Superior Colliculus. J Neurophysiol 49: 1285–1301, 1983 [DOI] [PubMed] [Google Scholar]
- Jiang H, Stein BE, McHaffie JG. Opposing basal ganglia processes shape midbrain visuomotor activity bilaterally. Nature 423: 982–986, 2003 [DOI] [PubMed] [Google Scholar]
- Jiang W, Jiang H, Stein BE. Two corticotectal areas facilitate multisensory orientation behavior. J Cognitive Neurosci 14: 1240–1255, 2002 [DOI] [PubMed] [Google Scholar]
- Jiang W, Stein BE. Cortex controls multisensory depression in superior colliculus. J Neurophysiol 90: 2123–2135, 2003 [DOI] [PubMed] [Google Scholar]
- Jiang W, Wallace MT, Jiang H, Vaughan JW, Stein BE. Two cortical areas mediate multisensory integration in superior colliculus neurons. J Neurophysiol 85: 506–522, 2001 [DOI] [PubMed] [Google Scholar]
- Kadunce DC, Vaughan JW, Wallace MT, Benedek G, Stein BE. Mechanisms of within- and cross-modality suppression in the superior colliculus. J Neurophysiol 78: 2834–2847, 1997 [DOI] [PubMed] [Google Scholar]
- Kadunce DC, Vaughan JW, Wallace MT, Stein BE. The influence of visual and auditory receptive field organization on multisensory integration in the superior colliculus. Exp Brain Res 139: 303–310, 2001 [DOI] [PubMed] [Google Scholar]
- Karabelas AB, Moschovakis AK. Nigral inhibitory termination on efferent neurons of the superior colliculus - an intracellular horseradish-peroxidase study in the cat. J Comp Neurol 239: 309–329, 1985 [DOI] [PubMed] [Google Scholar]
- Keller EL, McPeek RM. Neural discharge in the superior colliculus during target search paradigms. Ann NY Acad Sci 956: 130–142, 2002 [DOI] [PubMed] [Google Scholar]
- Kelly JB. Localization of paired sound sources in rat - small time differences. J Acoust Soc Am 55: 1277–1284, 1974 [DOI] [PubMed] [Google Scholar]
- King AJ, Palmer AR. Integration of visual and auditory information in bimodal neurons in the guinea-pig superior colliculus. Exp Brain Res 60: 492–500, 1985 [DOI] [PubMed] [Google Scholar]
- Li XB, Basso MA. Competitive stimulus interactions within single response fields of superior colliculus neurons. J Neurosci 25: 11357–11373, 2005 [DOI] [PMC free article] [PubMed] [Google Scholar]
- Liu P, Basso MA. Substantia nigra stimulation influences monkey superior colliculus neuronal activity bilaterally. J Neurophysiol 100: 1098–1112, 2008 [DOI] [PMC free article] [PubMed] [Google Scholar]
- Lomber SG, Payne BR, Cornwell P. Role of the superior colliculus in analyses of space: superficial and intermediate layer contributions to visual orienting, auditory orienting, and visuospatial discriminations during unilateral and bilateral deactivations. J Comp Neurol 441: 44–57, 2001 [DOI] [PubMed] [Google Scholar]
- May PJ, Hall WC. Relationships between the nigrotectal pathway and the cells of origin of the predorsal bundle. J Comp Neurol 226: 357–376, 1984 [DOI] [PubMed] [Google Scholar]
- Mchaffie JG, Stein BE. A chronic headholder minimizing facial obstructions. Brain Res Bull 10: 859–860, 1983 [DOI] [PubMed] [Google Scholar]
- McPeek RM, Keller EL. Superior colliculus activity related to concurrent processing of saccade goals in a visual search task. J Neurophysiol 87: 1805–1815, 2002 [DOI] [PubMed] [Google Scholar]
- Meredith MA. The frontal eye fields target multisensory neurons in cat superior colliculus. Exp Brain Res 128: 460–470, 1999 [DOI] [PubMed] [Google Scholar]
- Meredith MA, Nemitz JW, Stein BE. Determinants of multisensory integration in superior colliculus neurons. 1. Temporal factors. J Neurosci 7: 3215–3229, 1987 [DOI] [PMC free article] [PubMed] [Google Scholar]
- Meredith MA, Ramoa AS. Intrinsic circuitry of the superior colliculus: pharmacophysiological identification of horizontally oriented inhibitory interneurons. J Neurophysiol 79: 1597–1602, 1998 [DOI] [PubMed] [Google Scholar]
- Meredith MA, Stein BE. Descending efferents from the superior colliculus relay integrated multisensory information. Science 227: 657–659, 1985 [DOI] [PubMed] [Google Scholar]
- Meredith MA, Stein BE. Interactions among converging sensory inputs in the superior colliculus. Science 221: 389–391, 1983 [DOI] [PubMed] [Google Scholar]
- Meredith MA, Stein BE. Spatial determinants of multisensory integration in cat superior colliculus neurons. J Neurophysiol 75: 1843–1857, 1996 [DOI] [PubMed] [Google Scholar]
- Meredith MA, Stein BE. Visual, auditory, and somatosensory convergence on cells in superior colliculus results in multisensory integration. J Neurophysiol 56: 640–662, 1986 [DOI] [PubMed] [Google Scholar]
- Munoz DP, Istvan PJ. Lateral inhibitory interactions in the intermediate layers of the monkey superior colliculus. J Neurophysiol 79: 1193–1209, 1998 [DOI] [PubMed] [Google Scholar]
- Mysore SP, Asadollahi A, Knudsen EI. Signaling of the strongest stimulus in the owl optic tectum. J Neurosci 31: 5186–5196, 2011 [DOI] [PMC free article] [PubMed] [Google Scholar]
- Perrault TJ, Vaughan W, Stein BE, Wallace MT. Superior colliculus neurons use distinct operational modes in the integration of multisensory stimuli. J Neurophysiol 93: 2575–2586, 2005 [DOI] [PubMed] [Google Scholar]
- Rizzolatti G, Camarda R, Grupp LA, Pisa M. Inhibitory effect of remote visual-stimuli on visual responses of cat superior colliculus - spatial and temporal factors. J Neurophysiol 37: 1262–1275, 1974 [DOI] [PubMed] [Google Scholar]
- Rowland BA, Quessy S, Stanford TR, Stein BE. Multisensory integration shortens physiological response latencies. J Neurosci 27: 5879–5884, 2007 [DOI] [PMC free article] [PubMed] [Google Scholar]
- Santangelo V, Spence C. Multisensory cues capture spatial attention regardless of perceptual load. J Exp Psychol 33: 1311–1321, 2007 [DOI] [PubMed] [Google Scholar]
- Sooksawate T, Isa K, Behan M, Yanagawa Y, Isa T. Organization of GABAergic inhibition in the motor output layer of the superior colliculus. Eur J Neurosci 33: 421–432, 2011 [DOI] [PubMed] [Google Scholar]
- Sparks DL. Translation of sensory signals into commands for control of saccadic eye-movements - role of primate superior colliculus. Physiol Rev 66: 118–171, 1986 [DOI] [PubMed] [Google Scholar]
- Stanford TR, Quessy S, Stein BE. Evaluating the operations underlying multisensory integration in the cat superior colliculus. J Neurosci 25: 6499–6508, 2005 [DOI] [PMC free article] [PubMed] [Google Scholar]
- Stein BE, Huneycutt WS, Meredith MA. Neurons and behavior - the same rules of multisensory integration apply. Brain Res 448: 355–358, 1988 [DOI] [PubMed] [Google Scholar]
- Stein BE, Meredith MA. The merging of the senses. Cambridge, Mass: MIT Press, 1993, p. xv, 211 p. [Google Scholar]
- Stein BE, Stanford TR. Multisensory integration: current issues from the perspective of the single neuron. Nat Rev Neurosci 9: 255–266, 2008 [DOI] [PubMed] [Google Scholar]
- Takahashi M, Sugiuchi Y, Shinoda Y. Topographic organization of excitatory and inhibitory commissural connections in the superior colliculi and their functional roles in saccade generation. J Neurophysiol 104: 3146–3167, 2010 [DOI] [PubMed] [Google Scholar]
- Wallace MT, Meredith MA, Stein BE. Multisensory integration in the superior colliculus of the alert cat. J Neurophysiol 80: 1006–1010, 1998 [DOI] [PubMed] [Google Scholar]
- Wozny DR, Shams L. Recalibration of auditory space following milliseconds of cross-modal discrepancy. J Neurosci 31: 4607–4612, 2011 [DOI] [PMC free article] [PubMed] [Google Scholar]


