Abstract
Behaviors are generated from complex interactions among networks of neurons. Single-unit ensemble recording has been used to identify multiple neurons in functioning networks. These recordings have provided insight into interactions among neurons in local and distributed circuits. Recorded units in these ensembles have been classed based on waveform type, firing pattern, and physical location. To identify individual projection neurons in a cortical network, we have paired tetrode recording with antidromic stimulation. We developed techniques that enable antidromic identification of single units and study of functional interactions between these neurons and other circuit elements. These methods have been developed in the zebra finch and should be applicable, with potential modifications that we discuss here, to any neural circuit with defined subpopulations based on projection target. This methodology will enable elucidation of the functional roles of single identified neurons in complex vertebrate circuits.
Keywords: tetrode, antidromic, circuit
neural circuits have been probed using multiunit, serial single-unit, and single-unit ensemble (e.g., tetrode or multielectrode) recordings. In the investigation of circuit dynamics, single-unit ensemble recordings such as tetrode recordings have effectively isolated the simultaneous spike trains of multiple single units. These powerful recordings enable analysis of spike-time relationships and the functional connectivity among neurons.
Tetrode recordings have been used extensively in the forebrain to study functional ensembles of single units (Gray et al. 1995; Hargreaves et al. 2005; Johnson and Redish 2007; McNaughton et al. 1983). Analysis of tetrode records relies on spike waveform characteristics to enable sorting of single-unit activities. In ensemble recordings, cellular identity is inferred by spike waveforms, firing patterns, and physical location. However, in many systems, identification using these parameters is not feasible due to the relative homogeneity of spike trains and waveforms in functionally heterogeneous neuronal subtypes. In these instances, methods that have been used to identify single neurons in the population have included dye fills (Dutar et al. 1998; Hill and Oliver 1993; Mooney and Prather 2005; Steinberg and Schmidt 1970) and antidromic stimulation (Hahnloser et al. 2002; Lim and Anderson 2007; Lipski 1981; Prather et al. 2008; Swadlow 1998). In some of these cases, network connectivity has been determined using paired intracellular recordings (Debanne et al. 2008; Mooney and Prather 2005; Yoshimura and Callaway 2005) or inferred using post hoc alignment of serially recorded neurons with stereotyped behavior or stimuli (Kozhevnikov and Fee 2007; Richmond et al. 1990). Intracellular recording in vocalizing and sleeping animals has provided insight into the membrane properties of antidromically identified neurons that are active during specific behaviors (Long et al. 2010).
Understanding the neural control of behavior cannot be achieved without an understanding of neural networks (Harris-Warrick and Marder 1991). In invertebrate systems, study of neural circuits has been facilitated by simultaneous recording of multiple neurons with known identities (e.g., Church and Lloyd 1994; Selverston et al. 1976; Stent et al. 1978). To identify neurons in a vertebrate forebrain circuit, we combined two powerful techniques: tetrode recording and antidromic stimulation. Living neurons with specific projection patterns can be identified by antidromically stimulating their axons (Ranck 1975). Previous studies have combined multielectrode single-unit recording and antidromic stimulation to examine the relationship of the activity of single identified neurons to local field potentials and behavior (Soteropoulos and Baker 2006; Witham and Baker 2007). Combining single-unit ensemble recording with antidromic identification enables the study of identified neurons within the broader circuit, the measurement of functional interactions among neurons in real-time, and the enhancement of neuron classification, particularly interneurons, based on functional interactions.
To characterize functional cell-cell interactions in a forebrain region that contains heterogeneous neuronal subtypes, we recorded ensembles of single units with a 4-tetrode array in HVC (this acronym is the proper name). HVC is a cortical nucleus that is critically involved in the production of learned song (Aronov et al. 2008; Nottebohm et al. 1976; Simpson and Vicario 1990; Vu et al. 1994). HVC contains a functionally heterogeneous population of neuronal subtypes that can be classified based on projection target: interneurons and 2 populations of pyramidal-like neurons with mutually exclusive projection targets (Dutar et al. 1998; Mooney 2000; Wild et al. 2005). A population of corticocortical neurons (HVCRA) projects to the robust nucleus of the arcopallium (RA), a song motor control area. Another population of corticobasal ganglia neurons (HVCX) projects to Area X, the song basal ganglia. We have achieved antidromic identification of both of these subtypes in neuronal ensembles of up to 21 units. This has enabled examination of the spike trains of identified projection neurons in the context of local forebrain circuits and how these spike trains relate to those of other neurons in the ensemble. Determining the interactions among neurons in a circuit is a critical step in understanding the mechanisms of behavior. Below, we describe the approach, pitfalls, and available solutions that are inherent in this new combined method. Proof-of-concept is provided using conditional probabilities to assess spike-train relationships of projection neurons with other neurons that were recorded at the same time. We report the novel finding that both projection neuron subtypes are coactive with multiple other HVC neurons in population recordings. This finding would be impossible with serial single-unit recordings.
METHODS
Animals and surgery.
Tetrode recordings were obtained from 42 male zebra finches (Taeniopygia guttata) that originated from our breeding colony or an outside supplier. Birds were housed under a 14:10-h light-dark cycle and given food and water ad libitum. The Institutional Animal Care and Use Committee at the University of Minnesota approved all procedures.
Before surgery, all animals were deprived of food and water for a minimum of 1 h before an initial intramuscular injection of 20% urethane (60–70 μl). Two additional subdoses (not exceeding 30 μl per dose) were given at 30- to 45-min intervals. The bird was placed in a stereotaxic apparatus (Herb Adams Engineering), and lidocaine (1%; Xylocaine) was injected under the scalp. After resection of the scalp, craniotomies were made over the following right-hemisphere brain regions using established coordinates from the bifurcation of the midsagittal sinus at a 20° head angle from the horizontal: HVC (∼2.5 mm lateral), Area X (1.4–1.6 mm lateral, 3.9–4.1 mm anterior), and RA (1.8–2.2 mm lateral, 1.8–2.0 mm posterior).
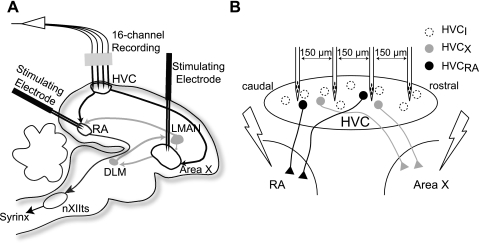
Custom-made bipolar stimulating electrodes were constructed from 200-μm Teflon-coated tungsten wires (A-M Systems, Sequim, WA) that were epoxied together approximately 200–500 μm apart (100-kΩ impedance). These stimulating electrodes were cemented into place with dental acrylic within Area X at a depth of 3.9–4.5 mm (Fig. 1A). A reference electrode (125-μm bare silver wire) was cemented in place between the dura mater and the brain approximately 3.5 mm anterior and 4 mm lateral. A headpost was also cemented to the bird's skull. After this preparatory surgery, the animal was moved into a sound-attenuating chamber (Industrial Acoustics) on an air table (TMC, Peabody, MA). Once the animal was secured by the headpost, a bipolar stimulating electrode (300- to 500-kΩ impedance; FHC, Bowdoin, ME) was inserted 0.9–1.4 mm at a 30° angle into RA under the control of a microdrive (Siskiyou, Grants Pass, OR).
Fig. 1.
Schematic of the recording design used in this study. A: a 16-channel, 4-tetrode recording array was placed in the cortical song nucleus HVC in the zebra finch brain. Bipolar stimulating electrodes were placed in its efferent projection targets, the song motor nucleus RA, and song basal ganglia, Area X. Arrows denote a subset of connections among song system nuclei. B: a simplified diagram of HVC shows the tetrode configuration. Tetrode shanks were placed 150 μm apart along the rostral-caudal axis. HVC neurons may project to either RA or Area X but not both. The axons of a 3rd group, interneurons (I), ramify solely within HVC. For this study, axons that terminated in Area X or RA were stimulated to antidromically identify single units in the context of a functioning forebrain network. LMAN, lateral magnocellular nucleus of the nidopallium; DLM, medial dorsolateral nucleus of the thalamus; nXIIts, tracheosyringeal portion of the hypoglossal nucleus.
Recording and electrical stimulation.
Ensembles of single units in HVC were recorded extracellularly in 10- to 15-min recording sessions with a 4-tetrode array (a4x1; NeuroNexus Technologies, Ann Arbor, MI) attached to a 16-channel headstage preamplifier (10×) that fed to a Model 3600 16-channel AC amplifier (A-M Systems). Tetrodes were linearly distributed within HVC parallel to the midsagittal sinus in the rostral-caudal plane with a spacing of 150 μm (Fig. 1B). Tetrodes (0.5- to 2.0-MΩ impedance) with a recording site area of 312 μm2 were used. Signals were amplified (1,000×), filtered (300–10,000 Hz), and acquired at 22.05 kHz with custom-written MATLAB (MathWorks, Natick, MA) software. Activity in HVC was collected on 15-channels; the 4th recording site on 1 tetrode was not recorded to enable collection of chamber sound events on our analog-to-digital PCI card that was limited to 16 channels (PCI 6251; National Instruments, Austin, TX).
Electrical stimulation was delivered by a stimulus isolation unit triggered by a Master-8 (A.M.P.I., Jerusalem, Israel) to the efferent targets of HVC: Area X and RA. Only one target was stimulated at a time. Single, monophasic pulses of 200-μs duration were delivered at a rate of 0.5 Hz. Stimulation intensity (20–400 μA) was gradually increased until reliable spikes were observed in HVC.
In a subset of recordings, collisions of spontaneous and antidromic spikes were obtained to test further the antidromicity of the stimulation and to rule out the possibility of intervening synapses. For spike collisions, a two-window discriminator (FHC) was used to identify specific spontaneous spikes and trigger stimulation selectively within 1.5 ms.
For the study shown in Fig. 8, auditory stimuli were played back through a tweeter speaker (Focal). Song playback order was randomly determined within each trial. Each auditory playback session consisted of 15 trials with an 8-s interstimulus interval. Auditory stimuli included bird's own song (BOS), reverse BOS (REV), conspecific song, and silence.
Fig. 8.
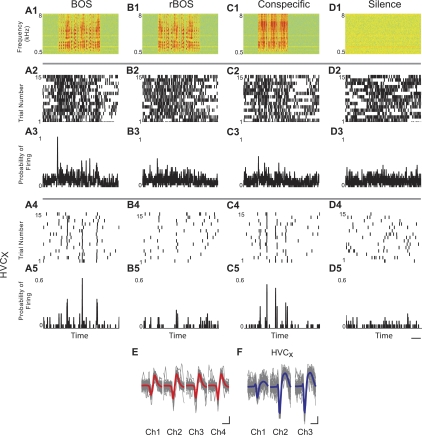
Auditory-evoked activity in simultaneously recorded single units. A1–D1: spectrograms of auditory stimuli. A2–D2 and A4–D4: aligned raster plots of individual units for 15 trials of auditory playback show responses to an HVCX (bottom) and a unit in its local circuit (top). Note the precision of firing in the HVCX. A3–D3 and A5–D5: peristimulus time histograms show the moving averages with a 5-ms binning window. Scale bar: 1 s. E and F: waveforms of each unit. Fifty randomly selected spikes are overlaid in gray. The median waveform is plotted in red (E) or blue (F; HVCX). Scale bar: 20 μV, 0.5 ms. Data are from R-493, age 166 days. Ch, channel.
Spike sorting.
Multiple spikes on the same tetrode were sorted using automatic clustering followed by manual checking of each cluster. Following each recording, spikes were identified using custom software if they crossed a predetermined threshold (mean + 4 SD; calculated independently on each channel for each recording session). Twenty-two-point (∼1-ms) spike waveforms and their corresponding time stamp were used for clustering. Our conservative threshold included numerous “noise” events, which were subsequently sorted out, to eliminate the possibility of excluding part of a cluster. Features of thresholded waveforms (for each channel: energy, derivative of energy, and first principal component) were then calculated (MClust; A. D. Redish; http://redishlab.neuroscience.umn.edu/MClust/MClust.html) and subjected to unsupervised clustering with a Gaussian mixture model with unconstrained covariance matrices (KlustaKwik; K. Harris, Rutgers University, Newark, NJ; http://klustakwik.sourceforge.net) to obtain a maximum of 30 initial “preclusters” using a classification expectation-maximization (CEM) algorithm. KlustaKwik allows for a variable number of clusters, penalized by the Akaike information criterion (AIC). The initial preclusters identified by KlustaKwik were manually checked and occasionally combined or split using MClust 3.5 in the MATLAB environment. Clustering was performed either on a Dell personal computer or blade server with a 64-bit processor and Windows XP.
Four criteria were used to determine cluster quality to ensure that sorted spikes accurately reflected single units. Clusters that did not pass all criteria were discarded. The 4 criteria for cluster quality were: 1) L-ratio score < 0.1; 2) isolation distance > 16; 3) <1% violations of a 1-ms refractory period; and 4) visual separation of the cluster from noise and other clusters on ≥2 (of 12) dimensions. The L-ratio is a measure of the compactness of a cluster. Isolation distance quantifies how well a cluster separates from other clusters (Harris et al. 2001; Jackson et al. 2006; Schmitzer-Torbert et al. 2005). For spike waveform display (Fig. 6C, Fig. 7, B and C, and Fig. 8, E and F) and analysis, a matrix of 64-point waveforms was created with the same indices as the 22-point waveform matrix that was used for clustering.
Fig. 6.
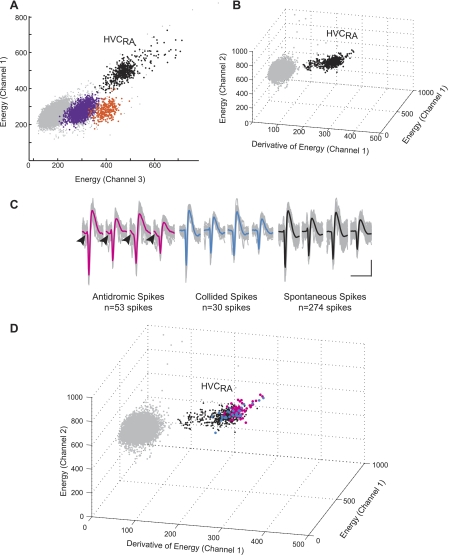
The spikes of antidromically identified units were identified by coclustering spontaneous and stimulus-related waveforms. A: a plot of 2 of the 12 parameters used to sort spikes shows the spike event cluster of an RA-projecting unit (black) and 2 other units (purple and orange) that were identified. Light gray dots consist of spikes and noise that were not clustered in the dimensions shown. The black cluster contains spontaneous as well as antidromic spikes that were evoked by stimulation of RA. L-ratio: 0.001; isolation distance: 120.9. B: a 3-dimensional plot shows 3 additional waveform features that were used to identify the RA-projecting unit. Note that in this view, the orange and purple clusters are no longer visually separated, but the HVCRA (black) cluster remains well-isolated. C: waveforms are segregated according to their relationship to antidromic stimulation: antidromically driven (magenta), spontaneous collided (blue), and spontaneous during the stimulation-off recording period (black). Note the similarity of all waveforms. The median voltage is overlaid in the color corresponding to the graph in D. Arrowheads (left) indicate the presence of the initial segment spike in antidromically stimulated waveforms. Scale bar: 2 ms, 40 μV. D: the antidromic, collided, and spontaneous spikes cluster together based on clustering criteria and visual inspection. Data are from bird R-161, age 150 days.
Fig. 7.
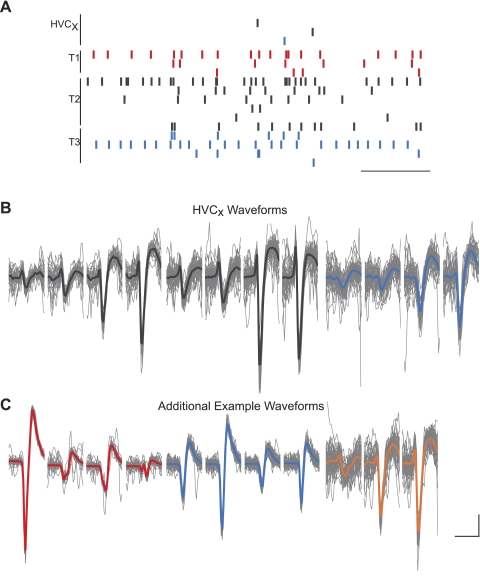
Multiple simultaneously active projection neurons can be studied using combined tetrode recording and antidromic identification. Raster marks indicate the activity of all units that were active during a 1.2-s time window. Three HVCX neurons recorded on 2 tetrodes were active in a population burst. Antidromic latencies for each projection neuron were (from top to bottom): 9.47, 10.85, and 6.68 ms. Single units from the same tetrode are indicated by the same color. Scale bar: 250 ms. B: overlaid waveforms (gray) and the median waveform (color) of 50 randomly selected spikes of simultaneously active HVCX units shown in A and 3 other example waveforms of units active in the same session. Single units from the same tetrode are indicated by the same color. Tetrode 1: red; 2: black; 3: blue; 4: orange. Scale bar: 150 μV (all but C, left), 250 μV (C, left); 1 ms. Data are from O-37, age 49 days.
Identification of clustered antidromic single units.
All units used for further analysis, including those identified by antidromic stimulation, met the criteria described above. A subset of spontaneous spikes typically coclustered with antidromic spikes. In collision experiments, spontaneous spikes that triggered spike collisions also coclustered with antidromic spikes. The coclustering of spontaneous spikes with antidromic and/or collided spikes enables the identification of spontaneous events. Spike times for events occurring after stimulation were used to identify fixed-latency spikes and to calculate latency time and latency variability relative to the stimulus. Antidromic latency was defined as the mean time from stimulation to the peak of the action potential for ≥10 trials. Latency variability was defined as the standard deviation of the latencies. All spikes that were collected during and 100 ms after stimulation were excluded from analyses of waveform properties and network interactions. Based on our finding that antidromic units identified with spike collisions had latency variabilities of up to 119 μs (see results, Fig. 5), the latency variability cut-off for identification of unit as a projection unit was set at <125 μs.
Fig. 5.
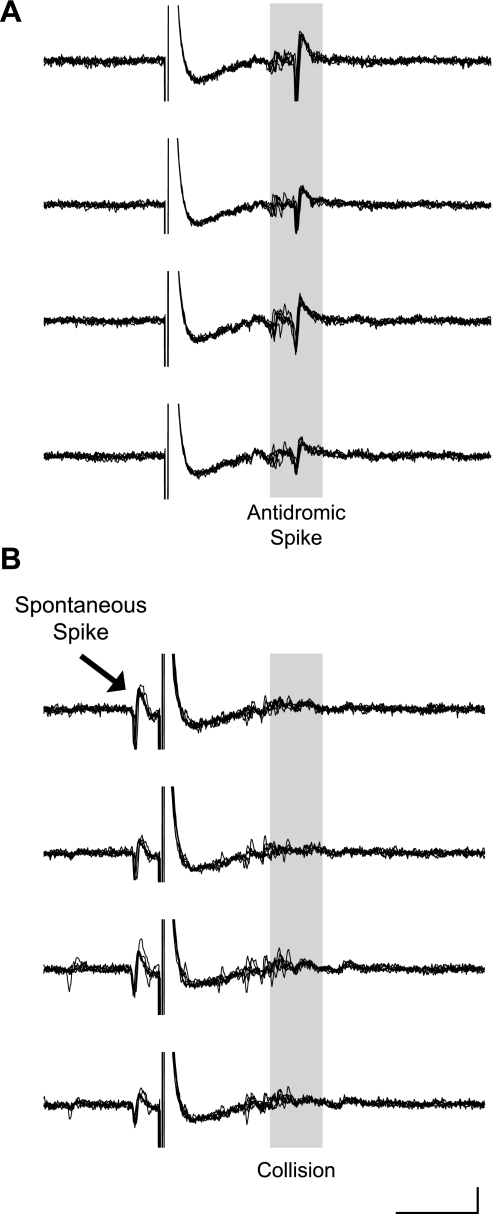
Antidromic identification of projection neurons can be achieved in ensemble recordings. A: stimulation of the premotor song nucleus RA (200 μs, 42 μA) reliably drove an HVC spike at a latency of 8.1 ms. Six traces are overlaid and temporally aligned for each of the 4 recording sites. B: triggering the stimulus by a spontaneous spike resulted in orthodromic-antidromic collisions. Scale bar: 5 ms, 500 μV. Data are from bird R-161, age 150 days.
Auditory analyses.
Post hoc alignment of song stimuli and corresponding neural activity enable comparison of single-neuron auditory responses across multiple trials. Dot rasters were created with a 1-ms binning window. Peristimulus time histograms were constructed by smoothing the summed dot raster from all trials using a moving average with a 5-ms binning window.
Analyses of functional interactions and statistics.
All units used for quantitative analysis were from recordings of spontaneous activity in adult finches (>130 days posthatch). Conditional probabilities were calculated to assess functional connectivity between pairs of units in the circuit. The entire recording between stimulation epochs was used for conditional probability calculations. We examined spike-train relationships by calculating the probability of projection neurons firing pairwise with all other neurons: the conditional probability of the projection neuron firing ±5 ms, given that the other unit had fired. We shuffled the interspike intervals of one of the spike trains to control for overall firing rate (Nádasdy et al. 1999). All conditional probability calculations were performed on both the recorded and shuffled data sets. The Wilcoxon signed-rank test was used to compare recorded and shuffled conditional probabilities with significance defined as P < 0.05. Except where noted, all measures of central tendency are shown as median with interquartile range.
RESULTS
Using combined antidromic stimulation and tetrode recording, we identified single-projection neurons within ensembles of single units in the zebra finch HVC song nucleus. Figure 1 schematically diagrams the placement of our recording tetrode array and two stimulating electrodes in the brain nuclei of the song system. Forty-one adult zebra finches were successfully implanted with stimulating and recording electrodes. Of these, 35 animals had antidromic units that fired reliably with low latency variability during the recording. Eleven animals had antidromic units that met our four conservative criteria for cluster quality. Identified units from two of these animals were discarded because their latency variability was >125 μs, and collision data were unavailable. Ultimately, 12 antidromic units (HVCX = 5; HVCRA = 7) from 9 animals were included in our final quantitative analyses.
Tetrode recordings in the zebra finch.
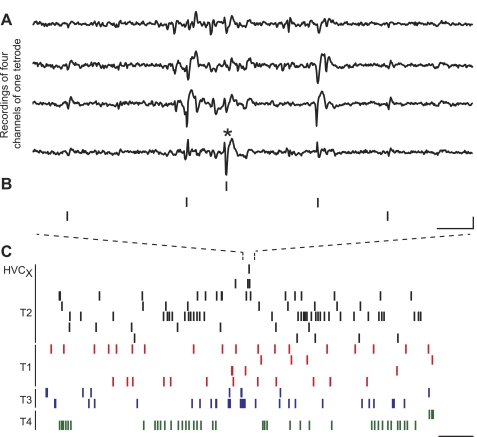
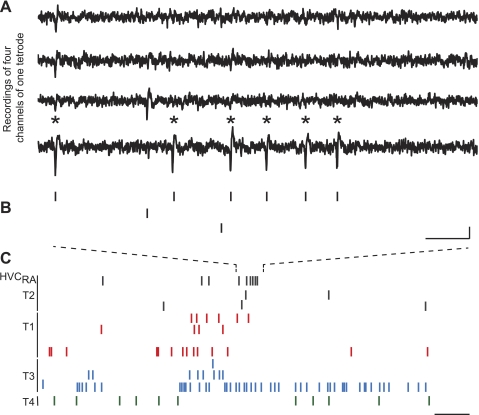
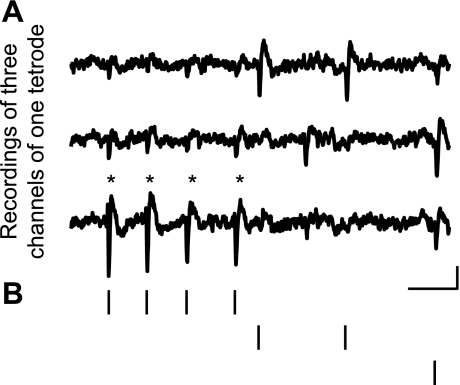
Figures 2A and 3A show spontaneous activity on 4 channels of a single tetrode from different adult animals, including the activity of an identified HVCX or HVCRA neuron, respectively. Because the relative distance from the neuron varies across the sites of a tetrode, spike waveforms of individual neurons differ across each of the recording channels of the tetrode. Sorting techniques exploit these differences to identify spikes of single units. The raster plot (Fig. 2B) shows the relative spike times of 3 single units recorded by the 4-tetrode array during a 30-ms period, including an HVCX. The time frame is expanded in Fig. 2C (3 s) to show the simultaneous activity of these 3 units and an additional 12 that were recorded and clustered in the same session. Similar plots of the activity of an HVCRA unit in the context of its local circuit are shown in Fig. 3. Figure 4 shows that spike sorting of tetrode data captures every spike in the characteristic high-frequency burst of an HVCRA projection unit previously reported using single-wire recordings (Hahnloser et al. 2002). The firing rate of spikes within HVCRA bursts using our methods was 248 ± 121 Hz, which is consistent with previously published results (Hahnloser et al. 2002; Long et al. 2010). Across all 9 adult animals included in this study, we recorded 134 single units over 12 10- to 15-min recording sessions. The number of simultaneously recorded units ranged between 5 and 21.
Fig. 2.
Ensemble recordings capture the simultaneous activity of an HVCX with its local circuit neurons. A: raw HVC multielectrode voltage traces of 4 recording sites from the same tetrode are temporally aligned. The asterisk indicates the action potential of an HVCX. Voltage events have variable amplitudes across channels depending on the recording site location relative to the neuron. B: raster marks indicate the activity of the HVCX and 2 other neurons from the same tetrode that were active in the same time frame. Scale bar: 2.5 ms, 100 μV. C: spikes of single neurons across all tetrodes (T) of the recording are shown in a longer time window. The activity of the HVCX unit (top) is labeled on the left. All clusters (n = 15) from a given tetrode are indicated by the line at left and shared color. Scale bar: 125 ms. Data are from orange bird O-365, age 155 days.
Fig. 3.
Ensemble recordings capture the simultaneous activity of an HVCRA with its local circuit neurons. A: raw HVC multielectrode voltage traces of 4 recording sites from the same tetrode are temporally aligned. Asterisks indicate the action potentials of an HVCRA. B: raster marks indicate the activity of the HVCRA and 2 other neurons from the same tetrode that were active in the same time frame. Scale bar: 10 ms, 50 μV. C: spikes of single neurons across all tetrodes of the recording are shown in a longer time window. The activity of the HVCRA unit (top) is labeled on the left. All clusters (n = 15) from a given tetrode are indicated by the line at left and shared color. Scale bar: 125 ms. Data are from bird O-236, age 139 days.
Fig. 4.
Single-unit bursts are captured in ensemble recordings and subsequent clustering analysis. A: raw HVC multielectrode voltage traces of 3 recording sites from the same triode are temporally aligned. Asterisks indicate each action potential in an HVCRA burst. B: raster marks indicate the activity of the HVCRA and 2 other neurons from the same tetrode that were active in the same time frame. Scale bar: 5 ms, 50 μV. Data are from red bird R-757, age 270 days.
Antidromic stimulation is used to identify single units in an ensemble.
To identify specific cell types, we drove antidromic spikes in HVC with stimulation of Area X or RA and recorded the resulting activity with a 4-tetrode array. The stimulus parameters were similar to those used in single-unit studies (Hahnloser et al. 2002, 2006): 0.5-Hz stimulation between 20 and 400 μA. Figure 5A shows action potentials in an HVC neuron stimulated with an electrode in RA. Six sets of simultaneously acquired and temporally aligned traces from the 4 recording channels of one of the 4 tetrodes are overlaid. This HVCRA neuron had an antidromic latency of 8.09 ms stimulated with 110 μA of current. The latency variability of the antidromic spike was 119 μs. This was higher than that previously reported (94 μs; Hahnloser et al. 2006). The range of antidromic latencies for putative HVCX and HVCRA neurons agreed with previously reported data (Hahnloser et al. 2006): the latency to first spike of HVCX neurons was 3.4–9.9 ms (mean ± SD: 5.1 ± 2.4 ms), whereas that of HVCRA neurons was 3.5–8.1 ms (5.4 ± 1.7 ms). The latency variability of HVCX neurons was 0.078 ± 0.035 ms (mean ± SD), whereas that of HVCRA neurons was 0.072 ± 0.027 ms. Antidromically identified projection units were included in analyses if the latency variability of a given unit was <125 μs.
To determine definitively that the spikes triggered in single neurons were antidromically stimulated, we performed collision tests on a subset of units that had a fixed latency. Collision tests are the best method for confirming the direct stimulation of a neuron axon, as opposed to synaptic activation of that neuron through axonal stimulation of a cell that is presynaptic to that neuron (Lipski 1981). “Orthodromic” refers to the physiological conduction of an action potential from cell body to synaptic terminal, whereas “antidromic” refers to the reverse conduction of an action potential from axon to cell body. The cell body of a projection neuron, which lies in HVC, can be invaded antidromically after a spontaneous spike with a minimal delay of T, which is defined as:
T = R + 2T1,
where R is the absolute refractory period and T1 is the antidromic latency. If a stimulus is applied during the critical delay (W),
W = T1 + R,
no antidromic spike will be observed in the cell body due to collision of the orthodromic and antidromic spikes within the axon.
For these experiments, a two-window discriminator identified spontaneous spikes that were used to trigger stimulation. In pilot experiments, it was determined that a single-trigger window was insufficient to isolate the spikes of single neurons in an ensemble recording due to triggering by multiple units. The stimulation occurred within 1.5 ms of the spontaneous spike and resulted in a collision of the orthodromic and antidromic spikes (Fig. 5B).
Solutions to the problem of multiple overlapping spikes triggered by the antidromic stimulation.
A problem inherent in the combination of tetrode recording and antidromic stimulation is that of overlapping waveforms. A barrage of near-simultaneous spikes can be triggered by stimulation. The waveforms can then overlap and preclude clustering based on the features of waveforms. To overcome this problem, site areas and spacing for the tetrode configuration, as well as the duration of waveforms used for feature calculation, must be carefully selected and optimized for each brain region. Larger site areas that record many units may be ideal for monitoring large numbers of neurons but unsuitable for identifying a subset of single units using antidromic stimulation due to coactivation of many neurons and subsequent occlusion of waveforms used in clustering. In addition, the lowest stimulation current that triggers an antidromic spike in at least one high signal-to-noise unit should be used. Attempting to increase the number of antidromically identified units by increasing stimulation strength can be detrimental by causing near-simultaneous activation of multiple units and subsequent failure of spike feature clusters to meet quality criteria. If, even with these steps, two units are consistently stimulated at latencies that yield overlapping waveforms, the tetrode array could be moved slightly to eliminate one of the units from the recording. Alternatively, spontaneous spikes that drive collisions may be used to identify each unit, as described below.
Clustering of antidromic units.
We determined that antidromically identified units could be successfully isolated from other simultaneously recorded units (Fig. 6). Antidromic stimulation was delivered at the beginning and end of each recording session. Antidromic spikes and spontaneous spikes that were used to trigger collisions were clustered with all other spikes from the recording, as described above. All antidromic units were held to the same cluster quality criteria as other units (L-ratio, isolation distance, interspike interval violations, and visual separation). Note the separation of a cluster that was identified as an HVCRA from both noise and other clusters in Fig. 6, A and B.
A solution to the potential problem of waveform differences in spontaneous and antidromically stimulated spikes.
Comparison of overlaid waveforms (Fig. 6C) demonstrates that antidromic and spontaneous waveforms were very similar. However, there were slight differences in waveform such as the initial segment spikes (arrowheads in Fig. 6C, left) characteristic of antidromic waveforms (Lipski 1981). The appearance of this voltage fluctuation that is typical of intracellular recordings in the median of our extracellularly recorded events demonstrates the reliability and fidelity of this method. Because of these differences in antidromic and spontaneous waveforms, two visually separated subclusters often appeared in a subset of dimensions (data not shown). It is possible that, in some systems, antidromic spikes may differ sufficiently from orthodromic spikes to produce two separate clusters in several dimensions, preventing identification of the spontaneous and other orthodromic spikes of the projection neuron as those of a projection neuron. However, we found that spontaneous spikes that triggered spike collisions reliably clustered with those obtained in the absence of stimulation based on our four criteria (Fig. 6, C and D). The coclustering of spontaneous spikes that resulted in collisions with other orthodromic events enables antidromic identification while avoiding the complications of both the overlap of near-simultaneous antidromically stimulated waveforms and any potential differences between orthodromic and antidromically driven waveforms.
Simultaneous recording of multiple projection neurons.
Tetrode recording with antidromic identification enables simultaneous recording of multiple identified projection neurons. Figure 7 shows the activity of three HVCX neurons together with other neurons in a population burst. Two of these projection neurons were recorded on the same tetrode and were identified as different units based on their locations in feature space and different fixed latencies. Each of the identified neurons passed our strict cluster criteria. Simultaneous recordings of multiple projection neurons will facilitate understanding of the functional interactions among the projection neurons, their regulation by the local network (e.g., do the same interneurons functionally inhibit multiple projection neurons?), and the output of the network.
Auditory playback.
Neurons in HVC respond preferentially to playback of BOS and have stereotyped responses to BOS and other auditory stimuli (Margoliash 1983; Margoliash and Fortune 1992). Combining tetrode recording with antidromic stimulation enables simultaneous recording of identified projection neurons and their local circuits. Figure 8 shows the patterns of activity of two single units to playbacks of different song stimuli (Fig. 8, A1–D1). One unidentified unit responds more to BOS (Fig. 8, A2 and A3) than to other songs (Fig. 8, B2–D2, and B3–D3). An HVCX fires precisely across repeated playbacks of BOS, as observed in previous single-unit studies (Prather et al. 2008).
Evaluating spike-time relationships among identified HVC neurons.
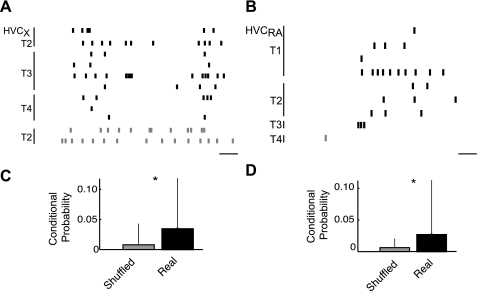
Combining antidromic stimulation with tetrode recording enables analysis of spike-time relationships among projection neurons and their local circuits. A defining characteristic of song system activity is its bursts of population activity that involve multiple neurons (Crandall et al. 2007; Day et al. 2009; Schmidt and Konishi 1998; Shank and Margoliash 2009). However, the types of HVC neurons that are coactive in the bursts have not been determined. Toward this end, we have calculated conditional probabilities between pairs of neuronal spike trains. We determined the probability that a projection neuron fired, given that another neuron in HVC had fired. The conditional probability was obtained using a ±5-ms window set by the spike time of any neuron in the recording. This allowed us to examine the probability of a projection neuron firing with other neurons. Conditional probabilities of pairs of real spike trains were compared with conditional probabilities calculated from the same data but with one spike train shuffled by randomly reordering the interspike intervals (Nádasdy et al. 1999). We found that both types of HVC principal neurons were active with the population under anesthesia (Fig. 9). Example raster plots in Fig. 9, A and B, show HVCX and HVCRA neurons that were active during population bursts. Compared with shuffled spike times, both HVCX and HVCRA units were significantly more likely to fire when other units were active (n: HVCX = 86 pairs; HVCRA = 43 pairs; P < 1.5 × 10⁻⁶, P < 2.1 × 10⁻⁷, respectively; Fig. 9, C and D).
Fig. 9.
Both types of cortical projection neurons are active during HVC population bursts. A and B: the rasters show the temporally aligned spike times of all units from 4 tetrodes that were simultaneously active within a population burst (black) or outside of the bursts (gray). HVCX and HVCRA units spiked within population bursts. A and B are from different animals. Scale bar: 10 ms. C and D: group data show the conditional probabilities of a projection unit firing given that any other unit has fired ±5 ms. HVCX (C) and HVCRA (D) recorded spikes were more likely to occur within ±5 ms of another unit firing than shuffled controls (age > 130 days; n: HVCX = 86 pairs; HVCRA= 43 pairs; *P < 0.005 for both).
DISCUSSION
We have combined two electrophysiological techniques to identify individual neurons in ensemble recordings. This new method of combined tetrode recording and antidromic identification enables the study of identified neurons in the context of a functioning forebrain network. Knowledge of the network, in turn, can provide information, such as functionally inhibitory interactions, that enables classification of additional neurons. Although the study of identified neurons in a functioning circuit has been possible for decades in invertebrate preparations (Frazier et al. 1967; Selverston et al. 1976), vertebrate work has focused on the physiological study of either single identified neurons (Hahnloser et al. 2002; Herfst and Brecht 2008; Long et al. 2010) or large neuronal ensembles (Johnson and Redish 2007; Nicolelis et al. 1997). Reliable and repeatable identification of neuronal subtypes using a combination of electrophysiological techniques will facilitate and hasten understanding of vertebrate circuits and their regulation.
One particular advantage of ensemble recordings is the large number of units that can be simultaneously monitored. This approach allows for analysis of hundreds of neuron-neuron interactions using analytical methods such as conditional probability or coherence. However, one limitation of tetrode recordings in brain areas with functionally heterogeneous subtypes has been the definitive identification of these subtypes and subsequent attribution of patterns of activity and functional connectivity. Identification of specific cells in the circuit, when possible, can more accurately inform our understanding of neuronal interactions. In many systems, cellular identification technologies limit the possible number of recorded pairs (e.g., dye fills) or the ability to detect real-time interactions (e.g., antidromic stimulation combined with serial single-unit recording). Functionally inhibitory interactions, in particular, are impossible to detect with serial single-unit recording.
There are potential pitfalls and limitations of this technique. Antidromic stimulation of multiple neurons or single neurons with local synaptic connections can result in a barrage of near-simultaneous spiking activity. Coincident, overlapping spiking events occlude waveforms that are used for spike clustering. We addressed this significant problem in several ways: 1) the spacing and site area of the tetrodes were optimized to record a relatively small number of neurons; 2) the stimulation magnitude was always decreased to the minimum required for the activation of at least one antidromic unit in the entire recording; 3) the waveform duration used for feature calculation was optimized; and 4) spike collisions were developed as an alternative method to identify units, since the spontaneous spike that triggers the collision typically occurs in relative isolation and thus provides a less occluded waveform. The first two of these optimizations required a compromise because the number of all possible units and antidromic units, respectively, had to be decreased to achieve unoccluded waveforms. For any system, application of this technique will require a compromise since the number of units in the recording will likely need to be decreased to enable antidromic identification of a small subset of those units. Because the stimulation is minimal, some units in the recording that project to the target will not be identified as such. This is also the case with antidromic identification in serial single-unit recordings (Lipski 1981; Ranck 1975).
Another potential pitfall of using antidromic stimulation to identify single units in an ensemble is the inherent difference between spontaneous and antidromically driven waveforms. This is best exemplified by the initial segment spike that appears in antidromically driven, but not spontaneous, waveforms (Fig. 6C; Lipski 1981). We found that, in the system under study (the birdsong nucleus HVC), spontaneous and antidromic waveforms still tended to cocluster in most dimensions that we analyzed and met our conservative criteria for cluster quality. To ensure that the antidromic and spontaneous waveforms did indeed represent the activity of the same unit, we examined spike collisions: spontaneous spikes that triggered collisions possessed waveforms that were identical to spontaneous waveforms that were used for the analysis of circuit activity.
A problem inherent in antidromic stimulation in general, whether used in combination with serial single- or multiple-unit ensemble recordings, is that the stimulation itself may alter circuit activity. We sought to minimize this problem by stimulating only at the beginning and end of each recording session, with continuous recording throughout initial stimulation, circuit monitoring in the absence of stimulation, and restimulation. Our stimulation parameters matched those used in previous serial single-unit studies, with stimulation magnitudes consistently on the lower end of the range reported (Hahnloser et al. 2002).
Even with these optimizations, there are neural systems where antidromic identification of units in neural ensembles may not be useful for identifying cells as a particular projection neuron subtype. For example, in brain areas where all neurons project to the same target, such as the granular layer of the dentate gyrus, antidromic stimulation would not provide additional information regarding cellular identity. However, in these cases, this technique may provide valuable information by confirming the identity of a specific projection neuron at the beginning and end of the recording. Additionally, in situations in which pharmacological manipulation may cause spontaneous spiking to cease, antidromic stimulation can be used to reconfirm that the cell is still alive and capable of spiking. In brain areas where cells are densely packed or tend to fire simultaneously in population bursts, combination of antidromic stimulation and tetrode recording may theoretically not be possible. However, we were able to identify multiple single units in HVC, which has relatively dense clusters of tightly packed neurons that are characterized by their population bursts. This suggests that this technique can be applied to other brain areas that might initially seem intractable.
Combining antidromic stimulation with tetrode recording has allowed us to identify single-projection units in a complex neuronal network during both spontaneous and auditory-evoked neural activity. This technique could be easily adapted to recordings of neuron populations with multiple single-wire electrodes instead of the compound multielectrode (tetrode) recordings that we describe here. Assessing the functional connectivity of neural networks is paramount in understanding how circuits work. We have demonstrated the feasibility of the technique in a challenging brain area with dense clusters of neurons that fire in bursts. In the intact, anesthetized birdsong system, we found that both types of projection neurons (corticocortical and corticobasal ganglia) participate in population bursts. Future experiments will utilize functional interactions with identified projection neurons to class other neuronal subtypes. Other potential applications of this technique are to enable the discovery of the topography of activity within and among neuronal subtypes across heterogeneous brain areas and to delve into circuit changes that occur in tandem with behavioral plasticity and the insertion of new neurons.
GRANTS
Support was contributed by the National Science Foundation (IOS/BIO 1025825), John Merck Scholars Program, National Institute on Deafness and Other Communication Disorders (K02-DC008521l; T. A. Nick), National Institute of General Medical Sciences (NI5T32-GM008471-15; N. F. Day), National Institutes of Health (5T90DK070106; S. J. Kerrigan), and the University of Minnesota Doctoral Dissertation Fellowship (N. F. Day).
DISCLOSURES
No conflicts of interest, financial or otherwise, are declared by the author(s).
AUTHOR CONTRIBUTIONS
Author contributions: N.F.D. and T.A.N., conception and design of research; N.F.D., S.J.K., and N.A. performed experiments; N.F.D. and T.A.N. analyzed data; N.F.D. and T.A.N. interpreted the results of experiments; N.F.D. and T.A.N. prepared figures; N.F.D. and T.A.N. drafted the manuscript; N.F.D. and T.A.N. edited and revised the manuscript; N.F.D., S.J.K., N.A., and T.A.N. approved the final version of the manuscript.
ACKNOWLEDGMENTS
We thank B. Best, V. Carels, G. Giesler, D. Nykamp, and A. D. Redish for technical assistance. We thank M. Coleman, G. Giesler, and A. D. Redish for reading preliminary drafts of the manuscript.
Present address of N. Aoki: School of Pharmaceutical Sciences, Teikyo University, 1091-1 Suwarashi Midori-ku Sagamihara, Kanagawa, Japan 252-5195.
REFERENCES
- Aronov D, Andalman AS, Fee MS. A specialized forebrain circuit for vocal babbling in the juvenile songbird. Science 320: 630–634, 2008 [DOI] [PubMed] [Google Scholar]
- Church PJ, Lloyd PE. Activity of multiple identified motor neurons recorded intracellularly during evoked feedinglike motor programs in Aplysia. J Neurophysiol 72: 1794–1809, 1994 [DOI] [PubMed] [Google Scholar]
- Crandall SR, Adam M, Kinnischtzke AK, Nick TA. HVC neural sleep activity increases with development and parallels nightly changes in song behavior. J Neurophysiol 98: 232–240, 2007 [DOI] [PMC free article] [PubMed] [Google Scholar]
- Day NF, Kinnischtzke AK, Adam M, Nick TA. Daily and developmental modulation of “premotor” activity in the birdsong system. Dev Neurobiol 69: 796–810, 2009 [DOI] [PMC free article] [PubMed] [Google Scholar]
- Debanne D, Boudkkazi S, Campanac E, Cudmore RH, Giraud P, Fronzaroli-Molinieres L, Carlier E, Caillard O. Paired-recordings from synaptically coupled cortical and hippocampal neurons in acute and cultured brain slices. Nat Protoc 3: 1559–1568, 2008 [DOI] [PubMed] [Google Scholar]
- Dutar P, Vu HM, Perkel DJ. Multiple cell types distinguished by physiological, pharmacological, and anatomic properties in nucleus HVc of the adult zebra finch. J Neurophysiol 80: 1828–1838, 1998 [DOI] [PubMed] [Google Scholar]
- Frazier WT, Kandel ER, Kupfermann I, Waziri R, Coggeshall RE. Morphological and functional properties of identified neurons in the abdominal ganglion of Aplysia californica. J Neurophysiol 30: 1288–1351, 1967 [Google Scholar]
- Gray CM, Maldonado PE, Wilson M, McNaughton BL. Tetrodes markedly improve the reliability and yield of multiple single-unit isolation from multi-unit recordings in cat striate cortex. J Neurosci Methods 63: 43–54, 1995 [DOI] [PubMed] [Google Scholar]
- Hahnloser RH, Kozhevnikov AA, Fee MS. An ultra-sparse code underlies the generation of neural sequences in a songbird. Nature 419: 65–70, 2002 [DOI] [PubMed] [Google Scholar]
- Hahnloser RH, Kozhevnikov AA, Fee MS. Sleep-related neural activity in a premotor and a basal-ganglia pathway of the songbird. J Neurophysiol 96: 794–812, 2006 [DOI] [PubMed] [Google Scholar]
- Hargreaves EL, Rao G, Lee I, Knierim JJ. Major dissociation between medial and lateral entorhinal input to dorsal hippocampus. Science 308: 1792–1794, 2005 [DOI] [PubMed] [Google Scholar]
- Harris KD, Hirase H, Leinekugel X, Henze DA, Buzsáki G. Temporal interaction between single spikes and complex spike bursts in hippocampal pyramidal cells. Neuron 32: 141–149, 2001 [DOI] [PubMed] [Google Scholar]
- Harris-Warrick RM, Marder E. Modulation of neural networks for behavior. Annu Rev Neurosci 14: 39–57, 1991 [DOI] [PubMed] [Google Scholar]
- Herfst LJ, Brecht M. Whisker movements evoked by stimulation of single motor neurons in the facial nucleus of the rat. J Neurophysiol 99: 2821–2832, 2008 [DOI] [PubMed] [Google Scholar]
- Hill SJ, Oliver DL. Visualization of neurons filled with biotinylated-lucifer yellow following identification of efferent connectivity with retrograde transport. J Neurosci Methods 46: 59–68, 1993 [DOI] [PubMed] [Google Scholar]
- Jackson JC, Johnson A, Redish AD. Hippocampal sharp waves and reactivation during awake states depend on repeated sequential experience. J Neurosci 26: 12415–12426, 2006 [DOI] [PMC free article] [PubMed] [Google Scholar]
- Johnson A, Redish AD. Neural ensembles in CA3 transiently encode paths forward of the animal at a decision point. J Neurosci 27: 12176–12189, 2007 [DOI] [PMC free article] [PubMed] [Google Scholar]
- Kozhevnikov AA, Fee MS. Singing-related activity of identified HVC neurons in the zebra finch. J Neurophysiol 97: 4271–4283, 2007 [DOI] [PubMed] [Google Scholar]
- Lim HH, Anderson DJ. Antidromic activation reveals tonotopically organized projections from primary auditory cortex to the central nucleus of the inferior colliculus in guinea pig. J Neurophysiol 97: 1413–1427, 2007 [DOI] [PubMed] [Google Scholar]
- Lipski J. Antidromic activation of neurones as an analytic tool in the study of the central nervous system. J Neurosci Methods 4: 1–32, 1981 [DOI] [PubMed] [Google Scholar]
- Long M, Jin D, Fee M. Support for a synaptic chain model of neuronal sequence generation. Nature 468: 394–399, 2010 [DOI] [PMC free article] [PubMed] [Google Scholar]
- Margoliash D. Acoustic parameters underlying the responses of song-specific neurons in the white-crowned sparrow. J Neurosci 3: 1039–1057, 1983 [DOI] [PMC free article] [PubMed] [Google Scholar]
- Margoliash D, Fortune ES. Temporal and harmonic combination-sensitive neurons in the zebra finch's HVc. J Neurosci 12: 4309–4326, 1992 [DOI] [PMC free article] [PubMed] [Google Scholar]
- McNaughton BL, O'Keefe J, Barnes CA. The stereotrode: a new technique for simultaneous isolation of several single units in the central nervous system from multiple unit records. J Neurosci Methods 8: 391–397, 1983 [DOI] [PubMed] [Google Scholar]
- Mooney R. Different subthreshold mechanisms underlie song selectivity in identified HVc neurons of the zebra finch. J Neurosci 20: 5420–5436, 2000 [DOI] [PMC free article] [PubMed] [Google Scholar]
- Mooney R, Prather JF. The HVC microcircuit: the synaptic basis for interactions between song motor and vocal plasticity pathways. J Neurosci 25: 1952–1964, 2005 [DOI] [PMC free article] [PubMed] [Google Scholar]
- Nádasdy Z, Hirase H, Czurko A, Csicsvari J, Buzsaki G. Replay and time compression of recurring spike sequences in the hippocampus. J Neurosci 19: 9497–9507, 1999 [DOI] [PMC free article] [PubMed] [Google Scholar]
- Nicolelis MA, Ghazanfar AA, Faggin BM, Votaw S, Oliveira LM. Reconstructing the engram: simultaneous, multisite, many single neuron recordings. Neuron 18: 529–537, 1997 [DOI] [PubMed] [Google Scholar]
- Nottebohm F, Stokes TM, Leonard CM. Central control of song in the canary, Serinus canarius. J Comp Neurol 165: 457–486, 1976 [DOI] [PubMed] [Google Scholar]
- Prather JF, Peters S, Nowicki S, Mooney R. Precise auditory-vocal mirroring in neurons for learned vocal communication. Nature 451: 305–310, 2008 [DOI] [PubMed] [Google Scholar]
- Ranck JB., Jr Which elements are excited in electrical stimulation of mammalian central nervous system: a review. Brain Res 98: 417–440, 1975 [DOI] [PubMed] [Google Scholar]
- Richmond BJ, Optican LM, Spitzer H. Temporal encoding of two-dimensional patterns by single units in primate primary visual cortex. I. Stimulus-response relations. J Neurophysiol 64: 351–369, 1990 [DOI] [PubMed] [Google Scholar]
- Schmidt MF, Konishi M. Gating of auditory responses in the vocal control system of awake songbirds. Nat Neurosci 1: 513–518, 1998 [DOI] [PubMed] [Google Scholar]
- Schmitzer-Torbert N, Jackson JC, Henze D, Harris K, Redish AD. Quantitative measures of cluster quality for use in extracellular recordings. Neuroscience 131: 1–11, 2005 [DOI] [PubMed] [Google Scholar]
- Selverston AI, Russell DF, Miller JP. The stomatogastric nervous system: structure and function of a small neural network. Prog Neurobiol 7: 215–290, 1976 [DOI] [PubMed] [Google Scholar]
- Shank SS, Margoliash D. Sleep and sensorimotor integration during early vocal learning in a songbird. Nature 458: 73–77, 2009 [DOI] [PMC free article] [PubMed] [Google Scholar]
- Simpson HB, Vicario DS. Brain pathways for learned and unlearned vocalizations differ in zebra finches. J Neurosci 10: 1541–1556, 1990 [DOI] [PMC free article] [PubMed] [Google Scholar]
- Soteropoulos DS, Baker SN. Cortico-cerebellar coherence during a precision grip task in the monkey. J Neurophysiol 95: 1194–1206, 2006 [DOI] [PubMed] [Google Scholar]
- Steinberg RH, Schmidt R. Identification of horizontal cells as S-potential generators in the cat retina by intracellular dye injection. Vision Res 10: 817–820, 1970 [DOI] [PubMed] [Google Scholar]
- Stent GS, Kristan WB, Jr, Friesen WO, Ort CA, Poon M, Calabrese RL. Neuronal generation of the leech swimming movement. Science 200: 1348–1357, 1978 [DOI] [PubMed] [Google Scholar]
- Swadlow HA. Neocortical efferent neurons with very slowly conducting axons: strategies for reliable antidromic identification. J Neurosci Methods 79: 131–141, 1998 [DOI] [PubMed] [Google Scholar]
- Vu ET, Mazurek ME, Kuo YC. Identification of a forebrain motor programming network for the learned song of zebra finches. J Neurosci 14: 6924–6934, 1994 [DOI] [PMC free article] [PubMed] [Google Scholar]
- Wild JM, Williams MN, Howie GJ, Mooney R. Calcium-binding proteins define interneurons in HVC of the zebra finch (Taeniopygia guttata). J Comp Neurol 483: 76–90, 2005 [DOI] [PubMed] [Google Scholar]
- Witham CL, Baker SN. Network oscillations and intrinsic spiking rhythmicity do not covary in monkey sensorimotor areas. J Physiol 580: 801–814, 2007 [DOI] [PMC free article] [PubMed] [Google Scholar]
- Yoshimura Y, Callaway EM. Fine-scale specificity of cortical networks depends on inhibitory cell type and connectivity. Nat Neurosci 8: 1552–1559, 2005 [DOI] [PubMed] [Google Scholar]


