Abstract
The X- and W-band electron paramagnetic resonance (EPR) spectroscopies were employed to investigate a series of imidazolidine nitroxide radicals with different number of ethyl and methyl substituents at positions 2 and 5 of a heterocycle in liquid and frozen solutions. The influence of the substituents on the line shape and width was studied experimentally and analyzed using quantum chemical calculations. Each pair of the geminal ethyl groups in the positions 2 or 5 of the imidazolidine ring was found to produce an additional hyperfine splitting (hfs) of about 0.2 mT in the EPR spectra of the nitroxides. The effect was attributed to the hfs constant of only one of four methylene hydrogen atoms of two geminal ethyl substituents not fully averaged by ethyl group rotation and ring puckering. In accordance with this assumption, the substitution of hydrogen atoms of CH2 groups in 2,2,5,5-tetraethyl-substituted imidazolidine nitroxides by deuterium leads to the substantial narrowing of EPR lines which could be useful for many biochemical and biomedical applications, including pH-monitoring. W-band EPR spectra of 2,2,5,5-tetraethyl-substituted imidazolidine nitroxide and its 2,2,5,5-tetraethyl–d8 deuterium-substituted analog measured at low temperatures demonstrated high sensitivity of their g-factors to pH, which indicates their applicability as spin labels possessing high stability.
1 Introduction
Stable nitroxide radicals are used intensively as probes for measurement of oxygen [1, 2], pH [3–5], glutathione [6, 7], redox state [8, 9] in living tissues, for structural studies of biological macromolecules [10], as magnetic resonance imaging contrast agents [11, 12] and in other fields [13–16]. The nitroxide radicals of imidazoline and imidazolidine types were shown to reveal the changes in their electron paramagnetic resonance (EPR) spectra due to reversible protonation of N-3 nitrogen [17] of the radical heterocycle and are widely used as pH-probes [4, 5, 14, 15]. However, instability of the paramagnetic N–O· fragment towards chemical reduction is an unavoidable factor that significantly limits their application, particularly in biological systems. Dependence of nitroxides stability towards reduction on their structure has been the subject of numerous investigations [18–22]. It has been found recently that bulky alkyl groups adjacent to the N–O· fragment significantly increase the stability of nitroxides towards reduction by ascorbate, blood and tissue homogenates [23–26], e.g., 3,4-dimethyl-2,2,5,5-tetraethylimidazolidine-1-oxyl (In4, see Scheme 1) showed 40 times lower rate of reduction by ascorbate than its 2,2,5,5-tetramethyl analogue (In1, Scheme 1). These radicals have pH-dependent EPR spectra with pKa in the physiological range of pH from 4 to 6, and their enhanced stability towards reduction is very important for in vivo and in vitro pH assessment in biological systems. However, introduction of several bulky alkyl groups to α-carbons of nitroxide moiety may lead to significant broadening of EPR lines, which demolishes the advantage in stability. A similar line-broadening effect has been previously reported for piperidine nitroxides with bulky spiro-cyclohexyl rings in the positions 2 and 6 of the heterocycle [25, 26].
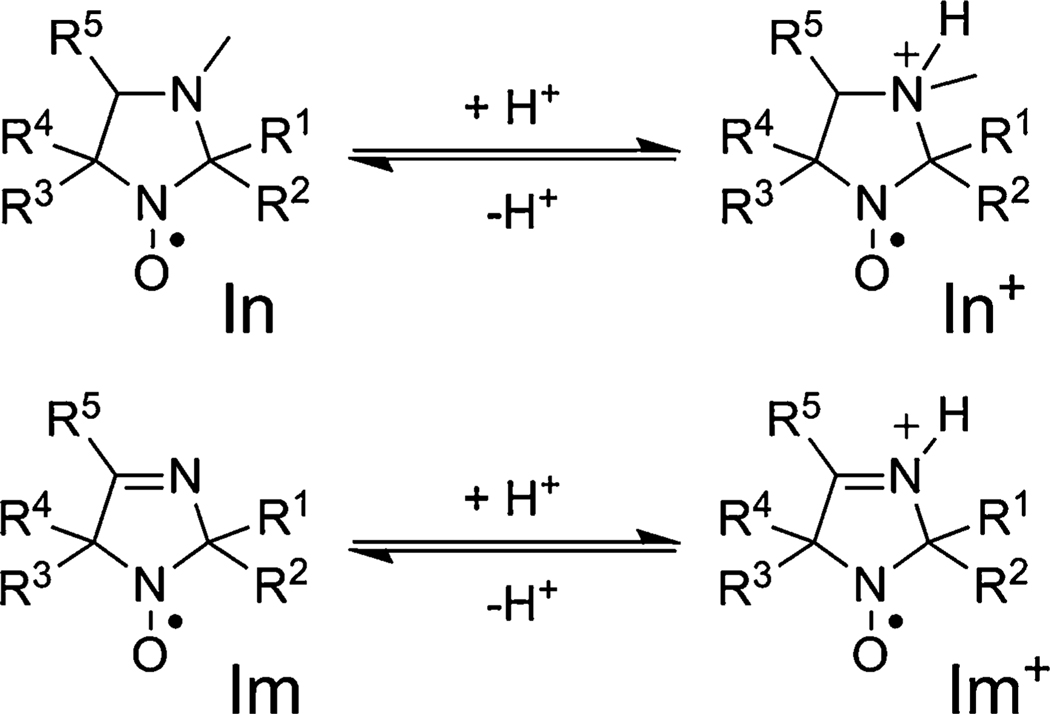
Scheme 1.
Reversible protonation of imidazoline (Im) and imidazolidine (In) nitroxides. For Ri see Table 1
In order to clarify the nature of line broadening in the EPR spectra of the nitroxides with bulky substituents and to estimate their applicability as spin probes and spin labels for pH measurements, we performed X- and W-band EPR investigations of a series of imidazoline and imidazolidine nitroxides with methyl and ethyl substituents, and corresponding quantum chemical calculations.
2 Materials, Methods and Computational Details
2.1 Synthesis
The nitroxide radicals were synthesized according to the previously described methods (In1 [27], In2, In3, In5–In10 [28], In4, Im2 and Im1 [29], see Table 1; Scheme 1).
Table 1.
Spectroscopic parameters of the imidazoline (Im) and imidazolidine (In) nitroxides and their protonated forms (in parenthesis)
| R1 | R2 | R3 | R4 | R5 |
aN (mT) H2O/NaOH (H2O/HCl) |
aH1 (mT) H2O/NaOH (H2O/HCl) |
aH2 (mT) H2O/NaOH (H2O/HCl) |
aN (mT) toluene |
aH1 (mT) toluene |
aH2 (mT) toluene |
|
|---|---|---|---|---|---|---|---|---|---|---|---|
| Im1 | Me | Me | Me | Me | Me | 1.566 (1.480) | −/− | −/− | 1.422 | – | – |
| Im2 | Et | Et | Et | Et | Me | 1.517 (1.418) | −/− | −/− | 1.374 | – | – |
| In1 | Me | Me | Me | Me | Me | 1.601 (1.476) | −/− | −/− | 1.439 | – | – |
| In2 | Et | Et | Me | Me | Me | 1.552 (1.420) | 0.143 (0.191) | −/− | 1.385 | 0.143 | – |
| In3 | Me | Me | Et | Et | Me | 1.569 (1.432) | 0.201 (0.245) | −/− | 1.398 | 0.158 | – |
| In4 | Et | Et | Et | Et | Me | 1.528 (1.392) | 0.242 (0.256) | 0.181 (0.205) | 1.369 | 0.206 | 0.173 |
| In4d | CD2CH3 | CD2CH3 | CD2CH3 | CD2CH3 | Me | 1.530 (1.395) | −/− | −/− | |||
| In5 | C4H9 | C4H9 | Me | Me | Me | 1.566 (1.436) | 0.140 (0.190) | −/− | |||
| In6 | (CH2)4 | Me | Me | Me | 1.614 (1.476) | −/− | −/− | ||||
| In7 | (CH2)5 | Me | Me | Me | 1.593 (1.465) | 0.274 (0.275) | −/− | ||||
| In8 | (CH2)5 | Et | Et | Me | 1.544 (1.408) | 0.250 (0.270) | 0.070 (0.090) | ||||
| In9 | Me | Me | Me | (CH2)4 | 1.614 (1.484) | 0.137 (0.124) | −/− | ||||
| In10 | (CH2)5 | Me | (CH2)4 | 1.620 (1.495) | 0.270 (0.272) | 0.063 (0.063) |
Accuracy of hyperfine splitting constants measurement is 0.007 mT
3,4-Dimethyl-2,2,5,5-tetraethyl-perhydroimidazole-1-oxyl-D9+ (In4d) was synthesized according to the procedure proposed for non-deuterated nitroxide In4 using bromoethane-D5 and D2O as isotope-containing starting materials (Scheme 1). 3-Pentanone was repeatedly stirred with 5% solution of NaOD in D2O until methylene proton signals disappeared in the nuclear magnetic resonance 1H spectrum, dried with MgSO4 and distilled. The 3-pentanone-D4 (10 ml, 0.09 mol) was added dropwise to ethylmagnesium bromide solution, prepared from bromoethane-D5 (11.4 g, 0.1 mol), Mg (3 g, 0.125 mol) and dry diethyl ether (50 ml). After addition was over, the reaction mixture was stirred for 1 h and quenched with saturated NaCl solution. The organic layer was separated, dried with Na2CO3 and the ether was distilled off. Iodine (50 mg) was added to the residue and the mixture was heated to boiling, and 3-ethylpentene-2-D7 formed was slowly distilled with water. The organic layer was separated, dried with MgSO4 and distilled again. 3-Ethyl-pentene-2-D7 was then converted into 3-hydroxyamino-3-ethylpentan-2-one-D5 hydrochloride using the procedures described for non-deuterated compounds; overall yield was 5.9 g (32%). The obtained material (3 g, 16 mmol) was enriched with deuterium using repetitive dissolving in methanol-D and evaporation of the solvent under reduced pressure. Then ND4OAc (4.9 g, 60 mmol), 3-pentanone-D4 (5.4 g, 60 mmol) and methanol-D (5 ml) were added, the reaction mixture was thoroughly degassed using bubbling with argon and sealed up. The mixture was stirred for 21 days under argon, then the flask was opened and the solvents were removed under reduced pressure. The residue was dissolved in water (30 ml), basified with NaHCO3 and extracted with diethyl ether. The extract was washed with water, and dried with Na2CO3. Then MnO2 (4 g, 46 mmol) was added and the mixture was stirred for 1 h. The manganese oxides were filtered off, ether was removed under reduced pressure and the residue was separated using column chromatography on silica gel (eluent hexane–diethyl ether, 20:1) to give 2.1 g (57%) of 4-methyl-2,2,5,5-tetraethyl-2,5-dihydroimidazole-1-oxyl-D9+. The latter was then converted into nitroxide In4d using the procedures described for non-deuterated compounds.
2.2 X-Band EPR Characterization of Nitroxides in Aqueous Solutions
The 0.5 mM nitroxide solutions were prepared by dissolving in water containing 0.01 M HCl or 0.01 M NaOH. The poorly soluble nitroxides were first dissolved in acetone or dimethyl sulfoxide (DMSO) and then added to the solution (the content of acetone or DMSO in final solutions was less than 5%). EPR spectra were recorded on a Bruker ER-200D-SRC or Bruker EMX spectrometer using 50 µl quartz capillaries with an inner diameter ID = 0.8 mm, placed in a rectangular TE102 resonator. Typical experimental EPR settings were: sweep width, 60 G; microwave power, 10 mW; modulation frequency, 100 kHz; modulation amplitude, 0.5 G; time constant, 40.96 ms; sweep time, 83.89 s; number of points, 1,024; and harmonic, first. Simulation of EPR spectra was performed using the WINSIM software [30].
2.3 X-Band EPR Characterization of Nitroxides in Toluene at Various Temperatures
Nitroxides (50 µM) In2, 3, and 4 were dissolved in toluene, deoxygenated by several freeze–pump–thaw cycles to 10−5 mbar, and sealed off under 100 mbar of He in conventional EPR tubes with an inner diameter of 3 mm. EPR spectra were recorded on an EMX spectrometer (Bruker) equipped with a temperature controller at various temperatures. Typical EPR settings were: sweep width, 10–15 G; microwave power, 10 mW; modulation amplitude, 0.5 G; time constant, 40.96 ms; sweep time, 83.89 s; and number of points, 1,024.
2.4 W-Band EPR Characterization of Nitroxides
The W-band EPR spectra (95 GHz/3.4 T) were recorded on laboratory-built spectrometers described elsewhere [31, 32]. Nitroxides (50 µM) were dissolved in buffer solution with addition of 30% of glycerol and placed into capillaries with an inner diameter of 0.1 mm. EPR spectra of frozen solutions were simulated using the EasySpin software [33].
2.5 Quantum Chemical Calculations
Geometries of a series of conformations of the imidazoline and imidazolidine nitroxides with different alkyl substituents at positions 2 and 5 of the heterocycle were optimized at the UB3LYP/6-31G(d) level [34, 35]. The hyperfine splitting (hfs) constants were calculated at the same level of theory. All calculations were performed with the Gaussian-03 [36] suite of programs. The influence of a solvent on the hfs constants was taken into account using the polarizable continuum model [37]. The results of the UB3LYP calculations did not suffer from the spin contamination effects; the expectation values of S2 were within 0.754–0.756 for all studied radicals.
3 Results and Discussion
3.1 X-Band EPR Characterization of the Substituted Imidazoline and Imidazolidine Nitroxides
The EPR spectra of the imidazoline (Im) and imidazolidine (In) nitroxides in liquid solution show a triplet pattern resulting from hfs on the 14N (I = 1) atom of N–O· moiety. Reversible protonation of the N-3 atom of the radical heterocycle (see Scheme 1) affects spectroscopic parameters (hfs constants, g-factors), which allows to measure pH changes using the EPR technique [17]. The structures of imidazoline-type (Im) and imidazolidine-type (In) nitroxides studied in this paper are represented in Scheme 1.
The pKa values of the imidazolidine nitroxides lay in the range of 4.3–5 [38], e.g., pKa are equal to 4.7 for In1, 4.7 for In3, and 4.95 for In4 [24], whereas for imidazoline, pKa are equal to 1.3 for Im1 and 1.2 for Im4 [24]. The parameters of protonated and deprotonated forms were determined using the procedure similar to that described in Ref. [17]. First, the pH dependence of the EPR spectra was measured, and then the observed two superimposed triplets (at pH close to pKa) as well as hfs and g-factors of these triplet spectra were assigned to protonated and deprotonated forms. The measured parameters of the EPR spectra correspond to pH ≪ pKa (0.01 M HCl, pH 2) and pH ≫ pKa (0.01 M NaOH, pH 12) for protonated and deprotonated forms, respectively. The EPR spectra measured at these specific conditions were assigned to the protonated and deprotonated forms of the radicals.
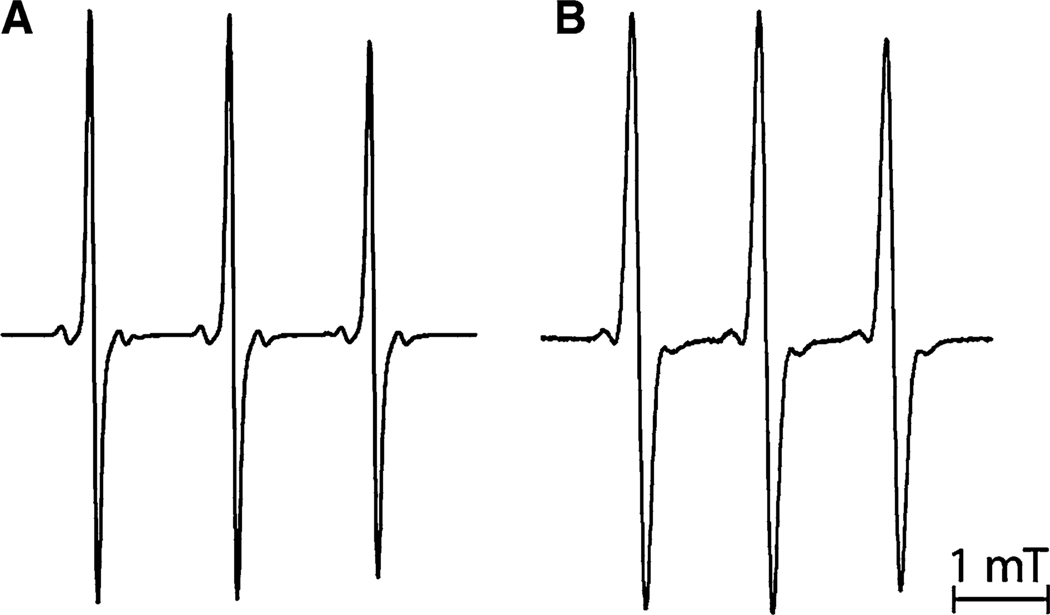
The replacement of methyl groups by ethyl groups at positions 2 and 5 of the heterocycle results in broadening of the components of the EPR spectra of Im nitroxides and in revealing additional hfs of the EPR lines for In nitroxides. Figure 1 shows the EPR spectra of protonated tetramethyl substituted (Im1, spectrum A) and tetraethyl substituted (Im2, spectrum B) imidazoline nitroxides measured in 0.01 M HCl. The line width increased from 0.083 mT for Im1 to 0.152 mT for Im2, apparently due to additional unresolved hfs on protons of ethyl groups. A similar effect was observed for deprotonated forms of the nitroxides measured in 0.01 M NaOH (data not shown).
Fig. 1.
EPR spectra of 0.5 mM aqueous solutions of the imidazoline nitroxides Im1 (a) and Im2 (b) recorded in the presence of 0.01 M HCl at room temperature
The EPR spectra of 0.01 M HCl solutions of 2,2,5,5-tetramethyl-4-methyl-substituted imidazolidine (In1, spectrum A), 2,2-diethyl-5,5-dimethyl-4-methyl-substituted imidazolidine (In2, spectrum B), 2,2-dimethyl-5,5-diethyl-4-methyl- substituted imidazolidine (In3, spectrum C), and 2,2,5,5-tetraethyl-substituted imidazolidine (In4, spectrum D) nitroxides are shown in Fig. 2. In contrast to imidazoline nitroxides, the introduction of two ethyl groups at position 2 or 5 of the imidazolidine heterocycle resulted in appearance of an additional doublet splitting of each 14N hyperfine line of the EPR spectrum (see Fig. 2b, c). Moreover, substitution of all methyl groups by ethyl groups at both positions 2 and 5 of the heterocycle resulted in additional quadruplet splitting (see Fig. 2d; Table 1).
Fig. 2.
X-band EPR spectra of 0.5 mM aqueous solutions of the imidazolidine-type nitroxides In1 (a), In2 (b), In3 (c), and In4 (d) recorded in the presence of 0.01 M HCl at room temperature
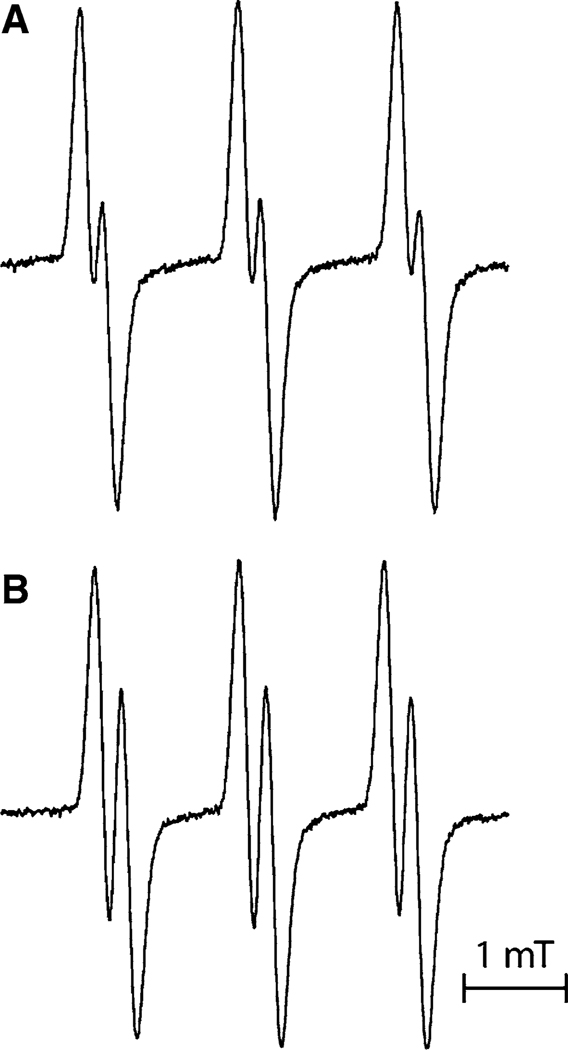
As mentioned above, the nitrogen hfs constant depends on the medium pH. In order to verify the pH dependence of additional splitting, the EPR spectra were measured for both the protonated and deprotonated forms of nitroxides. As an example, Fig. 3 presents the EPR spectra of protonated and deprotonated forms of imidazolidine nitroxide In3 measured in 0.01 M HCl and 0.01 M NaOH, respectively. Both the hfs constants on the 14N-1 atom and additional doublet hfs were found to be significantly different in protonated and deprotonated forms and are summarized in Table 1. Note that nitrogen hfs constants decrease upon protonation, whereas additional hfs constants assigned to protons increase (see Table 1; Fig. 3).
Fig. 3.
X-band EPR spectra of 0.5 mM aqueous solutions of the nitroxide In3 measured in the presence of 0.01 M NaOH (a) and 0.01 M HCl (b)
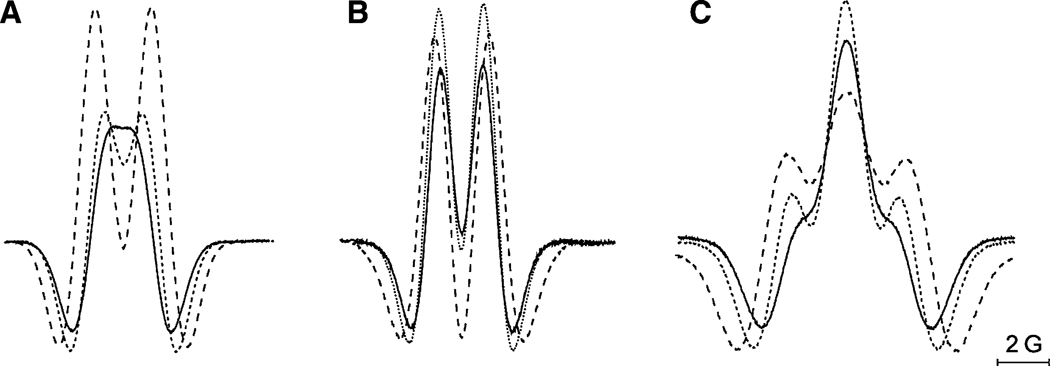
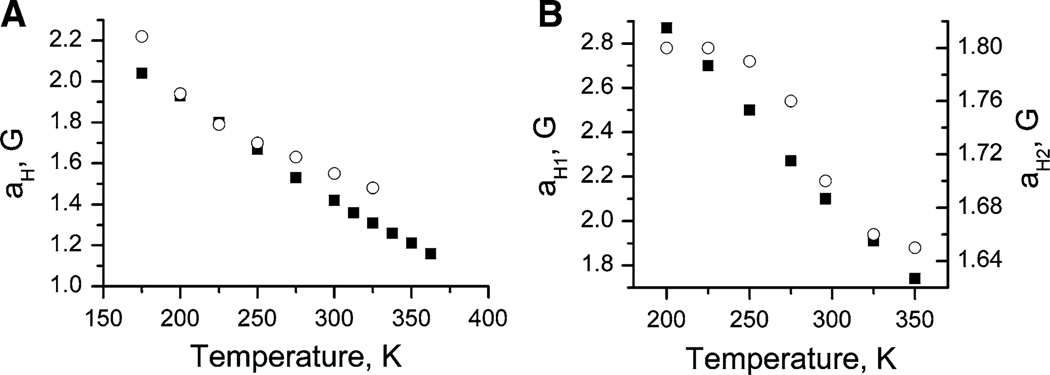
A similar observation of proton hyperfine splitting was published by Khramtsov et al. [1] for 5,5-dimethyl-2-methoxy-2-(2-methoxycarbonylethyl)-4-phenyl-2,5-dihydroimidazole-1-oxyl 3-oxide [4]. The authors [1] were able to measure the splitting constant of about 0.07 mT assigned to hyperfine interaction with one of the methylene protons of the (CH)2COOCH3 group. This hfs was found to be temperature-dependent, decreasing upon temperature increase. A similar dependence of the proton hfs constant on temperature was observed for diethyl- and tetraethyl-substituted imidazolidines In2, In3, and In4 as illustrated in Figs. 4 and 5. Figure 4 represents the second derivative of the central component of the EPR spectra of the In nitroxides dissolved in toluene. The proton hfs constants decreased with increasing temperature, resulting in the collapse of the doublet splitting into an unresolved singlet line at temperatures above 350 K in the case of In2. Figure 5 shows the temperature dependence of the proton hfs for ethyl-substituted imidazolidines In2, In3, and In4.
Fig. 4.
Central components of the second-derivative continuous-wave EPR spectra of imidazolidine nitroxides In2 (a), In3 (b) and In4 (c) measured at 250 K, dashed line; 300 K, dotted line; and 350 K (325 K for In3), straight line
Fig. 5.
Temperature dependencies of the proton hfs constants for nitroxide In2 (filled squares) and In3 (open circles) (a), and In4 (b). Data for nitroxide In3 at temperatures above 325 K is unavailable due to radical decomposition. For nitroxide In4, two different proton hfs constants, aH1 and aH2 (see Table 1), are denoted by filled squares and open circles, respectively
It is clear that the observed temperature dependences of the additional splitting and line broadening indicate the conformational changes in the nitroxide molecules. Note that there are four protons of two CH2 groups at each of the positions 2 and 5 of the radical heterocycle, whereas hfs of only one proton is evident in the EPR spectra (see Figs. 2, 4). In order to interpret the EPR spectra of the nitroxides In2, In3, and In4 and their temperature dependences, we employed the quantum chemical calculations.
Magnetic properties of a series of nitroxides, including 2,2,5,5-tetramethyl-4-methyl-imidazoline nitroxide, Im1, have been previously analyzed in detail using density functional theory (DFT) calculations [39, 40]. It is well documented that all DFT methods underestimate the absolute values of isotropic hfs constants of the nitrogen atom of nitroxides (aN). These hfs constants could be quantitatively predicted using high-level calculations as well as vibrational averaging. Moreover, the formation of nitroxide complexes with two water molecules should be taken into account to predict quantitatively the aN value in water. Taking all these effects into account provide the possibility to calculate the magnetic titration curve for Im1 in quantitative agreement with the experiment [40].
On the other hand, it is well known that simple B3LYP calculations predict fairly well the hfs constants of hydrogen atoms of organic radicals [39, 41]. The main purpose of our calculations is to reveal the influence of the alkyl substituents at positions 2 and 5 on the EPR spectra of nitroxides. Therefore, we employed the simple B3LYP/6-31G(d) method to calculate the hfs constants and free energies of different conformations of In and Im nitroxides, and the free energy of activation for the transitions between these conformers.
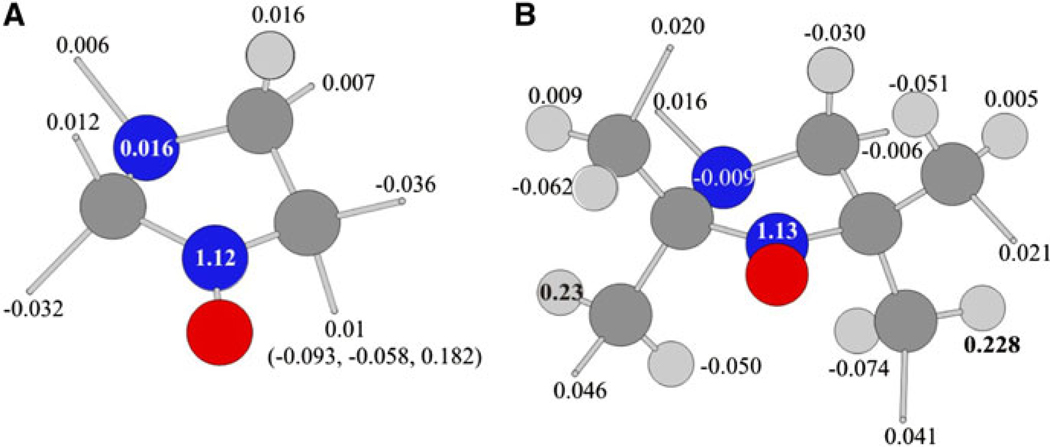
Figure 6 represents calculated hfs constants of nitrogen and hydrogen atoms of nitroxide In1 and In4. The hfs constants of methyl groups are usually averaged due to their fast rotation around the C–C bond on the EPR time scale. The averaged values are very low (0.01 mT) and contribute only to small broadening of the EPR lines. The calculations predict that the free energy of activation for the rotation of methyl groups at position 5 (In1) is 4.4 kcal/mol. The rate constant of this rotation at room temperature is calculated to be 3.9 × 10⁻⁹ s−1, which is really fast on the EPR time scale.
Fig. 6.
Structures of imidazolidine radicals In1 (a) and In4 (b), and values of the hfs constants calculated by the B3LYP/6-31G(d) method. For methyl groups the average values are shown. Methyl groups are represented by gray sticks
Figure 6b displays the hfs constants calculated for one of the low-energy conformers of tetraethyl-substituted imidazolidine, In4. It demonstrates that only two aH values for four CH2 groups are high enough (about 0.23 mT), the absolute values of all others do not exceed 0.05 mT. Similar situation was observed for all conformers optimized for rotation of ethyl groups. The aH constants for methyl groups were averaged as the rate constant of their rotation at room temperature is calculated to be 2.2 × 10¹⁰ s−1.
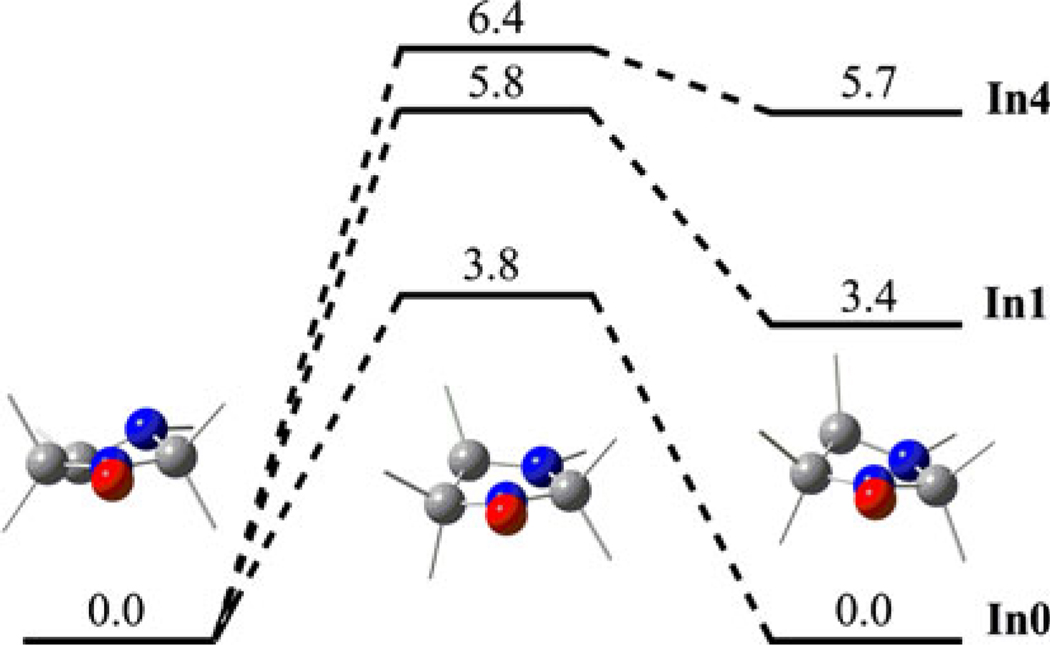
To interpret the temperature dependence of the experimental aH values we analyzed the dynamics of the radical structure. As a matter of fact, two types of motions can modulate aH hfs constants, notably, the rotation of alkyl groups and the ring puckering. We calculated stationary points on the potential energy surface (PES) for the ring puckering of unsubstituted nitroxide In1 and its derivatives, In2 and In4. Figure 7 demonstrates that conformers of unsubstituted nitroxide In1 have the same energy and ring puckering proceeds at room temperature with a high rate constant (k ~ 1010 s−1). Situation is different in the case of nitroxides In2 and In4, notably, one conformer is much more preferable than the other. Thus, calculations predict that ring puckering does not lead to noticeable averaging of the aH hfs constants of nitroxides In1 and In4.
Fig. 7.
Relative free energies (in kcal/mol) of stationary points on the PES for ring puckering of the selected In nitroxides. Me and Et groups are represented by gray sticks
In addition, we calculated the stationary points on the PES for rotation of ethyl groups. There is a large set of minima on the PES for rotation of ethyl groups in the tetraethyl-substituted In4. The free energies of different structures obtained by rotation of ethyl groups at position 2 were predicted to differ within 3 kcal/mol. The free energies of activation for these rotations were predicted within 6.5–7.7 kcal/mol. Thus, these rotations have enough low rate constants at room temperature (in the range of 107–108 s−1). Therefore, calculations predict that additional splitting of about 0.2 mT in the EPR spectra of ethyl-substituted imidazolidines arises from the hfs constant of only one of four methylene hydrogens of two geminal ethyl substituents. The rotation of the ethyl groups is retarded when compared to methyl groups due to sterical hindrance, and the hfs constants of the protons of methylene groups are not rotationally averaged in contrast to those of methyl groups.
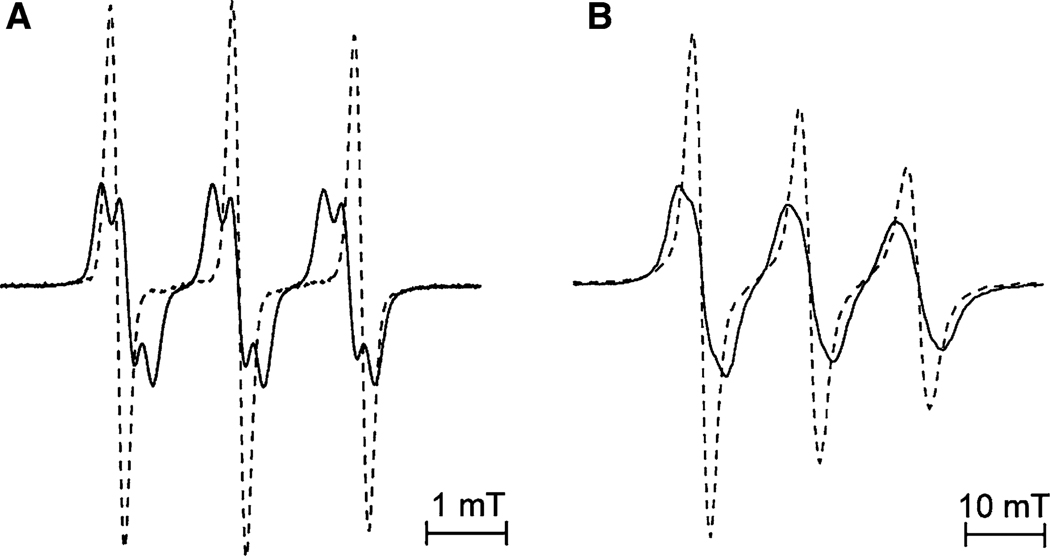
To confirm the assignment of the aH constants, the deuterium-substituted imidazolidine In4d (see Scheme 1; Table 1) was synthesized. Figure 8 presents the EPR spectra of In4 and In4d nitroxides in water solution at pH 3.0 at X-band (spectrum A) and W-band (spectrum B). The most important difference between these spectra is the presence of splitting in the spectrum of In4 radical and its absence in the spectrum of its deuterated analog In4d. These data unambiguously confirm that additional hfs constants originate from methylene protons of the ethyl groups.
Fig. 8.
X- (a) and W-band (b) EPR spectra of 0.5 mM aqueous solutions of nitroxide In4 (solid line) and its deuterated analog In4d (dashed line) measured at pH 3.0 and temperature 293 K
Temperature dependences of the observed aH constants shown in Figs. 4 and 5 could be used to estimate the activation energy of transitions between the conformers. Unfortunately we failed to simulate the EPR spectra of In2, In3 and In4 at different temperatures by taking into account the exchange interaction and assuming different contributions of the Gaussian and Lorentzian shapes. The estimated rate of exchange (assuming the two-position model), with taking into account the aH values of 0.25 mT at T = 175 K and 0.16 mT at 365 K, is in the range of 5 × 10⁶–2.5 × 10⁷ s−1 for T = 200–350 K. The obtained values of activation energy lie in the range of 2–1.5 kcal/mol for In2 and 1.5–0.7 kcal/mol for In3, and the pre-exponential factors are in the range of 107–108 s−1. The obtained values of activation energy and pre-exponential factors are unreasonably low. The reason for this can be the use of a simplified two-position model for a complicated process of transition between a big set of conformers with different relative energies.
As discussed above, the calculations predict relatively high activation energy for ethyl group rotation, implying that the observed spectra of In2, In3, and In4 at ambient temperatures should correspond to slow-to-medium exchange on the EPR time scale. Meanwhile, calculations predict for all low-energy conformers only one large aH constant (ca. 0.2 mT) for a pair of geminal ethyl groups. The superposition of spectra of different conformers with similar hyperfine structures could not be excluded. Temperature elevation leads to increase of the rate of transitions between the conformers with partial or complete averaging of aH, leading to decrease or disappearance of splitting. The hfs averaging is more effective for 2,2-diethyl-substituted nitroxide In2 than for 5,5-diethyl-substituted In3 (Figs. 6, 7), presumably due to the contribution of the ring puckering into averaging.
The EPR spectra of other sterically substituted nitroxides, In5–In10 (see Scheme 1; Table 1), were studied revealing additional hfs on hydrogens similar to that for In1–In4 (see Table 1). The difference between In6 and In7 (resolved additional hfs on hydrogen for In7 and the absence of additional hfs for In6) is determined by the conformationally more rigid structure of the cyclohexyl ring in In7 in comparison with the cyclopentyl ring in In6.
It is worth to note that we were unable to resolve splitting in the EPR spectrum of tetraethyl-substituted nitroxide Im2. The difference in hyperfine structure of the spectra of Im and In nitroxides results from the difference in geometry of the rings. Due to the planar geometry of the imidazoline ring the rotation of ethyl groups in these nitroxides is less hindered and leads to more effective hfs averaging.
3.2 W-Band EPR Characterization of the Substituted Imidazoline and Imidazolidine Nitroxides
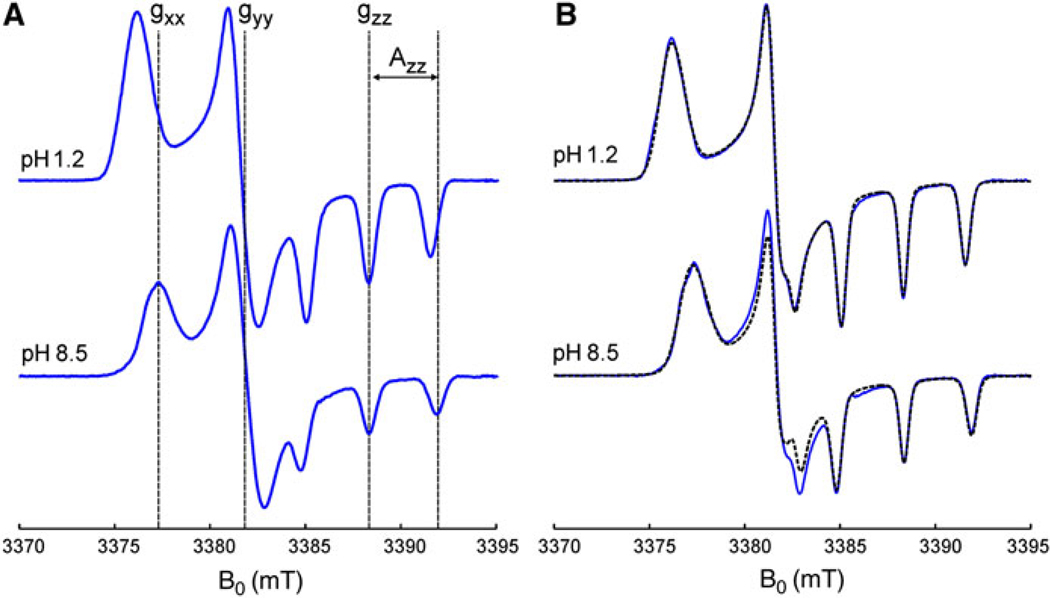
It was demonstrated previously that W-band EPR spectroscopy allows the pKa determination from the precise g-factor measurements. To check the pH-sensitivity of the nitroxides with bulky substituents we employed W-band spectroscopy for the measurement of g-factor changes in frozen solutions. Figure 9 shows the W-band EPR spectra of In4 and its deuterium-substituted analogue In4d in protonated and deprotonated forms measured at 180 K. The low-temperature W-band spectra are typical for the frozen-solution continuous-wave EPR spectra of the nitroxide radicals. They were simulated using a powder pattern and assuming anisotropic hyperfine interaction with the spin of 14N nucleus (I = 1) and an anisotropic g-tensor. Both tensors were supposed to be diagonal in the molecular frame of the nitroxides.
Fig. 9.
W-band continuous-wave EPR spectra of 0.5 mM tetraethyl-substituted In radicals In4 (a) and In4d (b) measured at 180 K in the mixture of glycerol (20%) and phosphate-buffered water solutions, corresponding to fully protonated (pH 1.2) and deprotonated (pH 8.5) forms of the nitroxides. The simulated spectra of In4d with magnetic parameters listed in Table 2 are shown by dashed lines
Dashed lines in Fig. 9 represent the best fits to the experimental EPR spectra obtained using the EasySpin software [33]. The parameters of simulations (the canonical values of the 14N hfs and g-tensors) are listed in Table 2 together with the values predicted at the UB3LYP/6-31G(d) level. The individual line shape was assumed to be Gaussian with a line width of 0.7 mT. For In4, the aH constants obtained by X-band EPR at room temperatures (Table 1) were taken into account. It is seen from Fig. 9 that protonation leads to the substantial change in the gxx component and does not affect the gzz value. The increase of the gxx value upon protonation of In4 by 6.4 × 10−4 is very close to the same value reported for In1 (6.5 × 10⁻⁴) [43]. Thus, the substitution by bulky substituents does not change the pH-sensitivity of g-factors of nitroxides while substantially increases their stability.
Table 2.
Magnetic parameters of tetraethyl-substituted In radicals obtained from the analysis of the W-band EPR spectra and the results of DFT calculations
| Radical | gxx | gyy | gzz | Axx (mT) | Ayy (mT) | Azz (mT) |
|---|---|---|---|---|---|---|
| In4d (pH 8.5) | 2.00860 | 2.00577 | 2.00214 | 0.45a | 0.48a | 3.51 |
| Calculated | 2.00952 | 2.00590 | 2.00206 | 0.67 | 0.69 | 3.23 |
| In4d (pH 1.2) | 2.00928 | 2.00590 | 2.00215 | 0.38a | 0.42a | 3.26 |
| Calculated | 2.01001 | 2.00592 | 2.00206 | 0.60 | 0.68 | 2.87 |
Axx and Ayy values are evaluated from experimental W-band three-pulse electron spin echo envelope modulation spectra (data not shown) as described previously [42]
4 Conclusions
The X- and W-band EPR and quantum chemical studies of the magnetic resonance properties of a series of imidazolidine nitroxides with different alkyl substituents at positions 2 and 5 of the heterocycle demonstrated that an additional splitting of about 0.2 mT in the EPR spectra of ethyl-substituted imidazolidines arises from the hfs constant of only one of four methylene hydrogen atoms of two geminal ethyl substituents. The substantial narrowing of EPR lines in the spectrum of 2,2,5,5-tetraethyl-substituted imidazolidine nitroxide could be achieved by substitution of hydrogen atoms in CH2 groups with deuterium. This finding could be used in the design of spin probes for biochemical applications.
The observed phenomenon is likely to be of general nature. Slow conformation changes in nitroxides with bulky substituents at α-carbons may lead to the line broadening of their EPR spectra. Moreover, this problem can hardly be completely overcome by isotope substitution. Thus, rigid structures seem to be preferable in molecular design of spin probes.
Nevertheless, the imidazolidine radicals with bulky substituents are very perspective pH-probes for in vivo application due to their low reduction rates in living tissues. Deuteration of ethyl groups substantially decreases the EPR line width without changes in the reduction rates. This could be useful for many biochemical and biomedical applications, e.g., pH-monitoring in the stomach [44]. W-band EPR study of 2,2,5,5-tetraethyl-substituted imidazolidine nitroxide and its deuterium-substituted analog at low temperatures of their g-factors to pH, which indicates their applicability as site-directed labeling probes possessing high stability.
Acknowledgments
Support by the Russian Foundation for Basic Research (grants 08-04-00555 and 08-04-00432), Russian Federal Ministry of Science and Education (P 1144), Siberian Supercomputer Center is gratefully acknowledged. A.B. and V.K. acknowledge the support of National Institutes of Health (grants HL089036 and CA132068). We are thankful to Dr. Anton Savitsky (Free University of Berlin) for the measurements of W-band spectra.
Contributor Information
A. A. Bobko, Institute of Chemical Kinetics and Combustion, Russian Academy of Sciences, Novosibirsk 630090, Russia Dorothy M. Davis Heart and Lung Research Institute, The Ohio State University, Columbus, OH 43210, USA.
I. A. Kirilyuk, Novosibirsk Institute of Organic Chemistry, Russian Academy of Sciences, Novosibirsk 630090, Russia
N. P. Gritsan, Institute of Chemical Kinetics and Combustion, Russian Academy of Sciences, Novosibirsk 630090, Russia
D. N. Polovyanenko, International Tomography Center, Russian Academy of Sciences, Institutskaya 3A, Novosibirsk 630090, Russia
I. A. Grigor’ev, Novosibirsk Institute of Organic Chemistry, Russian Academy of Sciences, Novosibirsk 630090, Russia
V. V. Khramtsov, Dorothy M. Davis Heart and Lung Research Institute, The Ohio State University, Columbus, OH 43210, USA
E. G. Bagryanskaya, Email: Elena@tomo.nsc.ru, International Tomography Center, Russian Academy of Sciences, Institutskaya 3A, Novosibirsk 630090, Russia.
References
- 1.Swartz HM, Clarkson RB. Phys. Med. Biol. 1998;43:1957–1975. doi: 10.1088/0031-9155/43/7/017. [DOI] [PubMed] [Google Scholar]
- 2.Velan SS, Spencer RG, Zweier JL, Kuppusamy P. Magn. Reson. Med. 2000;43:804–809. doi: 10.1002/1522-2594(200006)43:6<804::aid-mrm5>3.0.co;2-b. [DOI] [PubMed] [Google Scholar]
- 3.Foster MA, Grigor’ev IA, Lurie DJ, Khramtsov VV, McCallum S, Panagiotelis I, Hutchison JM, Koptioug A, Nicholson I. Magn. Reson. Med. 2003;49:558–567. doi: 10.1002/mrm.10392. [DOI] [PubMed] [Google Scholar]
- 4.Khramtsov VV, Weiner LM, Gogolev A, Grigor’ev IA, Starichenko VF, Volodarsky LB. Magn. Reson. Chem. 1986;24:199–207. [Google Scholar]
- 5.Khramtsov VV, Grigor’ev IA, Foster MA, Lurie DJ. Antioxid. Redox Signal. 2004;6(3):667–676. doi: 10.1089/152308604773934431. [DOI] [PubMed] [Google Scholar]
- 6.Roshchupkina GI, Bobko AA, Bratasz A, Reznikov VA, Kuppusamy P, Khramtsov VV. Free Radic. Biol. Med. 2008;45:312–320. doi: 10.1016/j.freeradbiomed.2008.04.019. [DOI] [PMC free article] [PubMed] [Google Scholar]
- 7.Swartz HM, Khan N, Khramtsov VV. Antioxid. Redox Signal. 2007;9:1757–1771. doi: 10.1089/ars.2007.1718. [DOI] [PMC free article] [PubMed] [Google Scholar]
- 8.Kuppusamy P, Li H, Ilangovan G, Cardounel AJ, Zweier JL, Yamada K, Krishna MC, Mitchell JB. Cancer Res. 2002;62:307–312. [PubMed] [Google Scholar]
- 9.Yamada K, Inoue D, Matsumoto S, Utsumi H. Antioxid. Redox Signal. 2004;6:605–611. doi: 10.1089/152308604773934369. [DOI] [PubMed] [Google Scholar]
- 10.Hubbel WL, Cafiso D, Altenbach C. Nat. Struct. Biol. 2000;7:735–739. doi: 10.1038/78956. [DOI] [PubMed] [Google Scholar]
- 11.Winalski CS, Shortkroff S, Mulkern RV, Schneider E, Rosen GM. Magn. Reson. Med. 2002;48:965–972. doi: 10.1002/mrm.10312. [DOI] [PubMed] [Google Scholar]
- 12.Keana JF, Van Nice FL. Physiol. Chem. Phys. Med. NMR. 1984;16:477–480. [PubMed] [Google Scholar]
- 13.Smirnov AI, Ruuge A, Reznikov VA, Voinov MA, Grigoriev IA. J. Am. Chem. Soc. 2004;126:8872–8880. doi: 10.1021/ja048801f. [DOI] [PubMed] [Google Scholar]
- 14.Voinov MA, Ruuge A, Reznikov VA, Grigor’ev IA, Smirnov AI. Biochemistry. 2008;47:5626–5637. doi: 10.1021/bi800272f. [DOI] [PMC free article] [PubMed] [Google Scholar]
- 15.Tikhonov AN, Agafonov RV, Grigor’ev IA, Kirilyuk IA, Ptushenko VV, Trubitsin BV. Biochim. Biophys. Acta. 2008;1777:285–294. doi: 10.1016/j.bbabio.2007.12.002. [DOI] [PubMed] [Google Scholar]
- 16.Moebius K, Savitsky A, Wegener C, Plato M, Fuchs M, Schnegg A, Dubinskii AA, Grishin YA, Grigor’ev IA, K̈uhn MK, Duche D, Zimmermann H, Steinhoff H-J. Magn. Reson. Chem. 2005;43:4–19. doi: 10.1002/mrc.1690. [DOI] [PubMed] [Google Scholar]
- 17.Khramtsov VV, Weiner LM, Grigoriev IA, Volodarsky LB. Chem. Phys. Lett. 1982;91:69–72. [Google Scholar]
- 18.Kocherginsky N, Swartz HM. Nitroxide Spin Labels Reactions in Biology and Chemistry. Boca Raton: CRC Press; 1995. [Google Scholar]
- 19.Mehlhorn RJ. J. Biol. Chem. 1991;266:2724–2731. [PubMed] [Google Scholar]
- 20.Yelinova VI, Krainev AG, Savelov A, Grigor’ev IA. J. Chem. Soc. Perkin Trans. 1993;2(11):2053–2055. [Google Scholar]
- 21.Bobko AA, Kirilyuk IA, Grigor’ev IA, Zweier JL, Khramtsov VV. Free Radic. Biol. Med. 2007;42(3):404–412. doi: 10.1016/j.freeradbiomed.2006.11.007. [DOI] [PMC free article] [PubMed] [Google Scholar]
- 22.Keana JFW, Pou S, Rosen GM. Magn. Res. Med. 1987;5:525–536. doi: 10.1002/mrm.1910050603. [DOI] [PubMed] [Google Scholar]
- 23.Marx L, Chiarelli R, Guiberteau T, Rassat A. J. Chem. Soc. Perkin Trans. 2000;1:1181–1182. [Google Scholar]
- 24.Kirilyuk IA, Bobko AA, Grigor’ev IA, Khramtsov VV. Org. Biomol. Chem. 2004;2(7):1025–1030. doi: 10.1039/b400252k. [DOI] [PubMed] [Google Scholar]
- 25.Okazaki S, Mannan MDM, Sawai K, Masunizu T, Miura Y, Takeshita K. Free Radic. Res. 2007;41:1069–1077. doi: 10.1080/10715760701449302. [DOI] [PubMed] [Google Scholar]
- 26.Kinoshita Y, Yamada K-I, Yamasaki T, Sadasue H, Sakai K, Utsumi H. Free Radic. Res. 2009;43:565–571. doi: 10.1080/10715760902914575. [DOI] [PubMed] [Google Scholar]
- 27.Volodarskii LB, Reznikov VA, Kobrin VS. J. Org. Chem. USSR (Engl. Transl.) 1979;15:364–370. [Google Scholar]
- 28.Zubenko D, Tsentalovich Yu, Lebedeva N, Kirilyuk I, Roshchupkina G, Zhurko I, Reznikov V, Marque SRA, Bagryanskaya E. J. Org. Chem. 2006;71:6044–6052. doi: 10.1021/jo060787x. [DOI] [PubMed] [Google Scholar]
- 29.Sevastjanova TK, Volodarsky LB. Bull. Acad. Sci. USSR Div. Chem. Sci. (Engl. Transl.) 1972;21:2276–2280. [Google Scholar]
- 30.Duling DR. J. Magn. Reson. B. 1994;104:105–110. doi: 10.1006/jmrb.1994.1062. [DOI] [PubMed] [Google Scholar]
- 31.Fuchs MR, Prisner TF, Möbius K. Rev. Sci. Instrum. 1999;70:3681–3683. [Google Scholar]
- 32.Schnegg A, Kirilina E, Fuchs M, Savitsky A, Grishin Y, Dubinskii A, Plato M, Lubitz W, Möbius K. Appl. Magn. Reson. 2007;31:59–98. [Google Scholar]
- 33.Stoll S, Schweiger A. J. Magn. Reson. 2006;178:42–55. doi: 10.1016/j.jmr.2005.08.013. [DOI] [PubMed] [Google Scholar]
- 34.Becke AD. J. Chem. Phys. 1993;98:5648–5654. [Google Scholar]
- 35.Lee C, Yang W, Parr RG. Phys. Rev. B. 1988;37:785–790. doi: 10.1103/physrevb.37.785. [DOI] [PubMed] [Google Scholar]
- 36.Frisch MJ, Trucks GW, Schlegel HB, Scuseria GE, Robb MA, Cheeseman JR, Montgomery JA, Jr, Vreven T, Kudin KN, Burant JC, Millam JM, Iyengar SS, Tomasi J, Barone V, Mennucci B, Cossi M, Scalmani G, Rega N, Petersson GA, Nakatsuji H, Hada M, Ehara M, Toyota K, Fukuda R, Hasegawa J, Ishida M, Nakajima T, Honda Y, Kitao O, Nakai H, Klene M, Li X, Knox JE, Hratchian HP, Cross JB, Adamo C, Jaramillo J, Gomperts R, Stratmann RE, Yazyev O, Austin AJ, Cammi R, Pomelli C, Ochterski JW, Ayala PY, Morokuma K, Voth GA, Salvador P, Dannenberg JJ, Zakrzewski VG, Dapprich S, Daniels AD, Strain MC, Farkas O, Malick DK, Rabuck AD, Raghavachari K, Foresman JB, Ortiz JV, Cui Q, Baboul AG, Clifford S, Cioslowski J, Stefanov BB, Liu G, Liashenko A, Piskorz P, Komaromi I, Martin RL, Fox DJ, Keith T, Al-Laham MA, Peng CY, Nanayakkara A, Challacombe M, Gill PMW, Johnson B, Chen W, Wong MW, Gonzalez C, Pople JA. Gaussian 03 (Revision B.01) Pittsburg PA: Gaussian Inc; 2003. [Google Scholar]
- 37.Tomasi J, Mennucci B, Cammi R. Chem. Rev. 2005;105:2999–3002. doi: 10.1021/cr9904009. [DOI] [PubMed] [Google Scholar]
- 38.Khramtsov VV, Volodarsky LB. In: Spin Labeling: The Next Millenium, Biological Magnetic Resonance. Berliner LJ, editor. vol. 14. New York: Plenum Press; 1998. [Google Scholar]
- 39.Importa R, Barone V. Chem. Rev. 2004;104:1231–1253. doi: 10.1021/cr960085f. [DOI] [PubMed] [Google Scholar]
- 40.Importa R, Scalmani G, Barone V. Chem. Phys. Lett. 2001;336:349–356. [Google Scholar]
- 41.Importa R, Barone V, Bally T, Borden WT. In: Reviews in Computational Chemistry. Lipkowitz KB, Boyd DB, editors. vol. 13. New York: Wiley; 1999. pp. 1–97. [Google Scholar]
- 42.Savitsky A, Dubinskii AA, Plato M, Grishin YA, Zimmermann H, Möbius K. J. Phys. Chem. B. 2008;112:9079–9090. doi: 10.1021/jp711640p. [DOI] [PubMed] [Google Scholar]
- 43.Gullá AF, Budil DE. J. Phys. Chem. B. 2001;105:8056–8062. [Google Scholar]
- 44.Potapenko DI, Foster MA, Lurie DJ, Kirilyuk IA, Hutchison JM, Grigor’ev IA, Bagryanskaya EG, Khramtsov VV. J. Magn. Reson. 2006;182:1–11. doi: 10.1016/j.jmr.2006.06.002. [DOI] [PubMed] [Google Scholar]


