

Abstract
Raised blood pressure (BP) is a major risk factor for cardiovascular disease. Previous studies have identified 47 distinct genetic variants robustly associated with BP, but collectively these explain only a few percent of the heritability for BP phenotypes. To find additional BP loci, we used a bespoke gene-centric array to genotype an independent discovery sample of 25,118 individuals that combined hypertensive case-control and general population samples. We followed up four SNPs associated with BP at our p < 8.56 × 10⁻⁷ study-specific significance threshold and six suggestively associated SNPs in a further 59,349 individuals. We identified and replicated a SNP at LSP1/TNNT3, a SNP at MTHFR-NPPB independent (r2 = 0.33) of previous reports, and replicated SNPs at AGT and ATP2B1 reported previously. An analysis of combined discovery and follow-up data identified SNPs significantly associated with BP at p < 8.56 × 10⁻⁷ at four further loci (NPR3, HFE, NOS3, and SOX6). The high number of discoveries made with modest genotyping effort can be attributed to using a large-scale yet targeted genotyping array and to the development of a weighting scheme that maximized power when meta-analyzing results from samples ascertained with extreme phenotypes, in combination with results from nonascertained or population samples. Chromatin immunoprecipitation and transcript expression data highlight potential gene regulatory mechanisms at the MTHFR and NOS3 loci. These results provide candidates for further study to help dissect mechanisms affecting BP and highlight the utility of studying SNPs and samples that are independent of those studied previously even when the sample size is smaller than that in previous studies.
Introduction
Raised blood pressure (BP) or hypertension [MIM 145500] is estimated by the World Health Organization to contribute 7.1 million deaths annually and is a major risk factor for cardiovascular disease (CVD), mainly coronary heart disease and stroke.1, 2 Globally, in 2008 the prevalence of hypertension (defined as measured blood pressure ≥140mmHg systolic BP [SBP] and/or ≥90 mmHg diastolic BP [DBP]) was ∼40% in adults aged 25 and over.3 Candidate-gene and genome-wide association studies (GWAS) for continuous BP traits in general population samples and for case-control hypertension (HTN), have previously identified 47 distinct genetic variants at 40 loci robustly associated with BP and hypertension,4, 5, 6, 7, 8, 9, 10, 11, 12, 13, 14, 15 but collectively these explain only a few percent of the heritability for BP phenotypes.16 To find additional BP loci, we used an independent discovery sample of 25,118 individuals, combining hypertensive case-control and general population samples. We genotyped our discovery sample at 49,452 SNPs by using the HumanCVD BeadChip (Illumina, San Diego, CA), which is a bespoke gene-centric array providing dense coverage of ∼2,000 genes considered a priori more likely to have functional effects on cardiovascular traits, including BP.17 We tested genotypes at each SNP for association with four continuous BP phenotypes (SBP, DBP, mean arterial pressure [MAP] = 1/3 SBP + 2/3 DBP, and pulse pressure [PP] = SBP − DBP) and also for association with HTN and followed-up top signals in a further 59,349 individuals by using a combination of single SNP targeted genotyping and look-ups in pre-existing GWAS results. The five BP traits are correlated but measure partly distinct physiological features, including cardiac output, vascular resistance, and arterial stiffness,18 and their distinct clinical and epidemiological roles are a subject of current research. Because relatively little is known about the genetic basis of interindividual variation in these traits, or which traits are most powerful for detecting genetic associations, we tested all five traits for association in parallel. We discovered (at our study-specific significance threshold of p < 8.56 × 10⁻⁷) and replicated a SNP at LSP1/TNNT3, a SNP at MTHFR-NPPB independent (r2 = 0.33) of previous reports,4, 6, 11 and replicated SNPs at ATP2B1 and AGT that were reported previously;5, 12 all were associated with at least one phenotype. In an analysis of combined discovery and follow-up data, we found eight genetic associations with BP, at the MTHFR-NPPB, AGT, NPR3, HFE, NOS3, LSP1/TNNT3, SOX6, and ATP2B1 loci, at our study-specific significance threshold of p < 8.56 × 10⁻⁷ for at least one phenotype. To screen for candidate functional mechanisms, we looked for copy-number variant tagging SNPs (CNV-tSNPs), nonsynonymous SNPs (nsSNPs), SNPs in transcription factor binding sites identified by chromatin immunoprecipitation followed by tag sequencing (ChIP-Seq) performed by the ENCODE consortium19, 20, 21, 22, 23, 24, and expressed transcript-level-associated SNPs (eSNPs) in two independent tissue resources (a whole-blood and tissue panel and monocytes). Our results provide candidates for further study to help dissect mechanisms affecting BP and highlight the utility of studying SNPs and samples that are independent of those studied previously, even when the sample size is smaller than that in previous studies.
Material and Methods
Phenotyping, Genotyping, and Quality Control
Written informed consent and approval by local research ethics committees and/or institutional review boards were obtained for all participating studies. Cohort recruitment, sample acquisition, BP and expression-level phenotyping, sample sizes, and demographics are described in detail in Tables S1 and S2, available online. All analyses used data only on individuals of European ancestry. For all of the discovery cohorts (the Allied Irish Bank [AIBIII] study, the Anglo-Scandinavian Cardiac Outcomes Trial [ASCOT], the BRItish Genetics of HyperTension [BRIGHT] study, the British Womens Heart and Health Study [BWHHS], the Genetic Regulation of Arterial Pressure of Humans In the Community [GRAPHIC] cohort, the Malmö Diet and Cancer [MDC] study, controls from the National Blood Service [NBS], the NORdic DILtiazem [NORDIL] trial, the PRecOcious Coronary ARtery DISease [PROCARDIS] study, and the WhiteHall II [WHII] study), we genotyped individuals by using the Illumina HumanCVD BeadChip array (version 1 or version 2) and applied quality control (QC) exclusions and checks as described in Table S3. For analyses that combined hypertensive cases and control samples that had been recruited or processed separately (i.e., AIBIII + ASCOT + NBS, BRIGHT, and MDC + NORDIL), there are potential stratification artifacts that might be induced by differences in sample handling or by DNA extraction or preparation,25 and therefore particularly stringent QC procedures were used (Table S3).
For follow-up of top signals, individual SNPs were genotyped with the KASPAR assay in independent samples from seven cohorts (the British Regional Heart Study [BRHS], the Edinburgh Artery Study [EAS], the English Longitudinal Study of Ageing [ELSA], the HYPertension in ESTonia [HYPEST] study, the study of the INTERplay between GENEtic susceptibility and environmental factors for the risk of chronic diseases [INTERGENE], the Medical Research Council National Survey of Health and Development [MRC NSHD] and the Northwick Park Heart Study [NPHSII]; Table S3). In addition, for two cohorts with GWAS data (HYPERGENES and the Ottawa Heart Genomic Study [OHGS]) and one GWAS meta-analysis consortium (Global BPgen [GBPG]), results were looked up (where available) for SNPs we targeted for follow-up (Table S3).
The whole-blood and tissue panel eSNP data set is derived from a combination of peripheral whole-blood samples and a tissue panel including subcutaneous and visceral adipose tissue, liver, and muscle. The monocyte eSNP data set is derived from monocytes from 395 healthy blood donors and 363 patients with premature myocardial infarction. For both eSNP data sets, we measured transcript levels with whole-genome expression microarrays, and we genotyped samples by using standard GWAS platforms (Tables S2 and S3).
Statistical Analyses
Within-Study Association Analyses
All association analyses assumed a normal linear regression model for continuous phenotypes (DBP, MAP, PP, and SBP) and a logistic regression model for HTN. For BP measurements from individuals on antihypertensive or BP-lowering treatment, off-treatment values were imputed by adding fixed constants of 15 mmHg SBP and 10 mmHg DBP.6, 26
In our analyses, we distinguished between nonascertained studies (defined as those that selected individuals for inclusion without reference to BP phenotypes) and ascertained studies (defined as those that selected or enriched for individuals according to their BP phenotype). Thus nonascertained studies include random population samples and samples from specific demographic groups, and ascertained studies include hypertensive case-control studies and population studies enriched for hypertensive individuals). For the ascertained cohorts, HTN analyses were performed separately with (1) ASCOT versus AIBIII + NBS combined, (2) BRIGHT cases versus controls, (3) NORDIL versus MDC. Continuous BP measures were not available in the NBS cohort and hence continuous trait analyses were performed separately with (1) AIBIII + ASCOT + BRIGHT combined and (2) MDC + NORDIL combined in order to obtain both similar ancestry and balance of high and low BP individuals in each association analyses. Genetic association tests are more powerful when individuals ascertained from both extremes of the phenotype distribution are genotyped, compared with genotyping an equal number of nonascertained (randomly sampled) individuals.27 However, both within-study association analysis, and also meta-analysis combining nonascertained and ascertained samples, require special analytical considerations as described below.
In studies with nonascertained samples, the joint distribution of BP and phenotypic covariates follows a population distribution, and therefore we included sex, age, age2 and body mass index as covariates.6 In studies that combined ascertained samples (from AIBIII, ASCOT, BRIGHT, MDC, NBS, and NORDIL), the various ascertainment schemes mean that the joint distribution of BP and phenotypic covariates is not like a population distribution. For example, in the combined MDC and NORDIL data sets, both SBP and HTN are negatively correlated with age; differential participation in the BRIGHT study was female-biased, but recruitment in the ASCOT study deliberately enriched for males. Therefore we did not use phenotypic covariates in analyses of these samples, because to do so would have biased the resulting effect-size estimates.
Asymptotic approximations that rely on large sample size and minor allele frequency (MAF) not close to zero were used to estimate standard errors for within-study association analyses. An a priori decision was made not to use HTN analyses for SNPs with MAF < 0.01. For all analyses, the goodness of asymptotic approximations was checked empirically by examining quantile-quantile plots of the association test statistics after preliminary exclusions (Figures S1–S5). For all quantitative trait analyses, there was a clear departure from the expected uniform distribution of p values for SNPs with MAF < 0.01 for the two cohorts with related individuals (GRAPHIC and PROCARDIS), and these SNPs were therefore excluded for these studies. There was no departure from the expected distribution of p values for ascertained studies despite their nonnormal continuous trait distributions.
We verified independence across studies for our discovery analysis by computing robust estimates of the pairwise interstudy test statistic correlations. For each pairwise study comparison and for each trait in turn, we calculated the Spearman correlation between association test statistics, by using 12,025 SNPs for continuous traits and 11,832 SNPs for HTN, obtained by pruning SNPs in strong linkage disequilibrium (LD) with other SNPs and excluding SNPs where study results failed QC. The maximum correlation (for all pairs and all phenotypes) was ρ = 0.038 (for AIBIII + ASCOT + BRIGHT versus BWHHS for MAP). Although formally statistically significant (p = 3.2 × 10⁻⁵) after adjusting for the number of phenotypes and number of pairwise cohort comparisons, we do not regard this as indicative of substantial cryptic sample overlap or double counting because (1) the absolute value of the correlation is very low, (2) residual LD exists within the pruned set of SNPs used to calculate these correlations, and (3) the correlation we calculated cannot be made completely robust to inflation because of truly associated SNPs.
Discovery Meta-Analysis Weighting Scheme
For each continuous trait in turn (DBP, MAP, PP, SBP) and for each single SNP, we meta-analyzed the effect-size estimates and standard errors obtained from within-study association analyses. We developed a meta-analysis approach intended to maximize power in our specific application, namely when combining results from a mixture of nonascertained studies (BWHHS, GRAPHIC, PROCARDIS, and WHII) and studies ascertained on the basis of the phenotypes that are the subject of the association analysis (from AIBIII, ASCOT, BRIGHT, MDC, NORDIL). Our approach is motivated by the observation that effect-size estimates from ascertained studies tend to be inflated, relative to effect-size estimates that would be obtained from a nonascertained population, but also that, for any given sample size, standard errors for ascertained studies are inflated relative to those for nonascertained studies (Figure S6).28 These larger standard errors mean that if a standard inverse-variance weighting scheme was used, information from ascertained studies would be inappropriately downweighted. To avoid this problem, for each ascertained study we estimated an inflation correction factor (Table S4), which rescales the effect-size estimates and standard errors, to obtain estimates of the corresponding effect sizes in the populations from which these studies were ascertained. After rescaling, all studies (ascertained and nonascertained) are unbiasedly estimating equivalent population parameters, and inverse-variance weighting of the rescaled effect-size estimates is therefore asymptotically most powerful. Intuitively, the effect of rescaling standard errors for ascertained studies means that those studies then have increased weights in the meta-analysis of rescaled effect-size estimates.
For HTN, for each single SNP we meta-analyzed the effect-size estimates across studies by using inverse-variance weighting.
Multiple Testing Correction
We estimated the significance threshold that would provide a 5% overall false-positive rate control (strictly, a 5% family-wise error rate [FWER]) when five correlated phenotypes (DBP, SBP, MAP, PP, and HTN) are tested for association with genotypes at the ∼50,000 correlated SNPs on the HumanCVD BeadChip with the spectral methods of Nyholt29 and Li and Ji.30 The high correlations between the five phenotypes imply only Meff = 2.7577 effective tests (Table S5), and the correlations between the ∼40,000 polymorphic SNPs imply Meff = 21,180 effective tests (Table S6). Hence, analyzing five phenotypes at ∼40,000 polymorphic SNPs corresponds to a total of Meff = 58,409 effective tests, and we therefore used a significance threshold of p < 0.05/(58,409) = 8.56 × 10⁻⁷ for our discovery analysis.
Follow-Up Analysis
We selected ten independent SNPs at ten distinct loci for follow-up on the basis of results from our discovery analysis; four SNPs with p < 8.56 × 10⁻⁷ and six SNPs with suggestive association (p < 1/58,409 = 1.71 × 10⁻⁵). Where there was no previous or concurrent report of association with BP phenotypes (at the NOS3, LSP1/TNNT3, SOX6, NUCB2/KCNJ11/ABCC8, and CACNA1C loci), we followed up the most significant SNP at each locus by using a combination of direct genotyping in independent samples and look-ups in results from several GWAS data sets. (We subsequently became aware of a concurrent discovery of the association at the NOS3 locus.) For the other five loci (MTHFR-NPPB, AGT, NPR3, HFE and ATP2B1), association with BP phenotypes had been reported previously4, 5, 6, 7, 11, 12, 31 or were being validated with direct genotyping in a concurrent work.14 For these loci we performed look-ups in results from previously published meta-analysis (GBPG,6 n = 33,638, except for AGT where results from GBPG, Cohorts for Heart and Aging Research in Genomic Epidemiology [CHARGE] and Women's Genome Health Study [WGHS], n = 86,588 were previously published12). We tested each SNP with a single one-tailed test by using the direction of effect and phenotype with the smallest p value observed in our discovery meta-analysis. Using a Bonferroni correction for ten independent tests, we declared successful replication for SNPs with one-tailed p < 0.05/10 = 0.005. For analysis of combined discovery and replication data, we used a p < 8.56 × 10⁻⁷ threshold as for our discovery analysis because testing the ten SNPs in combined analysis is slightly conservative compared to analyzing all SNPs for association in the full discovery plus follow-up sample size.32, 33
Low-Frequency Variant Analyses
For our study, low-frequency variants were defined as SNPs with 0 < MAF ≤ 0.05 and passing our other QC thresholds used for meta-analysis (Table S3). To test association with individual low-frequency SNPs, we simply used our meta-analysis results calculated as described in Within-Study Association Analyses and Discovery Meta-Analysis Weighting Scheme and classified according to the observed MAF by using the weighted average across cohorts.
We tested for associations between BP phenotypes and the total dose of low-frequency alleles, counting alleles at all low-frequency SNPs within 50 kb of any known transcript for each gene. We included in our analyses all genes with ≥20 low-frequency variants, plus genes near a common variant association discovered here or previously and genes where rare variant associations were reported previously.34 We tested the association between the phenotype and total dose (count) of low-frequency alleles separately for each of our five BP phenotypes by using normal linear and logistic regression models with ten ancestry PCs as covariates and then meta-analyzed by using inverse-variance weighting to combine results from the UK and Irish ancestry samples and the Nordic ancestry samples.
Identification of Credibly Causal SNPs
We used LD observed in samples resequenced for the 1000 Genomes Project (1000G),35 annotation of encoded protein sequence changes in known transcripts, and data on transcription factor binding site (TFBS) peak regions identified by chromatin immunoprecipitation followed by tag sequencing (ChIP-Seq) performed by the ENCODE consortium19, 20, 21, 22, 23, 24 to determine whether there were candidate functional SNPs that could potentially be causally responsible for the observed genotype-phenotype associations.
Because pairwise LD measures do not directly convey information about relative strength of association, for candidate functional SNPs included in our association meta-analysis, we conducted a model selection analysis. This analysis is motivated by the knowledge that, even if the true causal variant is a genotyped SNP, a different SNP in LD might have a more significant association and a smaller p value simply by chance. The model selection analysis does not address the question of whether a causal relationship exists. Rather, assuming that a sole causal genetic variant exists at each locus, the analysis discriminates between a set of mutually exclusive hypotheses about which genetic variant is the causal one and measures the relative support for each with the aim of eliminating SNPs that could not credibly be the sole causal variant at each locus.
Our model selection analysis is different in purpose to conditional analyses, which ask whether two or more SNPs might jointly be responsible for the observed genotype-phenotype association. Because the models being compared are not nested, classical model selection criteria such as the likelihood ratio test are not appropriate. We use a Bayesian model selection criterion, the Bayes Factor (BF) relative to the SNP with the highest marginal likelihood at each locus.36 SNPs with BF < 0.05 are not credible candidates for being the sole causal variant at a locus, and we use the specific term “credibly causal” to describe SNPs that are not eliminated by this criterion. This elimination is conservative: Because marginal likelihoods cannot be calculated for SNPs not included in our association meta-analysis, BFs are not calculated for all SNPs, and the BFs that are calculated are upper bounds.
eSNP Analysis and Determination of Coincident Signals
We performed cis-eSNP analyses for loci with SNPs significantly associated with BP in our analysis of combined discovery and replication data. For each locus, we used an index SNP that was most significantly associated with BP or a r2 ≥ 0.9 proxy when that SNP was not available in the eSNP data set. At each locus, transcript levels for all genes 500 kb on either side of the index SNP were tested for association with the index SNP genotype in both eSNP data sets (Table S3). Transcript levels significantly associated with the index SNP might be mediators of the effect on BP but might also be artifacts of much stronger transcript associations at genetic variants that are in only weak LD with an index SNP. We follow Voight et al.37 and use the term “coincident” when the data are consistent with the same genetic variant being responsible for the BP association and transcript association signals (and hence the transcript being a plausible mediator). For each significantly associated transcript, we identified the top eSNP (the SNP with the most significant cis association for the transcript) and performed conditional analyses when the index SNP and the top eSNP were not the same. For the index SNP at SOX6, we also performed a trans-eQTL analysis because functional annotation of SOX6 suggests its product might regulate the expression of other genes.
Results
For our discovery analysis, we successfully genotyped 25,118 individuals, and 38,069 SNPs passed QC in our meta-analysis. All five traits analyzed (SBP, DBP, MAP, PP, and HTN) showed an excess of significant associations at SNPs with MAF > 5% (Figure 1 and Figures S7 and S8). In our discovery analyses, four distinct loci (MTHFR-NPPB, AGT, LSP1/TNNT3, and ATP2B1) had significant associations at our study-specific significance threshold of p < 8.56 × 10⁻⁷ (Table 1, Table S7, and Figure S8). We targeted our top ten distinct and independent association signals for follow-up analysis in a further 59,349 individuals, and eight of these signals had one-tailed p < 0.05/10 = 0.005 with directions of effect concordant with the discovery analysis (Table 1, Figure 2, and Table S8). In an analysis of discovery and follow-up data combined, the eight SNPs (at the MTHFR-NPPB, AGT, NPR3, HFE, NOS3, LSP1/TNNT3, SOX6, and ATP2B1 loci) were all associated with more than one BP trait at our study-specific significance threshold of p < 8.56 × 10⁻⁷ (Figure 3, Figure S9, and Table S9). PP and MAP are not simply correlated with SBP and DBP but are calculated as linear functions of SBP and DBP, and therefore for these four continuous BP traits there are only two underlying phenotypic degrees of freedom. Hence, all truely associated SNPs must be truely associated with at least three (and probably all four) of these BP traits, and which particular traits were significantly associated at any given significance threshold conveys little biologically relevant information beyond that conveyed by continuous measures of effect size (Figure 3).
Figure 1.
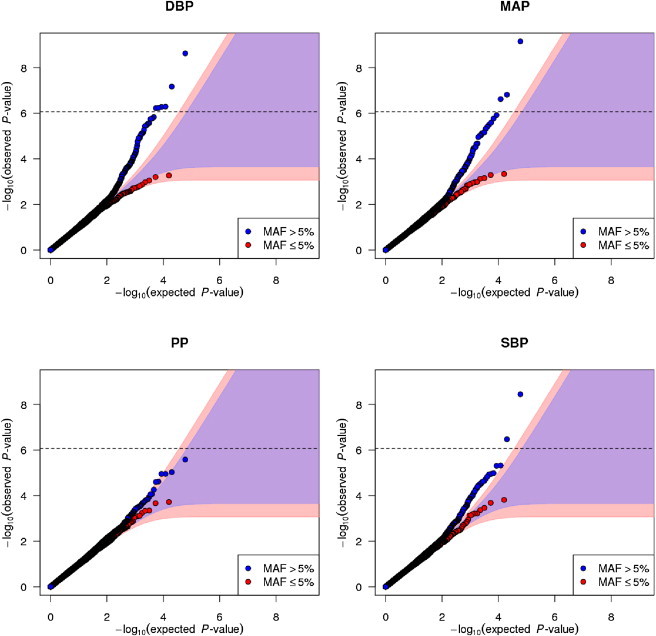
Quantile-Quantile Plots of Meta-Analysis Results
Each panel shows common (MAF > 5% shown in blue) and low-frequency (MAF ≤ 5% shown in red) SNPs separately. Shaded regions are 99% probability envelopes for no association, which depend on the number of SNPs and hence are different sizes for common and low-frequency SNPs. The horizontal dashed line indicates our overall study-specific significance threshold p < 8.56 × 10⁻⁷.
Table 1.
Results for the Ten Association Signals Targeted for Follow-Up Analysis
| Locusa | Index SNP, Position on NCBI Build 36 Coordinates |
Discovery Data |
Follow-Up Data |
Combined Discovery and Follow-Up Data p Valueb | |||
|---|---|---|---|---|---|---|---|
| Coded and Noncoded Alleles, Frequencies | Beta (SE) per Coded Allele, p Valueb | Phenotype | Coded and Noncoded Alleles and Frequencies | Beta (SE) per Coded Allele, One-Tailed p Valuec | |||
| SNPs Followed Up with Direct Genotyping and Look-ups | |||||||
| NOS3 | rs3918226, chr7:150,321,109 | T/C 0.08/0.92 | +0.83 (0.18), p = 2.9 × 10⁻⁶+ | DBP | T/C 0.09/0.91 | +0.78 (0.21), p = 9.5 × 10⁻⁵∗∗∗ | p = 2.2 × 10⁻⁹∗∗∗ |
| LSP1/TNNT3 | rs661348, chr11:1,861,868 | T/C 0.57/0.43 | −0.65 (0.11), p = 7.0 × 10⁻¹⁰∗∗∗ | MAP | T/C 0.55/0.45 | −0.31 (0.09), p = 2.0 × 10⁻⁴∗∗ | p = 3.0 × 10⁻¹¹∗∗∗ |
| SOX6 | rs2014408, chr11:16,321,858 | T/C 0.21/0.79 | +0.58 (0.13), p = 9.4 × 10⁻⁶+ | MAP | T/C 0.19/0.81 | +0.30 (0.10), p = 1.2 × 10⁻³∗ | p = 3.5 × 10⁻⁷∗ |
| NUCB2/KCNJ11/ABCC8 | rs2074311, chr11:17,378,436 | G/A 0.58/0.42 | −0.45 (0.10), p = 2.6 × 10⁻⁶+ | PP | G/A 0.58/0.42 | −0.10 (0.07), p = 7.6 × 10⁻² NS | p = 6.3 × 10⁻⁵ NS |
| CACNA1C | rs3819526, chr12:2,306,783 | T/C 0.61/0.39 | +0.47 (0.10), p = 1.8 × 10⁻⁶+ | DBP | T/C 0.61/0.39 | +0.10 (0.07), p = 6.9 × 10⁻² NS | p = 7.5 × 10⁻⁵ NS |
| SNPs Followed Up with Look-up in GBPG Results Only | |||||||
| MTHFR-NPPB4, 6, 11 | rs4846049, chr1:11,772,952 | T/G 0.33/0.67 | −0.55 (0.10), p = 6.7 × 10⁻⁸∗∗ | DBP | T/G 0.31/0.69 | −0.34 (0.09), p = 1.5 × 10⁻⁴∗∗ | p = 3.0 × 10⁻¹⁰∗∗∗ |
| AGT12 | rs2004776, chr1:228,915,325 | T/C 0.24/0.76 | +0.14 (0.02), p = 4.3 × 10⁻⁹∗∗∗ | HTN | T/C 0.23/0.77 | 0.08 (0.02)d, p = 1.9 × 10⁻⁷∗∗∗d | p = 6.7 × 10⁻¹⁴∗∗∗d |
| NPR313, 38 | rs1421811, chr5:32,750,027 | G/C 0.39/0.61 | −0.67 (0.15), p = 4.8 × 10⁻⁶+ | SBP | G/C 0.37/0.63 | −0.37 (0.14), p = 3.5 × 10⁻³∗ | p = 3.4 × 10⁻⁷∗ |
| HFE14 | rs1799945, chr6:26,199,158 | G/C 0.15/0.85 | +0.62 (0.14), p = 7.6 × 10⁻⁶+ | DBP | G/C 0.14/0.86 | +0.50 (0.12), p = 2.6 × 10⁻⁵∗∗∗ | p = 2.0 × 10⁻⁹∗∗∗ |
| ATP2B15 | rs11105354, chr12:88,550,654 | G/A 0.16/0.84 | −0.15 (0.03), p = 2.4 × 10⁻⁸∗∗ | HTN | G/A 0.15/0.85 | −0.12 (0.04), p = 4.5 × 10⁻⁴∗∗ | p = 1.1 × 10⁻¹⁰∗∗∗ |
The following symbols are used: NS, Not significant at 0.05 level after multiple testing correction; +, suggestive after multiple testing correction (p < 1/58,409 = 1.71 × 10⁻⁵); ∗, Significant at 0.05 level after multiple testing correction; ∗∗, Significant at 0.01 level after multiple testing correction; ∗∗∗, Significant at 0.001 level after multiple testing correction.
Loci are named according to nearby gene or genes that are strongest functional candidates, based on the position of the index SNP, of correlated nsSNPs, eSNPs, and ChIP-Seq analyses. Numerical superscripts indicate literature citations for previous reports of genetic associations at these loci where known.
Adjustment for 58,409 effective tests required.
Adjustment for ten tests required.
Including results from Johnson et al.12
Figure 2.

Regional Association Plots for Eight SNPs that Were p < 8.56 × 10⁻⁷ for at Least One Phenotype in an Analysis of Combined Discovery and Follow-Up Data
The top of each plot shows local pairwise LD patterns (r2 = 0 in white; r2 = 1 in red) and a fine-scale recombination rate map (cyan lines). The center of each plot shows association results from the discovery analysis only (to maintain an equal sample size for all points) for the five phenotypes analyzed (DBP in blue, MAP in magenta, PP in green, SBP in red, and HTN in yellow). The bottom of each plot shows positions of transcripts of known genes.
Figure 3.
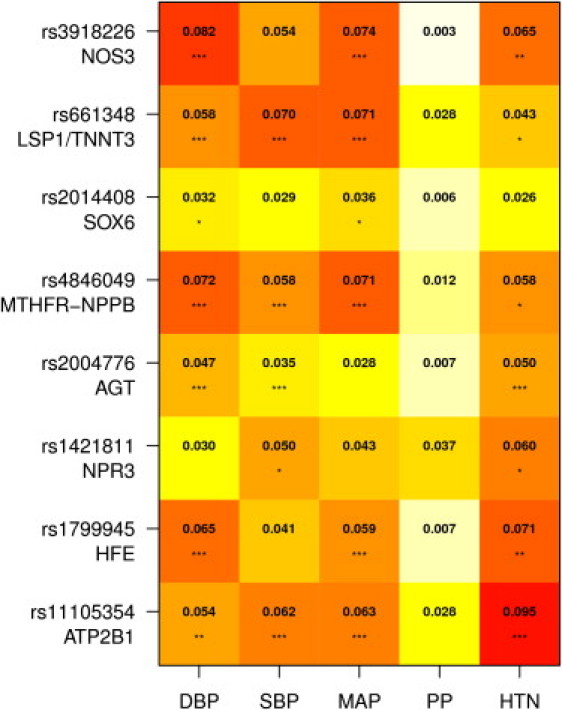
Heat Plot Showing Percentage of Phenotypic Variance Explained in All Available Data for the Eight SNPs
Numeric values are percentage R2 for continuous traits (DBP, SBP, MAP, PP) and Cox and Snell pseudo-R2 for HTN. Each SNP explains less than 0.1% of phenotypic variance. Stars indicate significance levels adjusting for Meff = 58409 tests: ∗p ≤ 0.05/58,409, ∗∗p ≤ 0.01/58,409, ∗∗∗p ≤ 0.001/58,409.
Though not providing genome-wide coverage, the HumanCVD BeadChip specifically targets low-frequency SNPs17 and so might have an advantage over standard GWAS platforms to detect association with low-frequency variants (Figure S10). However, despite our substantial discovery sample size, we observed no significant association with either individual low-frequency SNPs (MAF ≤ 5%) across the whole array (Figure 1 and Figure S7) or with the total dose of low-frequency alleles in the 93 genes with the most dense coverage of low-frequency SNPs (Table S10). We also checked whether CNV-tSNPs were correlated with our association signals because CNVs are strong candidate functional alleles, but none of the credibly causal SNPs at the eight BP loci were found to be CNV-tSNPs (Table S11).
Several SNPs associated with BP previously are genotyped or tagged by the HumanCVD BeadChip (Table S12). In our data, we confirmed (at p < 0.05) associations for all SNPs previously robustly associated with BP in samples of European ancestry.4, 6, 7, 9, 12, 14, 15
At the LSP1/TNNT3 locus containing genes for leukocyte-specific protein 1 (LSP1 [MIM 145500]) and troponin T type 3 (TNNT3 [MIM 600692]), the most significantly associated SNP was rs661348 in intron 6 of LSP1 in an ∼170 kb LD block (Figure 2). We directly genotyped a nsSNP (rs621679, LSP1 [p.Ala38Thr (c.112G>A), p.Ala100Thr (c.298G>A)]) that was not on the HumanCVD BeadChip and is not in HapMap (CEU [Utah residents with Northern and Western European ancestry from the CEPH collection] release 22), which we identified by using phased haplotypes from 1000G as being in moderate LD with rs661348 (r2 = 0.57; Table S13). Although this nsSNP alone can explain the observed association and is a candidate on a priori functional grounds, the statistical evidence for association was equivocal between rs621679 and rs661348 (Table S14). At a second locus, SOX6, the most significantly associated SNP was rs2014408 in intron 3 of the transcription factor SRY-Box6 (SOX6 [MIM 607257]) in an ∼160 kb LD block (Figure 2). This SNP is independent of a BP-associated SNP (rs381815, r2 = 0.026) reported previously,7 which is located 537 kb away at the PLEKHA7 locus (Figure S11). The genes at both the LSP1/TNNT3 and SOX6 loci have no reported connections with BP. At the SOX6 locus, two SNPs in high LD with rs2014408 (r2 = 0.96 with rs1155685 and r2 = 0.87 with rs1701502) might lie within regions bound by transcription factors (Tables S13 and S15). If future functional studies can definitively identify the causal mechanisms underlying the associations at LSP1/TNNT3 and SOX6 loci, this promises insights into the basic biology of BP determination.
We also found significant associations at the AGT and NOS3 loci, consistent with recent reports for AGT.12, 31 At these loci, angiotensinogen (AGT [MIM 106150]) and nitric oxide synthase 3 (NOS3 [MIM 163729]) encode products with known functional effects on BP (Table 2). At the AGT locus, we observed multiple SNPs in weak and modest pairwise LD at our study-specific significance threshold of p < 8.56 × 10⁻⁷. However, association analyses conditioning on the most significantly associated SNP (rs2004776) revealed no significant secondary signals (Figure S12), consistent with a previous observation that no multi-SNP haplotype is more significant than this single SNP.31 In AGT the nsSNP rs699 (p.Met268Thr [c.803T>C], previously known as p.Met235Thr) is in moderate LD with rs2004776 (r2 = 0.56) and cannot credibly be excluded as responsible for the observed association signal in our data (Table S13). Several other credibly causal SNPs are located in overlapping peak binding regions for multiple transcription factors (Tables S13 and S15), suggesting regulation of AGT as an alternative candidate mechanism. At the NOS3 locus, the most significantly associated SNP is rs3918226, which is not genotyped on most standard GWAS arrays, and is not in HapMap CEU r22, and hence this association could not have been discovered by previous GWAS meta-analyses. This SNP is located within a region with striking enrichment for binding by the transcription factor sine oculis homeobox, Drosophila, homolog of 5 (SIX5 [MIM 600963]; Tables S13 and S15 and Figure S13), which is upstream of the first coding exon of all common NOS3 transcripts, suggesting regulation of NOS3 as a candidate functional mechanism.
Table 2.
Literature and Functional Annotation for Key Genes at each BP-Associated Locus
| Gene | Function and References |
|---|---|
| LSP1 | LSP1 encodes leukocyte-specific protein 1, an intracellular F-actin binding protein, primarily expressed in leukocytes and endothelial cells. Studies of lsp1 knockout mice and other work indicate LSP1 plays a role in signaling, regulating the cytoskeletal architecture and neutrophil migration.42, 43 Recent GWAS meta-analyses have reported polymorphisms in LSP1 to be associated with ulcerative colitis44 and breast cancer.45 |
| TNNT3 | TNNT3 encodes the fast skeletal troponin T protein, also known as Troponin T type 3. Calcium binding to the troponin complex initiates the process of muscle contraction.46 Mutations in TNNT3 have been found in patients with distal arthrogryposis multiplex congenita type 2B (DA2B).47 |
| SOX6 | SOX6 encodes a transcription factor, which is defined by a conserved high-mobility group DNA binding domain. It is required for normal development of the central nervous system, chondrogenesis, and maintenance of cardiac and skeletal muscle cells.48 Recent genome-wide association studies show association of polymorphisms in SOX6 with bone mineral density.49 |
| AGT | AGT encodes angiotensinogen, which is a member of the renin-angiotensin-aldosterone system (RAAS). Its cleaved products angiotensin I, angiotensin II and angiotensin III are known regulators of BP and sodium homeostasis.50 There are numerous reports of association of genetic polymorphisms at the AGT locus associated with hypertension.12, 31, 51, 52 |
| NOS3 | NOS3 encodes endothelial nitric oxide synthase, an enzyme that generates nitric oxide (NO). NO plays an important role in the maintenance of cardiovascular and renal homeostasis.53 Studies of NOS3 knockout mice show heterozygous and homozygous mice to have increased BP (4 mmHg in +/− mice and 18 mmHg in −/− mice) compared to wild type.54 |
| NPR3 | NPR3 encodes the natriuretic peptide clearance receptor. The protein acts as a clearance receptor for circulating natriuretic peptides A, B and C, and also elicits a number of vascular, renal, and endocrine effects directly via its coupling to an inhibitory heterotrimeric G protein, Gi.55NPR3 knockout mice show reduced clearance of circulating natriuretic peptides and have lower BP.56 Other polymorphisms in this gene have recently been reported to be associated with height57 and BP.13, 14, 38 |
| HFE | HFE encodes the hemochromatosis protein, a membrane bound protein involved in regulating iron absorption. The p.His63Asp (the BP-associated variant) and p.Cys282Tyr nsSNPs in this gene cause the classical autosomal form of hemochromatosis.58 The p.His63Asp variant has recently been reported to be associated with BP in an independent discovery data set.14 |
| HIST1H2BK | HIST1H2BK encodes histone H2B type 1-K. This protein forms a structural part of the nucleosome and functions as a regulator of chromatin organization and stability.59 |
| HIST1H2AA | HIST1H2AA encodes histone H2A type 1-A. This protein forms a structural part of the nucleosome and functions as a regulator of chromatin organization and stability.59 |
| ATP2B1 | ATP2B1 encodes a calcium ATPase, isoform 1, which is a membrane bound protein involved in intracellular calcium homeostasis.60 Polymorphisms in this gene have previously been associated with hypertension.5 The polymorphism associated with BP has recently been shown to be associated with serum magnesium levels.61 |
| MTHFR | MTHFR encodes methylenetetrahydrofolate reductase, an enzyme involved in homocysteine metabolism.62 Polymorphisms in this gene have been reported to be associated with many traits including BP and hypertension.6, 8, 11, 63 |
| CLCN6 | CLCN6 encodes chloride transport protein 6, a member of the CLC protein family of Cl- channels and transporters.64 Recent data indicate CLCN6 functions as anion-proton antiporter, and suggest it might have a dual role in vesicular acidification and chloride accumulation.65 |
At the NPR3 and HFE loci, our findings are partly coincident with those of large GWAS meta-analyses reported elsewhere. In our data, the most significantly associated SNP at the NPR3 locus is rs1421811, located in intron 1 of the natriuretic peptide receptor C (NPR3 [MIM 108692]). This SNP is in weak LD with two SNPs reported elsewhere13, 14 (r2 = 0.19 with rs1173771 and r2 = 0.17 with rs1173766). These two SNPs are located 101 kb and 91 kb away from rs1421811, are highly correlated with each other (r2 = 0.84), and show less significant associations in our data (Table S12). All of these SNPs are in very weak LD (r2 < 0.01) with the SNP rs7726475 reported recently by Zhu et al.38 Thus, our data probably identify an independent variant at the NPR3 locus affecting BP. At the HFE locus, our most significantly associated SNP is rs1799945, which is the same nsSNP (p.His63Asp [c.187C>G]) in the hemochromatosis gene (HFE [MIM 613609]) reported elsewhere.14 In our data this SNP is an eSNP, associated with HIST1H2BK transcript levels in monocytes (p = 8.5 × 10⁻⁵) and HIST1H2AA transcript levels in the whole-blood and tissue panel (p = 2.9 × 10⁻⁴; Table S16). We observed no association between the p.His63Asp nsSNP and HFE expression levels in monocytes or in the whole-blood and tissue panel (Table S16). Several other SNPs in strong LD with HFE p.His63Asp might lie within regions bound by multiple transcription factors (Tables S13 and S15), further supporting the possibility of a regulatory mechanism at this locus.
Our analyses also identified significant associations at two previously reported BP loci, ATP2B1 and MTHFR-NPPB. At the ATP2B1 locus, our most significantly associated SNP is rs11105354, which is perfectly correlated with previously reported SNPs (Table 2 and Table S12).5, 7 At the MTHFR-NPPB locus, the most significantly associated SNP in our data is rs4846049 in the 3′ UTR of 5-10-methylenetetrahydrofolate reductase (MTHFR [MIM 607093]). We also observed highly significant associations at two nearby previously reported SNPs4, 6 that are in weak and moderate pairwise LD with rs4846049 (r2 = 0.08 with rs5068 and r2 = 0.33 with rs17367504), and therefore we analyzed association with the three SNPs simultaneously. Each individual SNP was not significantly associated when added to a multivariate regression model that included the other two SNPs (Table S17), and it therefore appears that any two of these three SNPs are sufficient to jointly tag the causal variant or variants, which remain to be definitively identified. We identified a credibly causal nsSNP rs1801131 (MTHFR p.Glu429Ala [c.1286A>C]) in high LD with rs4846049 (r2 = 0.9). rs4846049 is also an eSNP, associated with MTHFR (p = 1.91 × 10−82) and CLCN6 (p = 1.6 × 10⁻⁸) transcript levels in the whole-blood and tissue panel and MTHFR transcript levels in monocytes (p = 3.1 × 10−36 for rs1801131, an r2 = 0.94 proxy; Table S16). A gene regulatory mechanism is further supported by the observation that rs4846049, and also the slightly less significantly associated but still credibly causal SNP rs3818762, lie within a region with striking enrichment for binding by the signal transducer and activator of transcription 1 (STAT1 [MIM 600555]; Tables S13 and S15 and Figure S13). Our results and previous studies indicate the MTHFR-NPPB locus contains multiple nonindependent SNPs associated with BP, suggesting potentially several causal variants and several potential functional mechanisms. Our results highlight the MTHFR p.Glu429Ala nsSNP as one plausible mechanism and regulation of MTHFR and/or CLCN6 as another.
Discussion
In the context of GWAS meta-analyses with larger discovery samples sizes and substantially greater discovery genotyping effort (n = 34,433 and ∼19 billion SNPs genotyped;6 n = 29,136 and ∼18 billion SNPs genotyped;7 and n = 69,395 and ∼39 billion SNPs genotyped14) than our discovery sample (n = 25,118 and ∼1.3 billion SNPs genotyped), it might at first seem surprising that our study identified BP loci that were not discovered by these GWAS meta-analyses. However, there was likewise only modest overlap of the loci that had sufficiently strong statistical evidence to be claimed as “discovered” by the two previous GWAS meta-analysis studies with nonoverlapping samples.16 Similar to other complex disease phenotypes,39 this observation is consistent with the hypothesis that the complete genetic architecture of BP involves a very large number of genetic variants and that current GWAS or large-scale candidate-gene studies will discover more-or-less random subsets of this architecture because their power to detect such variants is low. Our study can be viewed as an explicit test of a corollary of this hypothesis, that discovery analyses with samples independent of those studied previously will identify BP loci that have, simply by chance, evaded detection in previous GWAS with similar or larger sample sizes.
Protein sequence changes encoded by nsSNPs were specifically targeted in the HumanCVD BeadChip design because they are strong a priori functional candidates, and SNPs in transcription factor binding sites can exert functional effects by modulating transcription factor binding.40, 41 We tested whether such SNPs could be causally responsible for the observed association signals, explicitly taking into account the likelihood of a noncausal SNP having by chance a smaller p value. Our results are based on a rigorous analysis and explicit assumptions about the distribution of the effect sizes (Table S13). The relationship between our results and those obtained by more ad hoc approaches (Figures S14 and S15) suggests that the widespread practice of looking only at functional annotation of SNPs in strong LD (e.g., r2 ≥ 0.8) with index SNPs is not theoretically well grounded and that previous GWAS might have overlooked some potential causal mechanisms.
Our discovery and follow-up analyses identified eight independent genetic variants associated with BP. We attribute the high (80%) success rate to three factors. First, use of the HumanCVD BeadChip for our discovery analysis meant that, compared to standard GWAS approaches, each SNP had higher a priori chances of being truly associated with BP and also that a less stringent p value threshold could be used to select SNPs for follow-up because of the lower multiple testing burden. Second, our discovery analysis tested five blood pressure phenotypes in parallel, and we avoided a reduction in power by testing only the most significantly associated phenotype in our follow-up analysis. Third, we combined data from population cohorts and hypertensive case-control cohorts that were sampled from the extremes of the continuous phenotype distribution and used a specially developed meta-analysis weighting scheme that gives appropriately large weights to the more extreme case-control cohorts that are expected to yield the greatest information.
Acknowledgments
Author and cohort acknowledgements and author contributions are cited in the Supplemental Data. The following authors declare the following potential conflicts of interest: F.N. is a full-time employee at AstraZeneca. J.W. is a full-time employee at GlaxoSmithKline. N.R.P. has received financial support and consultancy fees from several pharmaceutical companies that manufacture either blood-pressure-lowering or lipid-lowering agents or both. P.S. has received research awards from Pfizer.
Published online: November 17, 2011
Footnotes
Supplemental Data include 15 figures and 17 tables and can be found with this article online at http://www.cell.com/AJHG/.
Contributor Information
Toby Johnson, Email: t.johnson@qmul.ac.uk.
Patricia B. Munroe, Email: p.b.munroe@qmul.ac.uk.
Web Resources
The URLs for data presented herein are as follows:
1000 Genomes (1000G) Project, http://www.1000genomes.org
ENCODE Project ChIP-Seq Raw Signal Data and TFBS Peak Regions, http://genome.ucsc.edu/cgi-bin/hgTables
International HapMap Project, http://hapmap.ncbi.nlm.nih.gov
KASPAR Genotyping Systems, http://www.kbioscience.co.uk/reagents/KASP.html
National Human Genome Resource Institute Catalog of Published GWAS, http://www.genome.gov/gwastudies
Online Mendelian Inheritance in Man (OMIM), http://www.omim.org/
Supplemental Data
References
- 1.World Health Organisation. Chapter One. Chronic diseases: Causes and health impact. Part two. The urgent need for action. In Chronic diseases and health promotion. http://www.who.int/chp/chronic_disease_report/part2_ch1/en/index15.html.
- 2.World Health Organisation. Raised Blood Pressure, situation and trends. In Global Health Observatory (GHO). http://www.who.int/gho/ncd/risk_factors/blood_pressure_prevalence_text/en/index.html.
- 3.Guidelines Subcommittee 1999 World Health Organization-International Society of Hypertension Guidelines for the Management of Hypertension. J. Hypertens. 1999;17:151–183. [PubMed] [Google Scholar]
- 4.Newton-Cheh C., Larson M.G., Vasan R.S., Levy D., Bloch K.D., Surti A., Guiducci C., Kathiresan S., Benjamin E.J., Struck J., et al. Association of common variants in NPPA and NPPB with circulating natriuretic peptides and blood pressure. Nat. Genet. 2009;41:348–353. doi: 10.1038/ng.328. [DOI] [PMC free article] [PubMed] [Google Scholar]
- 5.Cho Y.S., Go M.J., Kim Y.J., Heo J.Y., Oh J.H., Ban H.J., Yoon D., Lee M.H., Kim D.J., Park M., et al. A large-scale genome-wide association study of Asian populations uncovers genetic factors influencing eight quantitative traits. Nat. Genet. 2009;41:527–534. doi: 10.1038/ng.357. [DOI] [PubMed] [Google Scholar]
- 6.Newton-Cheh C., Johnson T., Gateva V., Tobin M.D., Bochud M., Coin L., Najjar S.S., Zhao J.H., Heath S.C., Eyheramendy S., et al. Wellcome Trust Case Control Consortium Genome-wide association study identifies eight loci associated with blood pressure. Nat. Genet. 2009;41:666–676. doi: 10.1038/ng.361. [DOI] [PMC free article] [PubMed] [Google Scholar]
- 7.Levy D., Ehret G.B., Rice K., Verwoert G.C., Launer L.J., Dehghan A., Glazer N.L., Morrison A.C., Johnson A.D., Aspelund T., et al. Genome-wide association study of blood pressure and hypertension. Nat. Genet. 2009;41:677–687. doi: 10.1038/ng.384. [DOI] [PMC free article] [PubMed] [Google Scholar]
- 8.Takeuchi F., Isono M., Katsuya T., Yamamoto K., Yokota M., Sugiyama T., Nabika T., Fujioka A., Ohnaka K., Asano H., et al. Blood pressure and hypertension are associated with 7 loci in the Japanese population. Circulation. 2010;121:2302–2309. doi: 10.1161/CIRCULATIONAHA.109.904664. [DOI] [PubMed] [Google Scholar]
- 9.Padmanabhan S., Melander O., Johnson T., Di Blasio A.M., Lee W.K., Gentilini D., Hastie C.E., Menni C., Monti M.C., Delles C., et al. Global BPgen Consortium Genome-wide association study of blood pressure extremes identifies variant near UMOD associated with hypertension. PLoS Genet. 2010;6:e1001177. doi: 10.1371/journal.pgen.1001177. [DOI] [PMC free article] [PubMed] [Google Scholar]
- 10.Ho J.E., Levy D., Rose L., Johnson A.D., Ridker P.M., Chasman D.I. Discovery and replication of novel blood pressure genetic loci in the Women's Genome Health Study. J. Hypertens. 2011;29:62–69. doi: 10.1097/HJH.0b013e3283406927. [DOI] [PMC free article] [PubMed] [Google Scholar]
- 11.Tomaszewski M., Debiec R., Braund P.S., Nelson C.P., Hardwick R., Christofidou P., Denniff M., Codd V., Rafelt S., van der Harst P., et al. Genetic architecture of ambulatory blood pressure in the general population: Insights from cardiovascular gene-centric array. Hypertension. 2010;56:1069–1076. doi: 10.1161/HYPERTENSIONAHA.110.155721. [DOI] [PMC free article] [PubMed] [Google Scholar]
- 12.Johnson A.D., Newton-Cheh C., Chasman D.I., Ehret G.B., Johnson T., Rose L., Rice K., Verwoert G.C., Launer L.J., Gudnason V., et al. Cohorts for Heart and Aging Research in Genomic Epidemiology Consortium. Global BPgen Consortium. Women's Genome Health Study Association of hypertension drug target genes with blood pressure and hypertension in 86,588 individuals. Hypertension. 2011;57:903–910. doi: 10.1161/HYPERTENSIONAHA.110.158667. [DOI] [PMC free article] [PubMed] [Google Scholar]
- 13.Kato N., Takeuchi F., Tabara Y., Kelly T.N., Go M.J., Sim X., Tay W.T., Chen C.H., Zhang Y., Yamamoto K., et al. Meta-analysis of genome-wide association studies identifies common variants associated with blood pressure variation in east Asians. Nat. Genet. 2011;43:531–538. doi: 10.1038/ng.834. [DOI] [PMC free article] [PubMed] [Google Scholar]
- 14.Ehret G.B., Munroe P.B., Rice K.M., Bochud M., Johnson A.D., Chasman D.I., Smith A.V., Tobin M.D., Verwoert G.C., Hwang S.J., et al. International Consortium for Blood Pressure Genome-Wide Association Studies. CARDIoGRAM consortium. CKDGen Consortium. KidneyGen Consortium. EchoGen consortium. CHARGE-HF consortium Genetic variants in novel pathways influence blood pressure and cardiovascular disease risk. Nature. 2011;478:103–109. doi: 10.1038/nature10405. [DOI] [PMC free article] [PubMed] [Google Scholar]
- 15.Wain L.V., Verwoert G.C., O'Reilly P.F., Shi G., Johnson T., Johnson A.D., Bochud M., Rice K.M., Henneman P., Smith A.V., et al. LifeLines Cohort Study. EchoGen consortium. AortaGen Consortium. CHARGE Consortium Heart Failure Working Group. KidneyGen consortium. CKDGen consortium. Cardiogenics consortium. CardioGram Genome-wide association study identifies six new loci influencing pulse pressure and mean arterial pressure. Nat. Genet. 2011;43:1005–1011. doi: 10.1038/ng.922. [DOI] [PMC free article] [PubMed] [Google Scholar]
- 16.Munroe P.B., Johnson T., Caulfield M. The Genetic Architecture of Blood Pressure Variation. Curr. Cardiovasc. Risk Rep. 2009;3:418–425. [Google Scholar]
- 17.Keating B.J., Tischfield S., Murray S.S., Bhangale T., Price T.S., Glessner J.T., Galver L., Barrett J.C., Grant S.F., Farlow D.N., et al. Concept, design and implementation of a cardiovascular gene-centric 50 k SNP array for large-scale genomic association studies. PLoS ONE. 2008;3:e3583. doi: 10.1371/journal.pone.0003583. [DOI] [PMC free article] [PubMed] [Google Scholar]
- 18.Franklin S.S., Lopez V.A., Wong N.D., Mitchell G.F., Larson M.G., Vasan R.S., Levy D. Single versus combined blood pressure components and risk for cardiovascular disease: The Framingham Heart Study. Circulation. 2009;119:243–250. doi: 10.1161/CIRCULATIONAHA.108.797936. [DOI] [PMC free article] [PubMed] [Google Scholar]
- 19.Raney B.J., Cline M.S., Rosenbloom K.R., Dreszer T.R., Learned K., Barber G.P., Meyer L.R., Sloan C.A., Malladi V.S., Roskin K.M., et al. ENCODE whole-genome data in the UCSC genome browser (2011 update) Nucleic Acids Res. 2011;39(Database issue):D871–D875. doi: 10.1093/nar/gkq1017. [DOI] [PMC free article] [PubMed] [Google Scholar]
- 20.Rozowsky J., Euskirchen G., Auerbach R.K., Zhang Z.D., Gibson T., Bjornson R., Carriero N., Snyder M., Gerstein M.B. PeakSeq enables systematic scoring of ChIP-seq experiments relative to controls. Nat. Biotechnol. 2009;27:66–75. doi: 10.1038/nbt.1518. [DOI] [PMC free article] [PubMed] [Google Scholar]
- 21.Valouev A., Johnson D.S., Sundquist A., Medina C., Anton E., Batzoglou S., Myers R.M., Sidow A. Genome-wide analysis of transcription factor binding sites based on ChIP-Seq data. Nat. Methods. 2008;5:829–834. doi: 10.1038/nmeth.1246. [DOI] [PMC free article] [PubMed] [Google Scholar]
- 22.Zhang Y., Liu T., Meyer C.A., Eeckhoute J., Johnson D.S., Bernstein B.E., Nusbaum C., Myers R.M., Brown M., Li W., Liu X.S. Model-based analysis of ChIP-Seq (MACS) Genome Biol. 2008;9:R137. doi: 10.1186/gb-2008-9-9-r137. [DOI] [PMC free article] [PubMed] [Google Scholar]
- 23.Johnson D.S., Mortazavi A., Myers R.M., Wold B. Genome-wide mapping of in vivo protein-DNA interactions. Science. 2007;316:1497–1502. doi: 10.1126/science.1141319. [DOI] [PubMed] [Google Scholar]
- 24.Birney E., Stamatoyannopoulos J.A., Dutta A., Guigó R., Gingeras T.R., Margulies E.H., Weng Z., Snyder M., Dermitzakis E.T., Thurman R.E., et al. ENCODE Project Consortium. NISC Comparative Sequencing Program. Baylor College of Medicine Human Genome Sequencing Center. Washington University Genome Sequencing Center. Broad Institute. Children's Hospital Oakland Research Institute Identification and analysis of functional elements in 1% of the human genome by the ENCODE pilot project. Nature. 2007;447:799–816. doi: 10.1038/nature05874. [DOI] [PMC free article] [PubMed] [Google Scholar]
- 25.Plagnol V., Cooper J.D., Todd J.A., Clayton D.G. A method to address differential bias in genotyping in large-scale association studies. PLoS Genet. 2007;3:e74. doi: 10.1371/journal.pgen.0030074. [DOI] [PMC free article] [PubMed] [Google Scholar]
- 26.Tobin M.D., Sheehan N.A., Scurrah K.J., Burton P.R. Adjusting for treatment effects in studies of quantitative traits: Antihypertensive therapy and systolic blood pressure. Stat. Med. 2005;24:2911–2935. doi: 10.1002/sim.2165. [DOI] [PubMed] [Google Scholar]
- 27.Wallace C., Chapman J.M., Clayton D.G. Improved power offered by a score test for linkage disequilibrium mapping of quantitative-trait loci by selective genotyping. Am. J. Hum. Genet. 2006;78:498–504. doi: 10.1086/500562. [DOI] [PMC free article] [PubMed] [Google Scholar]
- 28.Tang Y. Equivalence of three score tests for association mapping of quantitative trait loci under selective genotyping. Genet. Epidemiol. 2010;34:522–527. doi: 10.1002/gepi.20498. [DOI] [PubMed] [Google Scholar]
- 29.Nyholt D.R. A simple correction for multiple testing for single-nucleotide polymorphisms in linkage disequilibrium with each other. Am. J. Hum. Genet. 2004;74:765–769. doi: 10.1086/383251. [DOI] [PMC free article] [PubMed] [Google Scholar]
- 30.Li J., Ji L. Adjusting multiple testing in multilocus analyses using the eigenvalues of a correlation matrix. Heredity. 2005;95:221–227. doi: 10.1038/sj.hdy.6800717. [DOI] [PubMed] [Google Scholar]
- 31.Watkins W.S., Hunt S.C., Williams G.H., Tolpinrud W., Jeunemaitre X., Lalouel J.M., Jorde L.B. Genotype-phenotype analysis of angiotensinogen polymorphisms and essential hypertension: The importance of haplotypes. J. Hypertens. 2010;28:65–75. doi: 10.1097/HJH.0b013e328332031a. [DOI] [PMC free article] [PubMed] [Google Scholar]
- 32.McCarthy M.I., Abecasis G.R., Cardon L.R., Goldstein D.B., Little J., Ioannidis J.P., Hirschhorn J.N. Genome-wide association studies for complex traits: Consensus, uncertainty and challenges. Nat. Rev. Genet. 2008;9:356–369. doi: 10.1038/nrg2344. [DOI] [PubMed] [Google Scholar]
- 33.Skol A.D., Scott L.J., Abecasis G.R., Boehnke M. Joint analysis is more efficient than replication-based analysis for two-stage genome-wide association studies. Nat. Genet. 2006;38:209–213. doi: 10.1038/ng1706. [DOI] [PubMed] [Google Scholar]
- 34.Ji W., Foo J.N., O'Roak B.J., Zhao H., Larson M.G., Simon D.B., Newton-Cheh C., State M.W., Levy D., Lifton R.P. Rare independent mutations in renal salt handling genes contribute to blood pressure variation. Nat. Genet. 2008;40:592–599. doi: 10.1038/ng.118. [DOI] [PMC free article] [PubMed] [Google Scholar]
- 35.1000 Genomes Project Consortium A map of human genome variation from population-scale sequencing. Nature. 2010;467:1061–1073. doi: 10.1038/nature09534. [DOI] [PMC free article] [PubMed] [Google Scholar]
- 36.O'Hagan A., Forster J. Arnold; London: 2004. Kendall's Advanced Theory of Statistics. Vol. 2B. [Google Scholar]
- 37.Voight B.F., Scott L.J., Steinthorsdottir V., Morris A.P., Dina C., Welch R.P., Zeggini E., Huth C., Aulchenko Y.S., Thorleifsson G., et al. MAGIC investigators. GIANT Consortium Twelve type 2 diabetes susceptibility loci identified through large-scale association analysis. Nat. Genet. 2010;42:579–589. doi: 10.1038/ng.609. [DOI] [PMC free article] [PubMed] [Google Scholar]
- 38.Zhu X., Young J.H., Fox E., Keating B.J., Franceschini N., Kang S., Tayo B., Adeyemo A., Sun Y.V., Li Y., et al. Combined admixture mapping and association analysis identifies a novel blood pressure genetic locus on 5p13: Contributions from the CARe consortium. Hum. Mol. Genet. 2011;20:2285–2295. doi: 10.1093/hmg/ddr113. [DOI] [PMC free article] [PubMed] [Google Scholar]
- 39.Park J.H., Wacholder S., Gail M.H., Peters U., Jacobs K.B., Chanock S.J., Chatterjee N. Estimation of effect size distribution from genome-wide association studies and implications for future discoveries. Nat. Genet. 2010;42:570–575. doi: 10.1038/ng.610. [DOI] [PMC free article] [PubMed] [Google Scholar]
- 40.Koivisto U.M., Palvimo J.J., Jänne O.A., Kontula K. A single-base substitution in the proximal Sp1 site of the human low density lipoprotein receptor promoter as a cause of heterozygous familial hypercholesterolemia. Proc. Natl. Acad. Sci. USA. 1994;91:10526–10530. doi: 10.1073/pnas.91.22.10526. [DOI] [PMC free article] [PubMed] [Google Scholar]
- 41.Musunuru K., Strong A., Frank-Kamenetsky M., Lee N.E., Ahfeldt T., Sachs K.V., Li X., Li H., Kuperwasser N., Ruda V.M., et al. From noncoding variant to phenotype via SORT1 at the 1p13 cholesterol locus. Nature. 2010;466:714–719. doi: 10.1038/nature09266. [DOI] [PMC free article] [PubMed] [Google Scholar]
- 42.Liu L., Cara D.C., Kaur J., Raharjo E., Mullaly S.C., Jongstra-Bilen J., Jongstra J., Kubes P. LSP1 is an endothelial gatekeeper of leukocyte transendothelial migration. J. Exp. Med. 2005;201:409–418. doi: 10.1084/jem.20040830. [DOI] [PMC free article] [PubMed] [Google Scholar]
- 43.Jongstra-Bilen J., Janmey P.A., Hartwig J.H., Galea S., Jongstra J. The lymphocyte-specific protein LSP1 binds to F-actin and to the cytoskeleton through its COOH-terminal basic domain. J. Cell Biol. 1992;118:1443–1453. doi: 10.1083/jcb.118.6.1443. [DOI] [PMC free article] [PubMed] [Google Scholar]
- 44.Anderson C.A., Boucher G., Lees C.W., Franke A., D'Amato M., Taylor K.D., Lee J.C., Goyette P., Imielinski M., Latiano A., et al. Meta-analysis identifies 29 additional ulcerative colitis risk loci, increasing the number of confirmed associations to 47. Nat. Genet. 2011;43:246–252. doi: 10.1038/ng.764. [DOI] [PMC free article] [PubMed] [Google Scholar]
- 45.Turnbull C., Ahmed S., Morrison J., Pernet D., Renwick A., Maranian M., Seal S., Ghoussaini M., Hines S., Healey C.S., et al. Breast Cancer Susceptibility Collaboration (UK) Genome-wide association study identifies five new breast cancer susceptibility loci. Nat. Genet. 2010;42:504–507. doi: 10.1038/ng.586. [DOI] [PMC free article] [PubMed] [Google Scholar]
- 46.Stefancsik R., Randall J.D., Mao C., Sarkar S. Structure and sequence of the human fast skeletal troponin T (TNNT3) gene: Insight into the evolution of the gene and the origin of the developmentally regulated isoforms. Comp. Funct. Genomics. 2003;4:609–625. doi: 10.1002/cfg.343. [DOI] [PMC free article] [PubMed] [Google Scholar]
- 47.Sung S.S., Brassington A.M., Krakowiak P.A., Carey J.C., Jorde L.B., Bamshad M. Mutations in TNNT3 cause multiple congenital contractures: A second locus for distal arthrogryposis type 2B. Am. J. Hum. Genet. 2003;73:212–214. doi: 10.1086/376418. [DOI] [PMC free article] [PubMed] [Google Scholar]
- 48.Lefebvre V. The SoxD transcription factors—Sox5, Sox6, and Sox13—are key cell fate modulators. Int. J. Biochem. Cell Biol. 2010;42:429–432. doi: 10.1016/j.biocel.2009.07.016. [DOI] [PMC free article] [PubMed] [Google Scholar]
- 49.Hsu Y.H., Zillikens M.C., Wilson S.G., Farber C.R., Demissie S., Soranzo N., Bianchi E.N., Grundberg E., Liang L., Richards J.B., et al. An integration of genome-wide association study and gene expression profiling to prioritize the discovery of novel susceptibility Loci for osteoporosis-related traits. PLoS Genet. 2010;6:e1000977. doi: 10.1371/journal.pgen.1000977. [DOI] [PMC free article] [PubMed] [Google Scholar]
- 50.Lalouel J.M., Rohrwasser A., Terreros D., Morgan T., Ward K. Angiotensinogen in essential hypertension: From genetics to nephrology. J. Am. Soc. Nephrol. 2001;12:606–615. doi: 10.1681/ASN.V123606. [DOI] [PubMed] [Google Scholar]
- 51.Jeunemaitre X., Lifton R.P., Hunt S.C., Williams R.R., Lalouel J.M. Absence of linkage between the angiotensin converting enzyme locus and human essential hypertension. Nat. Genet. 1992;1:72–75. doi: 10.1038/ng0492-72. [DOI] [PubMed] [Google Scholar]
- 52.Caulfield M., Lavender P., Farrall M., Munroe P., Lawson M., Turner P., Clark A.J. Linkage of the angiotensinogen gene to essential hypertension. N. Engl. J. Med. 1994;330:1629–1633. doi: 10.1056/NEJM199406093302301. [DOI] [PubMed] [Google Scholar]
- 53.Furchgott R.F., Zawadzki J.V. The obligatory role of endothelial cells in the relaxation of arterial smooth muscle by acetylcholine. Nature. 1980;288:373–376. doi: 10.1038/288373a0. [DOI] [PubMed] [Google Scholar]
- 54.Huang P.L., Huang Z., Mashimo H., Bloch K.D., Moskowitz M.A., Bevan J.A., Fishman M.C. Hypertension in mice lacking the gene for endothelial nitric oxide synthase. Nature. 1995;377:239–242. doi: 10.1038/377239a0. [DOI] [PubMed] [Google Scholar]
- 55.Rose R.A., Giles W.R. Natriuretic peptide C receptor signalling in the heart and vasculature. J. Physiol. 2008;586:353–366. doi: 10.1113/jphysiol.2007.144253. [DOI] [PMC free article] [PubMed] [Google Scholar]
- 56.Matsukawa N., Grzesik W.J., Takahashi N., Pandey K.N., Pang S., Yamauchi M., Smithies O. The natriuretic peptide clearance receptor locally modulates the physiological effects of the natriuretic peptide system. Proc. Natl. Acad. Sci. USA. 1999;96:7403–7408. doi: 10.1073/pnas.96.13.7403. [DOI] [PMC free article] [PubMed] [Google Scholar]
- 57.Lanktree M.B., Guo Y., Murtaza M., Glessner J.T., Bailey S.D., Onland-Moret N.C., Lettre G., Ongen H., Rajagopalan R., Johnson T., et al. Hugh Watkins on behalf of PROCARDIS. Meena Kumari on behalf of the Whitehall II Study and the WHII 50K Group Meta-analysis of Dense Genecentric Association Studies Reveals Common and Uncommon Variants Associated with Height. Am. J. Hum. Genet. 2011;88:6–18. doi: 10.1016/j.ajhg.2010.11.007. [DOI] [PMC free article] [PubMed] [Google Scholar]
- 58.Feder J.N., Gnirke A., Thomas W., Tsuchihashi Z., Ruddy D.A., Basava A., Dormishian F., Domingo R., Jr., Ellis M.C., Fullan A., et al. A novel MHC class I-like gene is mutated in patients with hereditary haemochromatosis. Nat. Genet. 1996;13:399–408. doi: 10.1038/ng0896-399. [DOI] [PubMed] [Google Scholar]
- 59.Marzluff W.F., Duronio R.J. Histone mRNA expression: Multiple levels of cell cycle regulation and important developmental consequences. Curr. Opin. Cell Biol. 2002;14:692–699. doi: 10.1016/s0955-0674(02)00387-3. [DOI] [PubMed] [Google Scholar]
- 60.Di Leva F., Domi T., Fedrizzi L., Lim D., Carafoli E. The plasma membrane Ca2+ ATPase of animal cells: Structure, function and regulation. Arch. Biochem. Biophys. 2008;476:65–74. doi: 10.1016/j.abb.2008.02.026. [DOI] [PubMed] [Google Scholar]
- 61.Meyer T.E., Verwoert G.C., Hwang S.J., Glazer N.L., Smith A.V., van Rooij F.J., Ehret G.B., Boerwinkle E., Felix J.F., Leak T.S., et al. Genetic Factors for Osteoporosis Consortium. Meta Analysis of Glucose and Insulin Related Traits Consortium Genome-wide association studies of serum magnesium, potassium, and sodium concentrations identify six Loci influencing serum magnesium levels. PLoS Genet. 2010;6 doi: 10.1371/journal.pgen.1001045. [DOI] [PMC free article] [PubMed] [Google Scholar]
- 62.Goyette P., Sumner J.S., Milos R., Duncan A.M., Rosenblatt D.S., Matthews R.G., Rozen R. Human methylenetetrahydrofolate reductase: Isolation of cDNA mapping and mutation identification. Nat. Genet. 1994;7:551. [PubMed] [Google Scholar]
- 63.Qian X., Lu Z., Tan M., Liu H., Lu D. A meta-analysis of association between C677T polymorphism in the methylenetetrahydrofolate reductase gene and hypertension. Eur. J. Hum. Genet. 2007;15:1239–1245. doi: 10.1038/sj.ejhg.5201914. [DOI] [PubMed] [Google Scholar]
- 64.Jentsch T.J. CLC chloride channels and transporters: From genes to protein structure, pathology and physiology. Crit. Rev. Biochem. Mol. Biol. 2008;43:3–36. doi: 10.1080/10409230701829110. [DOI] [PubMed] [Google Scholar]
- 65.Neagoe I., Stauber T., Fidzinski P., Bergsdorf E.Y., Jentsch T.J. The late endosomal ClC-6 mediates proton/chloride countertransport in heterologous plasma membrane expression. J. Biol. Chem. 2010;285:21689–21697. doi: 10.1074/jbc.M110.125971. [DOI] [PMC free article] [PubMed] [Google Scholar]
Associated Data
This section collects any data citations, data availability statements, or supplementary materials included in this article.