Abstract
Next-generation sequencing (NGS) techniques have already shown their potential in the identification of mutations underlying rare inherited disorders. We report here the application of linkage analysis in combination with targeted DNA capture and NGS to a Norwegian family affected by an undiagnosed mental retardation disorder with an autosomal recessive inheritance pattern. Linkage analysis identified two loci on chromosomes 9 and 17 which were subject to target enrichment by hybridization to a custom microarray. NGS achieved 20-fold or greater sequence coverage of 83% of all protein-coding exons in the target regions. This led to the identification of compound heterozygous mutations in NAGLU, compatible with the diagnosis of Mucopolysaccharidosis IIIB (MPS IIIB or Sanfilippo Syndrome type B). This diagnosis was confirmed by demonstrating elevated levels of heparan sulphate in urine and low activity of α-N-acetyl-glucosaminidase in cultured fibroblasts. Our findings describe a mild form of MPS IIIB and illustrate the diagnostic potential of targeted NGS in Mendelian disease with unknown aetiology.
Keywords: next-generation sequencing, DNA target enrichment, sequence capture, Sanfilippo Syndrome type B, mucopolysaccharidosis, NAGLU
INTRODUCTION
The advent of next-generation sequencing (NGS) techniques is expected to accelerate the identification of mutations causing Mendelian disorders1 and both whole-genome and whole-exome approaches have proven successful in recent studies.2, 3, 4, 5, 6 In each case, massively parallel sequencing has produced a large amount of sequence information and identified large numbers of novel genetic variants of unknown significance, which makes the identification of the causal mutation challenging. So far, the application of NGS for diagnostic purposes is already established, but the choice of approach used to identify disease causing mutation(s) remains a challenge. This report illustrates the potential and power of using family data.
Mucopolysaccharidosis IIIB (MPS IIIB) (Sanfilippo Syndrome type B; OMIM 252920) is an autosomal recessive disorder caused by an enzyme deficiency of α-N-acetyl-glucosaminidase due to mutations in the NAGLU gene (NM_000263).7 This enzyme is involved in the degradation of the glycosaminoglycan compound heparan sulphate and impaired function leads to the accumulation of partially degraded mucopolysaccharides in tissues, and increased excretion of these compounds in urine. The disorder is clinically heterogeneous and >100 different NAGLU mutations have been reported.8 The clinical picture varies, but is usually characterised by developmental delay, behavioural abnormalities and sleep disturbance in early childhood. Progressive dementia and coarsening of facial features evolve slowly. As initial symptoms and signs of MPS IIIB might be subtle and non-specific during childhood, the diagnosis may be easily overlooked in its early years by the child neurologist. When these patients are subsequently transferred to the care of adult medicine, it is our experience that the search for an aetiological diagnosis is less ambitious and that such patients may remain undiagnosed despite neurological deterioration.
The Norwegian family presented in this paper demonstrated an unusually mild form of MPS IIIB. Urine analysis performed during the primary investigations of the family 10 years before reinvestigation failed to detect abnormal amounts of glycosaminoglycans. As the family remained undiagnosed on reinvestigation, linkage analysis in combination with targeted DNA capture and NGS was applied to obtain the diagnosis. The results are presented here.
PATIENTS AND METHODS
Patients
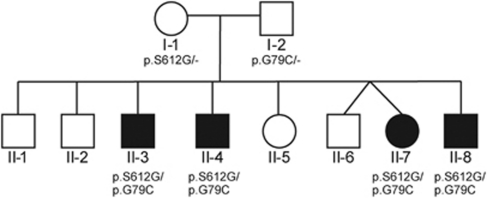
The subject family contained eight siblings, of whom four (three males and one female) were affected by an unknown genetic disorder, later diagnosed as MPS IIIB as described below (Figure 1). Medical data on affected individuals were compiled from several different sources: Medical history taken in conversation with the parents, healthy siblings and other relatives, notes on numerous visits to the local nursery, medical charts from hospital admissions, reports from ophthalmological examination with fundoscopy, results on cerebral CT and MRI examinations, and clinical neurological examination performed on all siblings.
Figure 1.
Pedigree of the family.
Linkage analysis
All 10 members of the family were genotyped using the Affymetrix GeneChip Human Mapping 10K 2.0 array,9 following the suppliers protocol. Washing and staining were performed with the Affymetrix Fluidics Station 450 (Affymetrix Inc., Santa Clara, CA, USA) and the signal intensities detected with the GeneChip Scanner 3000 7G (Affymetrix Inc., Santa Clara, CA, USA). The results from the Affymetrix arrays were analysed in GeneChip Genotyping Analysis Software (GTYPE)10 and GeneChip Operating Software (GCOS). Data handling, Mendelian error control and statistical analyses were done using Progeny Lab software (version 5, Progeny Software, LLC, South Bend, IN, USA), PEDSTATS11 and MERLIN.12
Target capture by DNA microarray hybridisation
Based on the linkage results, exons defined in Ensembl release 48 were selected from three adjacent regions on chromosome 17 (NCBI Build 36.1/hg18 chromosome coordinates 28 813 215–28 942 222; 29 615 779–31 041 457; 36 815 436–39 115 918). Exon target regions were extended to include flanking sequence such that each target was no shorter than 500 bp. Based on this target list, a custom Sequence Capture 385K human array was designed and manufactured by Roche Nimblegen Inc. (Madison, WI, USA). Due to the presence of repetitive elements, not all desired regions (hereafter referred to as ‘targets') could be represented on the array (represented regions hereafter are referred to as ‘tiled regions'). The array contained oligonucleotide probes of length 60–90 nucleotides with 3 bp spacing. A total of 526 210 bp were tiled. The tiled region covered 86% of all target exon sequences (90% of all targeted coding exons). Target and tiled regions are available in BED file format upon request. Similar target regions from within a second linkage peak on chromosome 9 were tiled on a second array (details available upon request).
Twenty micrograms of genomic DNA from individual II-4 (Figure 1) was sonicated using a Bioruptor sonicator (Diagenode s.a., Liege, Belgium) to an average size of 400 bp. DNA ends were blunted by incubation with Klenow polymerase before ligation to oligonucleotide linker (previously prepared by annealing the following two oligonucleotides: LM-PCR-A 5′ P-GAGGATCCAGAATTCTCGAGTT and LM-PCR-B 5′ CTCGAGAATTCTGGATCCTC). Linker dimers were removed by purifying the ligated DNA using AMPure beads (Beckman Coulter Inc., Brea, CA, USA). DNA was hybridised to the arrays on a MAUI hybridisation station (Biomicro Systems, Salt Lake City, UT, USA) according to Roche Nimblegen instructions for 65 h. Arrays were washed according to Roche Nimblegen instructions. Captured DNA was eluted from arrays by incubating at 95 °C for 5 min with 500 μl water under a coverslip with gasket in a microarray hybridisation chamber (Agilent Technologies Inc., Santa Clara, CA, USA). Eluted DNA was concentrated using a YM-100 microcon concentrator (Millipore, Billerica, MA, USA) before LM-PCR amplification using the above LM-PCR-B oligonucleotide. Enrichment efficiency was verified using selected PCR amplimers chosen to represent exons targeted for enrichment (data not shown). Before sequencing, the majority of linker sequence was removed by BamHI digestion.
Next-generation sequencing
Two micrograms of enriched DNA was used to generate a library and run on a single lane of an Illumina GAIIx sequencer (Illumina Inc., San Diego, CA, USA), with paired-end reads of 50 bp, following the manufacturer's instructions. Image analysis and base calling were performed using Illumina's RTA software version 2.4 (Illumina Inc.) and pipeline software version 1.4 (Illumina Inc.). Reads were filtered to remove those with low base call quality using Illumina's default chastity criteria. We used MAQ13 to map the sequence reads to chromosome 17, assemble alignments and call single-nucleotide polymorphisms (SNPs). SNPs were characterised (presence in dbSNP build 129, non-coding/coding, non-synonymous/synonymous) using SNPnexus.14 Custom Perl scripts were used to identify regions with zero coverage, and prepare BED files for viewing data on the University of California at Santa Cruz (UCSC) genome browser (http://genome.ucsc.edu). Fold enrichment of the regions targeted on the entire array was calculated using the formula used by Volpi et al15: (ΣREMTrm/STrm)/(ΣRMG/SG), where ΣREMTrm is the number of reads mapping to the repeat-masked target region, STrm is the size of the repeat-masked target region, ΣRMG is the number of reads mapping uniquely to the human genome and SG is the size of the human genome.
Sanger sequencing
In addition, both the GC-rich first exon of NAGLU and the mutation identified by NGS in the sixth exon of NAGLU were verified by Sanger sequencing using PCR amplification and an Applied Biosystems (Foster City, CA, USA) 3730 DNA Analyzer. The GC-rich first exon of NAGLU was amplified using AmpliTaq Gold 360 Master Mix (Applied Biosystems). Primers are available upon request.
RESULTS
Clinical data
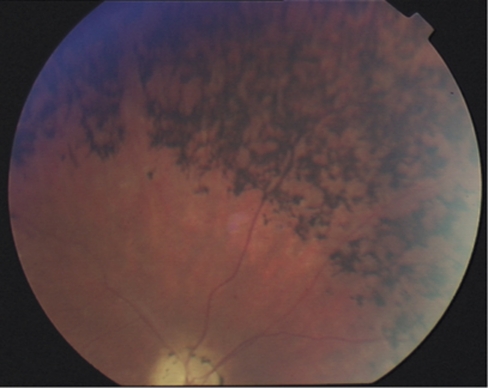
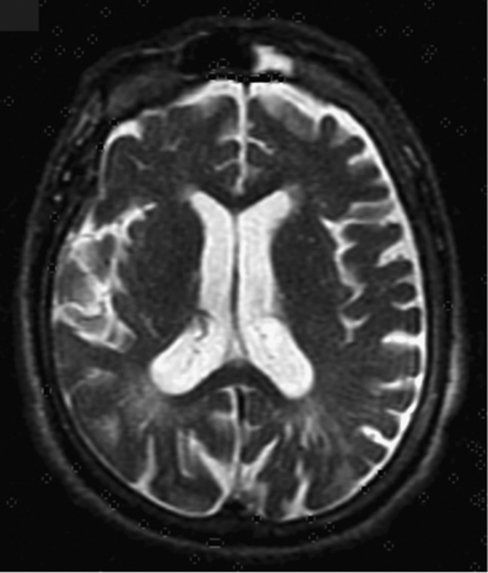
The four affected individuals went to special schools, but acquired skills sufficient to handle their own money, run errands in the grocery store and keep a simple job under supervision. From their mid-twenties their cognitive and motor functions started to deteriorate. Night vision became increasingly impaired due to retinitis pigmentosa (Figure 2). Ambulation became gradually restricted not only because of retinitis pigmentosa, but also due to cerebellar and sensory ataxia, and three of the four affected siblings had to use a wheelchair. Speech was slowly lost as they developed repetitive and stereotypic behaviour with sudden aggressive outbursts. A tendency for incontinence for urine and faeces was present from childhood. Cerebral CT showed gross cortical atrophy and marked thickening of the cranial bones. Cerebral MRI demonstrated gross cortical atrophy, dilatation of the ventricles and mild cerebellar atrophy (Figure 3). Further details of the clinical phenotype of each patient can be found in Table 1.
Figure 2.
Fundus photography of individual II-4 illustrating retinitis pigmentosa with dark pigment deposits, optic disc pallor and thinning of the arteries.
Figure 3.
Cerebral axial T2-weighted MRI of individual II-4 demonstrating cortical atrophy and widening of the lateral ventricles. Note hypo-intensive foci in periventricular white matter, possibly representing small cysts or dilated perivascular spaces filled with mucopolysaccharides or cerebrospinal fluid.
Table 1. Clinical information on affected individuals.
| II-3 | II-4 | II-7 | II-8 | |
|---|---|---|---|---|
| Sex | Male | Male | Female | Male |
| Year of birth | 1949 | 1952 | 1956 | 1963 |
| Walked at age | Before 18 months | 18 months | Normal | Normal |
| Language development | Slow | Sentences at 4 years | Normal | Slow |
| Education/employment | Regular primary school at 7 years, special school from 12 years. Manual work until 35 years | Regular primary school at 7 years, special school from 10 years. No schooling after 13 years. Manual work until 35 years | Regular primary school at 7 years, later transferred to special school. Never employed | Special school from 9 years. Manual work until 40 years |
| Tonsillitis | Numerous tonsillectomy at 8 years | Numerous tonsillectomy at 6 years | NA | Numerous |
| Vision/eye findings | Impaired dark vision | RP at 39 years (Figure 2) | Optic disc pallor and loss of pigment in the periphery of the retina | RP identical to II-4. Impaired dark vision at 20 years |
| Behaviour | Sleep disturbance and aggressive behaviour recorded at 40 years. Stereotypic and compulsive walkinga | Anxious, restless and aggressive with stereotypic movements recorded at 39 years | Restless with compulsive walking. Aggressive in adult life | Emotionally unstable, psychotic episodes. Sleeping difficulties. Rapid cognitive decline last 2 years |
| Neuroimaging (CT or MRI) | NA | Cortical and central atrophy with periventricular white matter cysts (MRI) (Figure 3) | Cortical and central atrophy (CT) | Cortical and central atrophy with cysts in corpus callosum (MRI) |
| Other neurological findings | Gait ataxia, hyperreflexia and inverted plantar responses | Gait ataxia; dorsal column and peripheral sensory component. Plantar responses inverted | Gait ataxia. Deep tendon reflexes were hyperactive and plantar responses inverted | Gait ataxia. Deep tendon reflexes were hyperactive and plantar responses inverted |
| Other clinical findings | NA | NA | Epilepsy | NA |
Abbreviations: NA, not available; RP, retinitis pigmentosa; CT, computed tomography; MRI, magnetic resonance imaging.
For the past 20 years, he has been walking the same circle 12 h per day, touching doorframes that need a new coat of paint every second year.
Linkage results
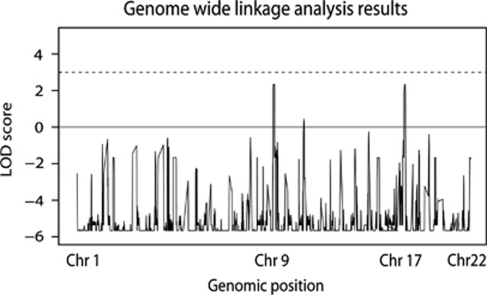
Linkage analysis, assuming a fully penetrant recessive mode of inheritance and a frequency of 0.0001 of the disease allele, identified two loci with the maximum expected LOD score of 2.3 on chromosomes 9 and 17 (Figure 4). Maximum LOD score results on the remaining chromosomes were all negative. The intervals 9p21.3-p22.3 and 17q11.2-q12 contained nearly 22 Mb of sequence and 450 genes in total according to the Ensembl genome browser (http://www.ensembl.org).
Figure 4.
LOD score results from the genome-wide linkage analysis. Two regions on chromosomes 9 and 17 reached the maximum estimated LOD score of 2.3.
Targeted DNA capture and NGS
Targeted high-throughput resequencing was performed for selected exons within both the chromosome 9 and 17 linkage peaks on DNA from a single patient (see Materials and methods). Chromosome 9 regions were captured on a custom microarray and sequenced on half a PicoTiterPlate of a Roche-454 GS FLX Titanium instrument; however, no candidate mutations likely to explain the patients' phenotype were discovered (data not shown). Selected exons from within the chromosome 17 linkage peak were similarly enriched on a custom microarray and sequenced using a single lane of Illumina sequencing. These regions encompassed 126 known and predicted genes, of which 109 were protein coding. A total of 1115 exons were targeted, of which 1023 were finally represented by 930 tiled regions totalling 526 210 bp. Protein-coding bases totalled 140 202 bp. Performance of the capture array and Illumina sequencing are detailed in Table 2, and compares favourably with similar published experiments with ∼70% reads on target and 92% of tiled regions covered by ≥20-fold sequencing depth. Applying the formula for calculating enrichment,15 the array achieved 1744-fold enrichment of target regions over the input genomic DNA (see Materials and methods). In summary, of all protein-coding exons within the linkage peak, 83% were captured and sequenced to ≥20-fold sequencing depth. A total of 13.1% had no sequence coverage, either being unsuitable for tiling due to repetitive elements (10%) or due to technical limitations of the capture and sequencing technologies (3.1%).
Table 2. Performance of the capture array and the Illumina sequencing for the chromosome 17 linked region.
| Sequencing output (entire array) | |
| Number reads passing filters | 22 173 516 |
| Reads mapping uniquely to human genome | 20 203 662 (91%) |
| Reads mapping multiple times to human genome | 1 113 480 (5%) |
| Reads failed to map to human genome | 856 374 (4%) |
| Capture array performance (entire array) | |
| Number unique reads mapping to tiles | 14 260 070 (70.5%) |
| Sequence depth (chr17 tiled regions only)a | |
| Number unique reads mapping to tiles | 5 076 025 |
| Sequence generated over tiled regions | 210 442 925 bp |
| Tile median coverage depth | 424-fold |
| Tiled coding exon median coverage depth | 356-fold |
| Tiled base coverage ≥20-fold | 485 835 of 526 210 (92.3%) |
| Tiled bases with zero coverage | 22 283 of 526 210 (4.2%) |
| Coding exon bases coverage ≥20-fold | 131 118 of 140 202 (93.5%) |
| Coding exon bases with zero coverage | 4729 of 140 202 (3.4%) |
Note that the array also contained chr14 sequences not relevant to this particular family, and that the sequence depth figures given here correspond only to the chr17 sequences referred to in this article.
Within the tiled regions, a total of 1168 single-nucleotide variants (SNVs) were identified, each with a coverage depth of 10-fold or greater. Initially, we removed all SNVs that overlapped with known SNPs present in the dbSNP build 129 database, after which 575 SNVs remained (Supplementary File 1). Of 75 SNVs affecting coding sequence, 47 were synonymous variants. Of the remaining novel missense or non-sense variants, only a single SNV appeared in a homozygous state. However, this homozygous SNV caused a conservative valine-glycine shift in an unconserved amino-acid position of the NLE1 gene, and as a result was not considered a likely causative mutation. The search for mutations was, therefore, extended to include further possibilities such as splice site variations and compound heterozygous variants. While considering the possibility that the NAGLU gene could be a potential causative gene in a compound heterozygous state due to the presence of two missense mutations in exon 6, it was noticed that the first exon contained a 460-bp sequence coverage gap in a region of high GC content. The NAGLU gene was considered a prime candidate based on phenotype descriptions in OMIM (MIM ID #252920), so this gap was sequenced by traditional Sanger sequencing and a third missense SNV was detected. Sanger sequencing of exon 1 and parts of exon 6 in the parents allowed identification of the parental source of each mutation. Two missense mutations are detailed as follows in the reference sequence NM_000263 (one of the SNVs seen in the Illumina data was not replicated by traditional Sanger sequencing):
Paternal: c.235G>T/p.G79C (in exon 1)
Maternal: c.1834A>G/p.S612G (in exon 6)
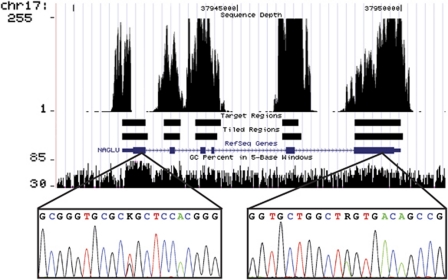
Crucially, both of these mutations have been previously described as causing MPS IIIB /Sanfilippo Syndrome type B. Sequence depth over the NAGLU gene, including the gap region where the paternal mutation was later found by Sanger sequencing is depicted in Figure 5. Sequence traces of Sanger sequencing used to confirm the Illumina data and cover the gap are included as insets, with their locations on the gene indicated.
Figure 5.
Screen shot from UCSC genome browser showing the NAGLU gene structure in blue (http://genome.ucsc.edu/) and GC content from 30 to 85%. Custom tracks were added to show sequence coverage (capped at 255-fold for ease of display), targeted exons and tiled regions covered on the sequence-capture array. Insets show Sanger sequencing traces from the regions containing the paternal (on the left; c.235G>T) and maternal (on the right; c.1834A>G) mutations. Note the coincidence of high GC content with zero NGS sequence coverage.
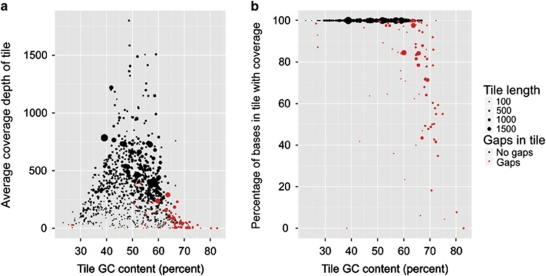
We examined the effect of GC content and capture tile size on sequence coverage, and observed that tiles with extremes of low or high GC content suffered from reduced sequence coverage. In addition, tile size was an important factor determining coverage, with small tile size (≤100 bp) associated with low coverage depth (Figure 6a). When focusing on tiles containing sequencing gaps, it is clear that small tiles can be poorly covered irrespective of GC content, but when tile GC content exceeds 60%, coverage in larger tiles also deteriorates (Figure 6b).
Figure 6.
Effect of tile GC content and size on sequence coverage depth of all tiled regions. (a) Effect of tile length and GC content on tile average coverage depth. (b) Effect of tile length and GC content on percent of tile bases with ≥1-fold coverage.
Biochemical verification of MPS IIIB diagnosis
To verify the diagnosis of Sanfilippo Syndrome type B, urine was analysed from all affected family members. Increased levels of secreted glycosaminoglycans were observed by the dimethylmethylene blue test, and the presence of excess heparan sulphate was confirmed by thin layer chromatography (data not shown). In addition, α-N-acetyl-glucosaminidase activity in cultured fibroblasts derived from individual II-4 was found to be 3% of normal control levels (data not shown), thus confirming the diagnosis.
DISCUSSION
The affected individuals described in this paper were diagnosed with MPS IIIB by genome-wide linkage analysis and subsequent NGS of the linked regions. The lack of NGS sequence coverage observed in the first exon of the NAGLU gene, which prevented diagnosis based on NGS data alone, is typical of GC-rich first exons, as has been observed before.16 Regions of low or zero sequence coverage typically corresponded to GC-rich genomic areas or small target regions. These regions limit capture (poor hybridisation to small fragments) and sequencing (GC-rich regions remain challenging for sequencing-by-synthesis technology). GC-rich regions may also elute less efficiently from arrays, further contributing to their low sequence coverage. Developments in sequencing technology such as direct single molecule sequencing may remove much of this bias in the future.17 However, in the time elapsed since the experiments presented here were performed, some improvements in coverage have been obtained simply by limiting the number of PCR cycles employed during the procedure.18
We identified two compound heterozygous mutations in the NAGLU gene, the paternal c.235G>T/p.G79C and maternal c.1834A>G/p.S612G. Both mutations have previously been identified in MPS IIIB patients. The p.S612G mutation has been identified in both compound heterozygous and homozygous states, all producing attenuated phenotypes, whereas the p.G79C mutation has been identified in a homozygous state in a severely affected individual.19, 20, 21 The patients reported here are mildly affected and this supports the hypothesis that particular mutations, including p.S612G, seem to reduce the clinical severity of the disease.21, 22 Even in the presence of the p.G79C mutation known to produce a severe phenotype, the allele with the p.S612G mutation seems to be able to provide a residual enzyme activity sufficient to mitigate the course of the disease.
The patients described here range in age from 47 to 61 years. The clinical course of the disease was quite similar in all four, being remarkably mild the first two decades of life with stable, but reduced intellectual ability. In their third decade of life, however, they all showed a marked decline both cognitively and physically. Three of them were diagnosed with retinitis pigmentosa. The phenotype resembles previously reported MPS IIIB patients with an attenuated form, in particular the ones known to have at least one allele with the p.S612G mutation.21 Since the paternal allele p.G79C has previously been associated with the severe phenotypic form of MPS IIIB, it is likely that the attenuated form seen in the patients described here is due to residual enzyme activity derived largely from the maternal p.S612G allele. This is consistent with the observations of Valstar et al,21 who reported four patients carrying this allele in compound heterozygote and one homozygous carrier, all of whom had the attenuated MPS IIIB disease form. In the patient's cells examined in this study, α-N-acetyl-glucosaminidase activity was only 3% of normal levels. This activity was probably produced by the p.S612G allele and may be of clinical relevance. Like most MPS IIIB mutations, p.S612G does not affect the active site of the enzyme, but is rather expected to affect the folding and/or stability of the enzyme.23 As such, the attenuated form of the disease may be the most responsive to therapies based on ‘chemical chaperones' which may hold promise if toxicity issues can be resolved.23
Clinical and allelic heterogeneity are common features in many Mendelian diseases. A selection bias of severely affected individuals and families in genetic studies leads to disease descriptions and diagnosis criteria which are appropriate for the more severe forms of the disease spectrum. The recent paper by Valstar et al21 suggests that this is also the case in MPS IIIB. In an overview of the clinical history and molecular basis of an unbiased cohort of 44 Dutch patients with MPS IIIB, they demonstrate that as much as 79% had the attenuated form, even though the general notion has been that the severe form is the most frequent. Such a selection bias in medical genetic research makes the clinical and genetic diagnostics of the milder phenotypes challenging. However, with the advent of several genome-wide techniques, in particular NGS and exome sequencing, genetic diagnostics will no longer have to rely on the candidate gene approach, facilitating the diagnosis of a greater proportion of mildly affected individuals with genetic disorders with unspecific manifestations. The approach presented here clearly demonstrates the valuable diagnostic potential of NGS and also the utility and power of additional family information.
Acknowledgments
We thank Jan-Eric Månsson, Department of Neurochemistry, Sahlgren's University Hospital, Molndal, Sweden, for NAGLU enzyme assay, Berit Woldseth, Department of Medical Biochemistry, Oslo University Hospital, for thin layer chromatography, Knut Lindberg, Department of Ophthalmology, Oslo University Hospital for fundus photography, and Andres Server, Department of Radiology, Oslo University Hospital, for interpreting MRI images. The sequencing service was provided by the Norwegian High-Throughput Sequencing Centre, a national technology platform supported by the ‘Functional Genomics' and ‘Infrastructure' programs of the Research Council of Norway and the Southeastern Regional Health Authorities.
The authors declare no conflict of interest.
Footnotes
Supplementary Information accompanies the paper on European Journal of Human Genetics website (http://www.nature.com/ejhg)
Supplementary Material
References
- Cooper DN, Chen JM, Ball EV, et al. Genes, mutations, and human inherited disease at the dawn of the age of personalized genomics. Hum Mutat. 2010;31:631–655. doi: 10.1002/humu.21260. [DOI] [PubMed] [Google Scholar]
- Ng SB, Buckingham KJ, Lee C, et al. Exome sequencing identifies the cause of a mendelian disorder. Nat Genet. 2010;42:30–35. doi: 10.1038/ng.499. [DOI] [PMC free article] [PubMed] [Google Scholar]
- Sobreira NL, Cirulli ET, Avramopoulos D, et al. Whole-genome sequencing of a single proband together with linkage analysis identifies a Mendelian disease gene. PLoS Genet. 2010;6:e1000991. doi: 10.1371/journal.pgen.1000991. [DOI] [PMC free article] [PubMed] [Google Scholar]
- Choi M, Scholl UI, Ji W, et al. Genetic diagnosis by whole exome capture and massively parallel DNA sequencing. Proc Natl Acad Sci USA. 2009;106:19096–19101. doi: 10.1073/pnas.0910672106. [DOI] [PMC free article] [PubMed] [Google Scholar]
- Lupski JR, Reid JG, Gonzaga-Jauregui C, et al. Whole-genome sequencing in a patient with Charcot-Marie-Tooth neuropathy. N Engl J Med. 2010;362:1181–1191. doi: 10.1056/NEJMoa0908094. [DOI] [PMC free article] [PubMed] [Google Scholar]
- Ng SB, Bigham AW, Buckingham KJ, et al. Exome sequencing identifies MLL2 mutations as a cause of Kabuki syndrome. Nat Genet. 2010;42:790–793. doi: 10.1038/ng.646. [DOI] [PMC free article] [PubMed] [Google Scholar]
- Zhao HG, Li HH, Bach G, Schmidtchen A, Neufeld EF. The molecular basis of Sanfilippo syndrome type B. Proc Natl Acad Sci USA. 1996;93:6101–6105. doi: 10.1073/pnas.93.12.6101. [DOI] [PMC free article] [PubMed] [Google Scholar]
- Valstar MJ, Ruijter GJ, van Diggelen OP, Poorthuis BJ, Wijburg FA. Sanfilippo syndrome: a mini-review. J Inherit Metab Dis. 2008;31:240–252. doi: 10.1007/s10545-008-0838-5. [DOI] [PubMed] [Google Scholar]
- Matsuzaki H, Loi H, Dong S, et al. Parallel genotyping of over 10 000 SNPs using a one-primer assay on a high-density oligonucleotide array. Genome Res. 2004;14:414–425. doi: 10.1101/gr.2014904. [DOI] [PMC free article] [PubMed] [Google Scholar]
- Liu WM, Di X, Yang G, et al. Algorithms for large-scale genotyping microarrays. Bioinformatics. 2003;19:2397–2403. doi: 10.1093/bioinformatics/btg332. [DOI] [PubMed] [Google Scholar]
- Wigginton JE, Abecasis GR. PEDSTATS: descriptive statistics, graphics and quality assessment for gene mapping data. Bioinformatics. 2005;21:3445–3447. doi: 10.1093/bioinformatics/bti529. [DOI] [PubMed] [Google Scholar]
- Abecasis GR, Cherny SS, Cookson WO, Cardon LR. Merlin--rapid analysis of dense genetic maps using sparse gene flow trees. Nat Genet. 2002;30:97–101. doi: 10.1038/ng786. [DOI] [PubMed] [Google Scholar]
- Li H, Ruan J, Durbin R. Mapping short DNA sequencing reads and calling variants using mapping quality scores. Genome Res. 2008;18:1851–1858. doi: 10.1101/gr.078212.108. [DOI] [PMC free article] [PubMed] [Google Scholar]
- Chelala C, Khan A, Lemoine NR. SNPnexus: a web database for functional annotation of newly discovered and public domain single nucleotide polymorphisms. Bioinformatics. 2009;25:655–661. doi: 10.1093/bioinformatics/btn653. [DOI] [PMC free article] [PubMed] [Google Scholar]
- Volpi L, Roversi G, Colombo EA, et al. Targeted next-generation sequencing appoints c16orf57 as clericuzio-type poikiloderma with neutropenia gene. Am J Hum Genet. 2010;86:72–76. doi: 10.1016/j.ajhg.2009.11.014. [DOI] [PMC free article] [PubMed] [Google Scholar]
- Hoppman-Chaney N, Peterson LM, Klee EW, Middha S, Courteau LK, Ferber MJ. Evaluation of oligonucleotide sequence capture arrays and comparison of next-generation sequencing platforms for use in molecular diagnostics. Clin Chem. 2010;56:1297–1306. doi: 10.1373/clinchem.2010.145441. [DOI] [PubMed] [Google Scholar]
- Goren A, Ozsolak F, Shoresh N, et al. Chromatin profiling by directly sequencing small quantities of immunoprecipitated DNA. Nat Methods. 2010;7:47–49. doi: 10.1038/nmeth.1404. [DOI] [PMC free article] [PubMed] [Google Scholar]
- Mamanova L, Coffey AJ, Scott CE, et al. Target-enrichment strategies for next-generation sequencing. Nat Methods. 2010;7:111–118. doi: 10.1038/nmeth.1419. [DOI] [PubMed] [Google Scholar]
- Bunge S, Knigge A, Steglich C, et al. Mucopolysaccharidosis type IIIB (Sanfilippo B): identification of 18 novel alpha-N-acetylglucosaminidase gene mutations. J Med Genet. 1999;36:28–31. [PMC free article] [PubMed] [Google Scholar]
- Zhao HG, Aronovich EL, Whitley CB. Genotype-phenotype correspondence in Sanfilippo syndrome type B. Am J Hum Genet. 1998;62:53–63. doi: 10.1086/301682. [DOI] [PMC free article] [PubMed] [Google Scholar]
- Valstar MJ, Bruggenwirth HT, Olmer R, et al. Mucopolysaccharidosis type IIIB may predominantly present with an attenuated clinical phenotype. J Inherit Metab Dis. 2010;33:759–767. doi: 10.1007/s10545-010-9199-y. [DOI] [PMC free article] [PubMed] [Google Scholar]
- Yogalingam G, Hopwood JJ. Molecular genetics of mucopolysaccharidosis type IIIA and IIIB: diagnostic, clinical, and biological implications. Hum Mutat. 2001;18:264–281. doi: 10.1002/humu.1189. [DOI] [PubMed] [Google Scholar]
- Ficko-Blean E, Stubbs KA, Nemirovsky O, Vocadlo DJ, Boraston AB. Structural and mechanistic insight into the basis of mucopolysaccharidosis IIIB. Proc Natl Acad Sci USA. 2008;105:6560–6565. doi: 10.1073/pnas.0711491105. [DOI] [PMC free article] [PubMed] [Google Scholar]
Associated Data
This section collects any data citations, data availability statements, or supplementary materials included in this article.


