Abstract
Noise equivalent counts (NEC) have been used as a measure or proxy of PET image quality for many years. It has been shown to be a useful metric, for example to determine clinical patient dosage. However, NEC should be used cautiously in evaluating image quality since it is a global data quality measure that does not take into account localized effects due to spatial resolution and image reconstruction, as well as the effect of time-of-flight (TOF) imaging on resultant images. In this work, we study the use of a numerical observer that uses a generalized scan-statistic model to estimate lesion detectability with localization in a uniform background phantom, for varying activity levels and scan times. Data were acquired on a clinical whole-body TOF PET scanner. Data show that ALROC increases as a function of NEC but at high activity levels it approaches a peak value earlier than the NEC peak. Also, the ALROC for images acquired with the same NEC, but at two different activity levels and scan times, is similar. Our results show that with TOF information we can either achieve improved clinical performance for heavy patients, or reduce the scan time or injected activity while maintaining similar ALROC value as in a Non-TOF image.
I. Introduction
Over the years significant effort has been exerted in the development of clinical whole-body PET scanners with good spatial resolution and high sensitivity. Good spatial resolution leads to a more accurate estimation of activity uptake in small lesions and higher contrast in the image. The noise present in these images is determined mainly by the number of true, scatter, and random coincidence events collected during the scan time [1, 2]. Since an upper limit on the injected activity in a patient is determined by a combination of radiation dosage to the patient due to injected activity and the scanner count-rate capability, and scan times are limited to reduce patient discomfort and increase scanner throughput, the sensitivity of a PET scanner becomes very important in clinical imaging situations. A solution over the last 15-20 years has been the development of fully-3D PET scanners as a high sensitivity imaging modality [3, 4]. The fully-3D scanners, at the cost of increased scatter and randoms relative to 2D PET, are capable of providing high quality images in short scan times and with low injected activity levels in the patients. Despite the overall improvements in PET image quality due to fully-3D imaging, a significant degradation is observed when moving from small to large patients. This degradation is a result of increased attenuation, as well as a significant increase in the scatter and random coincidences, in heavier patients. Consequently, images for heavy patients suffer from reduced contrast and increased noise characteristics that also degrade lesion detection for oncology studies. The challenge in routine clinical imaging is, therefore, to obtain the best quality images for diagnostic evaluation in the shortest scan time for a wide range of patient sizes.
A simple metric used to define the quality of data collected in a PET scan is the noise equivalent counts (NEC), which for a uniform cylinder is proportional to the square of the resultant signal-to-noise ratio (SNR) in an analytically reconstructed image [5]. Clinical scan protocols have been derived using the NEC metric which typically involve scanning patients at activity levels near the NEC peak value [6, 7]. The patient scan times, on the other hand, are almost universally determined in a semi-empirical way for satisfactory global image quality with shortest scan times to maximize patient throughput. One drawback of the short scan times is that the clinical studies for heavy patients, which are NEC deprived due to increased attenuation, suffer significantly. To obtain images for heavy patients, which in visual quality are comparable to those of light patients, is practically impossible since it involves scan times which can be unacceptably long for patient comfort. In addition, for situations where the injected dose needs to be reduced, long scan durations will be needed even for light patients in order to maintain good image quality. With the re-introduction of time-of-flight (TOF) PET imaging in fully 3D scanners [8-10], it is expected that the differences in image quality for light and heavy patients will be reduced due to the increased TOF benefits for larger patients.
Since the NEC measure represents a global data quality index, it may not represent the best metric with which to optimize scans for best diagnostic capability. In particular, localized effects due to spatial resolution, as well as the impact of iterative reconstruction techniques and system modeling may impact clinical interpretation of images, which is not captured in the NEC measure. In particular, the impact of TOF imaging in fully-3D PET scanners can affect resultant images in ways that are not captured by the NEC. In previous work we have shown through phantom measurements that TOF PET leads to improved lesion detection as well as more accurate quantitation due to faster and more uniform convergence of lesion uptake [8, 11, 12] at a fixed activity level. Our goal in this study is to determine the impact of TOF PET on lesion detection in reconstructed images using a generalized scan statistics method, and as a function of injected activity and scan time. This will help better define the clinical scan protocols that are currently set based upon the scanner NEC rates.
II. Methods
A. Scanner description
All measurements were performed on the Gemini TF PET/CT (Philips Medical Systems, Highland Heights, OH) scanner which is a high performance, TOF capable, fully-3D PET scanner together with a 16-slice Brilliance CT scanner [8]. The PET component of the Gemini TF uses 4 × 4 × 22-mm3 LYSO crystals. The scanner has a ring diameter of 90.34-cm with active transverse and axial FOVs of 576 and 179.8-mm, respectively. The intrinsic performance of this scanner has been described in earlier work [8]. Directly relevant to this work, the scanner has a measured spatial resolution of 4.8-mm near the center and system timing resolution of 590ps at low count-rates.
Previously [8], we have shown that while the spatial resolution of this scanner does not vary significantly over a range of activity levels, there is an impact on the system timing resolution that may affect the gain due to TOF imaging as a function of activity or count-rate. This measurement was performed with a small 22Na point source placed in the center of the scanner and axially centered between two water-filled uniform cylinders filled with decaying 18F activity. The system timing resolution is around 590ps at the lowest singles rate and changes to about 760ps at the highest singles rate of 27 Mcps. The pulse pileup effects that lead to the degradation in timing resolution at high count-rates are a function of the scanner singles rate. The results from the point source measurement are therefore used as a look-up table to obtain the timing resolution for any phantom or patient acquisition, by simply looking up the timing resolution that corresponds to the singles rate for that scan.
B. Data acquisition and analysis
Measurements were performed using a 35-cm diameter by 30-cm long water-filled cylinder. In our experience the 35-cm diameter cylinder approximates a patient with a BMI value similar to a heavy patient [8]. Within this cylinder we placed six spheres in a single plane and at a radial distance of 8-cm from the center of the scanner (Fig. 1). All six spheres had a diameter of 1-cm (outer diameter of 9.86-mm with a wall thickness of 1-mm) and were filled with an 18F activity concentration of 8:1 with respect to the background. For data collection, the plane containing the spheres was placed at ¼ the axial FOV of the scanner from the central plane. To simulate activity outside the FOV, a uniform 20-cm diameter by 30-cm long cylinder was placed axially adjacent to the lesion phantom as well. The activity concentration in this adjacent cylinder was the same as that in the background region of the lesion phantom. List-mode data were acquired for a single bed position at several time points (activity levels) spread over multiple half-lives as the 18F activity in the cylinders decayed from a high value of 7.5-mCi at start of scan. The total scan time at each activity level was 32 minutes. At each time point or activity level, acquired list data were split over eight independent copies (each copy corresponding to a total of 4 minutes scan), leading to 48 lesion copies. Note that in a patient study multiple overlapping bed positions are acquired in increments of half the axial FOV, resulting in the same sensitivity for all axial planes in the FOV. In this study the spheres are located at ¼ the center of scanner axial FOV, therefore a single bed position of data acquisition results in half the sensitivity for events in the plane containing the spheres compared to a multiple bed data acquisition. As result, for a maximum scan time of 4 minutes per data copy, a single bed position corresponds to an equivalent scan time of about 2 minutes per bed position in a clinically relevant multiple bed study.
Fig. 1.
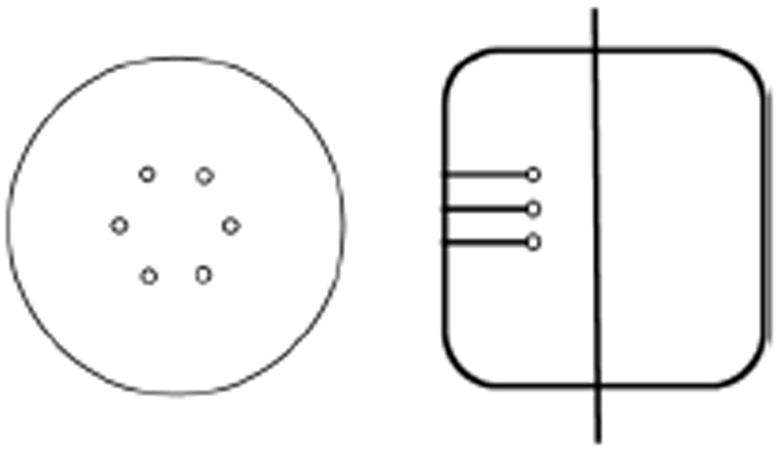
Transverse and axial views of the 35-cm diameter by 30-cm long lesion phantom. The spheres are arranged at a fixed radial position and placed in a plane at ¼ the axial length of the scanner (vertical line in axial view shows schematically the central plane of the scanner).
Data were reconstructed using an iterative ordered subsets expectation maximization (OSEM) algorithm operating in TOF and Non-TOF modes on list-mode data [13] to produce fully corrected images. We used 20 chronologically ordered sub-sets for image reconstruction. Since previous work has shown a change in scanner timing resolution as a function of count-rate [8], appropriate timing resolution values were used at each activity level based upon the singles rate in the scanner. Attenuation correction was performed using the CT image, while scatter estimation was performed using a TOF-extended single scatter simulation (TOF SSS) [14, 15]. Attenuation, detector efficiency/normalization, scatter and random coincidences are incorporated into the system model. Image reconstruction was performed for each 4 minute list data set using all the counts (240s scan time) and half the counts (120s scan time).
C. Generalized scan statistics model
In previous work a theoretical model was developed for scanning an image space to determine the probability distribution function of noise nodules, which can then be used to estimate the localized receiver operating characteristic (LROC) curves for lesion detection [16]. For this work, we applied this technique to the data acquired on the Philips Gemini TF scanner. For image analysis, local contrast value (c) was calculated by using the ratio of mean counts in a circular ROI (diameter 1-cm) and the mean counts in an annulus around the circular ROI (inner diameter of 1.2-cm, outer diameter of 4-cm). The local contrast value was calculated over the 48 lesion copies (eight images and six spheres per image), and the resultant distribution fitted to a Gaussian distribution to estimate the lesion contrast probability distribution function (f(c)). The noise nodule distribution was also estimated by using the image slices which contain the lesions. There are eight such slices corresponding to the eight data copies or images. Within each slice, a contrast value for each background voxel (other than those which contain the lesion) was calculated by centering an ROI (inner diameter of 1.2-cm, outer diameter of 4-cm) over that voxel. The local contrast values for the background voxels are then tabulated in descending order for all c values > 1. Fitting the tail of this background contrast distribution to a Gaussian, and then using the model as described in [16], we estimated the probability density function of the noise nodules (g(c)). In Fig. 2 we show an example of the probability density functions estimated for one of our data sets. Better lesion detection translates into a larger separation, or reduced overlap, between the two curves. The LROC curves and the area under the LROC curve (ALROC) values can then be calculated from first principles as defined in [16]. Briefly, the probability of obtaining a false positive lesion in the background (class o) with contrast greater than some threshold value d, Po(d), is given by the integral of g(c) over all contrast values greater than d. The probability density, h(c), that the scan procedure results in a correct detection and localization of a lesion with a contrast equal to some value c, is the product of the lesion contrast probability distribution function f(c), and the cumulative probability of all noise nodules having a contrast less than c. The probability of correctly detecting (class 1) and localizing (L) a true lesion with contrast greater than some value d, P1L(d), is then given by the integral of h1L(c) over all contrast values greater than d. The LROC curve is then a plot P1L(d) versus Po(d), while the ALROC is just an integral of this curve. For error estimation of the ALROC value, 100 bootstrap samples each of the lesion contrast probability distribution function f(c) and noise nodule contrast probability distribution function g(c) were derived. The error in the ALROC value was determined as the standard deviation of the results over the 100 bootstrap data sets.
Fig. 2.
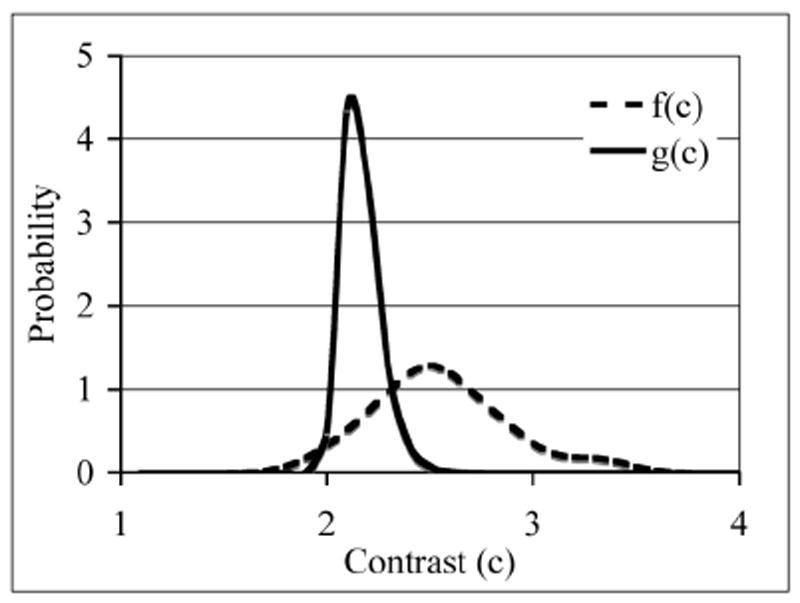
Representative probability distribution functions calculated for the lesion contrast (f(c))) and background noise nodule contrast (g(c))) using the scan statistics model. Better lesion detection translates into a larger separation, or reduced overlap, between the two curves.
III. Results
A. NEC and timing resolution as a function of activity concentration
In Fig. 3 we plot the measured NEC counts as a function of background activity concentration for the two scan times investigated in this work (120s and 240s). For the NEC calculation, random coincidences were estimated from the delayed coincidence window, while the scatter coincidences were derived from the TOF SSS algorithm. The sharp drop in NEC seen at > 0.16 μCi/cc is due to limitations of list-mode data acquisition where long scan times at high activity levels lead to an electronic overflow of the data acquisition system. The overflow problem here occurs at activity levels > 0.16 μCi/cc and a scan time of 32 minutes. As a comparison, typical clinical activity concentration ranges from 0.05 μCi/cc for heavy patients to about 0.10 μCi/cc for lighter patients with a maximum list-mode scan time of 3 minutes per bed position. This leads to collected counts that are more than an order of magnitude less than what we encountered in our experiment, and hence the electronic overflow is not a problem for clinical imaging. For all subsequent image analysis we, therefore, restricted ourselves to a maximum activity concentration of 0.16 μCi/cc in the phantom.
Fig. 3.
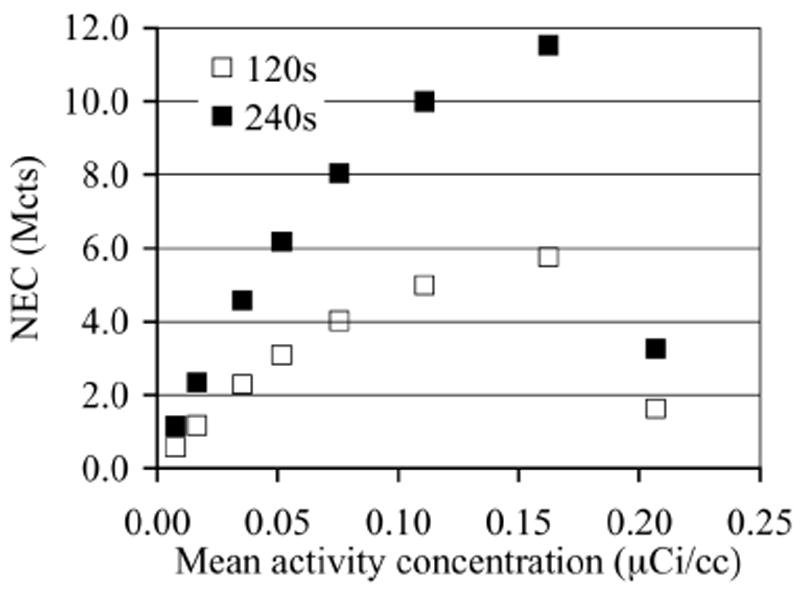
NEC as a function of activity concentration for the phantom study.
In Fig. 4 we plot the timing resolution as a function of activity concentration for the phantom study. This plot is obtained by using the singles rate for each activity concentration in the phantom, together with the look-up table described earlier Section IIA, to estimate the corresponding timing resolution.
Fig. 4.
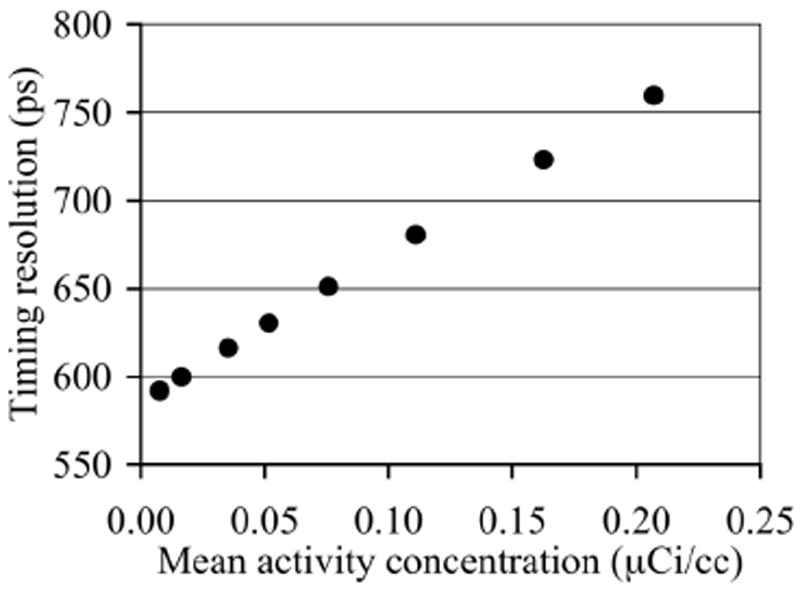
Scanner timing resolution as a function of activity concentration present in the phantom.
B. Reconstructed lesion phantom images
In Fig. 5 we show reconstructed images for data acquired with similar NEC values but different scan times and activity concentration, as well as data where the scan time and NEC are reduced. Images are shown after 10 and 5 iterations of Non-TOF and TOF reconstructions, respectively. This choice was made based on the results shown later in Fig. 6 where close to maximum ALROC results are obtained after the 10th and 5th iterations. The six, 1-cm diameter spheres are not all visible in the Non-TOF reconstructions. As we will see quantitatively in Figs. 7 and 8, images with higher NEC counts have better lesion detection, while images with similar NEC but acquired at two different activity levels look similar. In addition, TOF images have better lesion detection compared to the corresponding Non-TOF image.
Fig. 5.
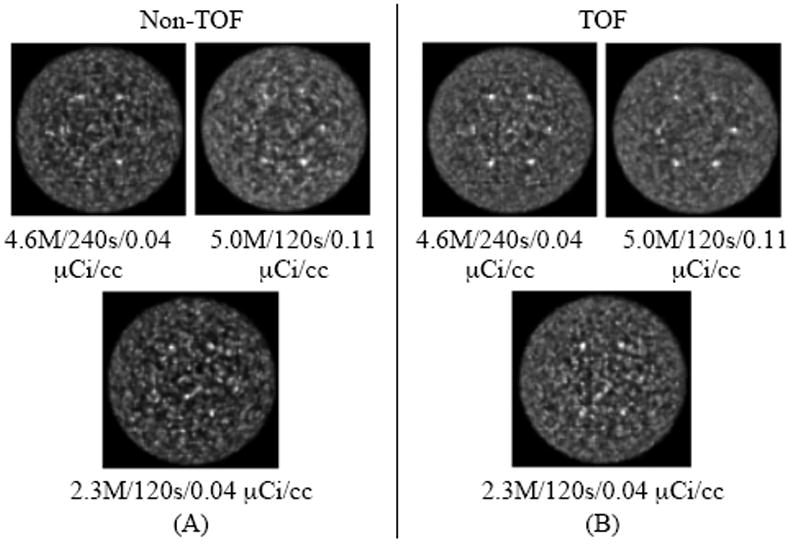
Transverse slices for the reconstructed images of the 35-cm diameter lesion phantom with Non-TOF (A) and TOF (B) image reconstructions. The numbers below each image give the NEC/scan time/activity concentration for the data. The images in the top row are from data acquired with similar NEC values (4.6-5.0 Mcts) but different scan times, while the images in the bottom row are for a lower NEC value (2.3 Mcts). Results are shown after 5 and 10 iterations of reconstruction for TOF and Non-TOF images, respectively.
Fig. 6.
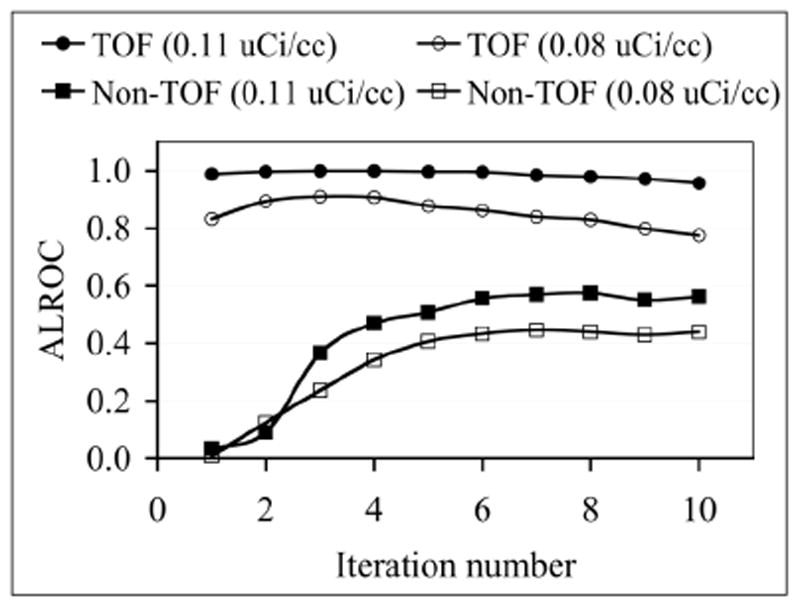
ALROC as a function of number of iterations for TOF and Non-TOF image reconstructions and two activity concentrations. ALROC values are calculated from first principles after using the scan-statistic model.
Fig. 7.
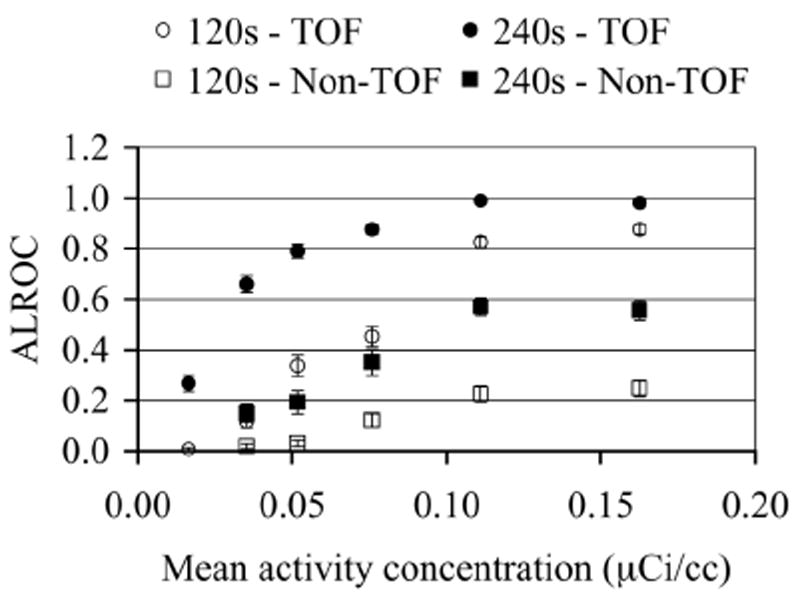
ALROC as a function of activity concentration for TOF and Non-TOF image reconstructions and two scan times. ALROC values are calculated from first principles after using the scan-statistic model. Error bars are equal to one σ value obtained through bootstrapping technique.
Fig. 8.
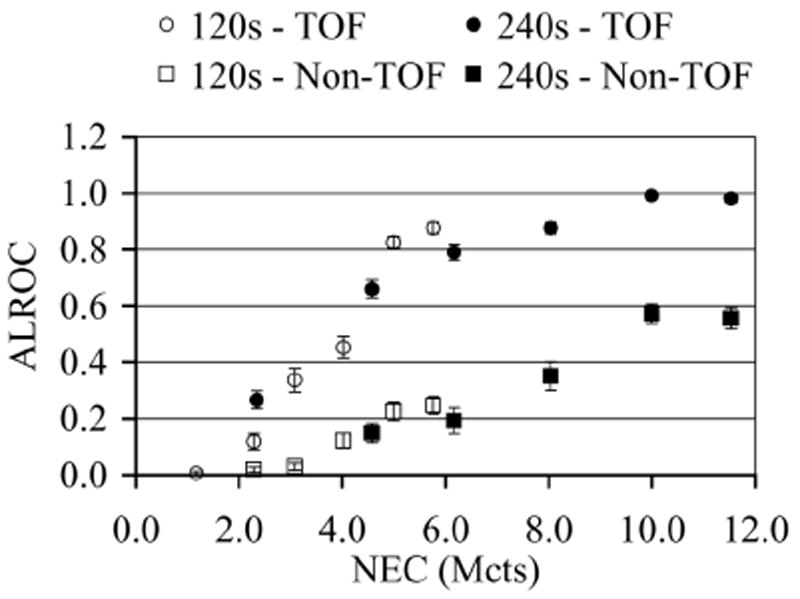
ALROC as a function of NEC for TOF and Non-TOF image reconstructions and two scan times. ALROC values are calculated from first principles after using the scan-statistic model. Error bars are equal to one σ value obtained through bootstrapping technique.
C. Effect of number of iteration on ALROC
As an initial part of our investigation we evaluated the change in ALROC values as a function of the number of iterations of image reconstruction. In Fig. 6 we show ALROC results as a function of number of iterations for TOF and Non-TOF reconstructions for data acquired at two different activity concentrations (0.11 and 0.08 μCi/cc). These results indicate that for TOF reconstruction the ALROC values are fairly constant over all iterations, while for Non-TOF reconstruction the ALROC value reaches close to its maximum and stays at that value after about 6 iterations. Therefore, for all our subsequent analysis we chose to use iteration numbers 5 and 10 for TOF and Non-TOF reconstructions, respectively.
D. Change in ALROC as a function of activity concentration
In Fig. 7 we show the results for the ALROC value as a function of background activity concentration in the phantom. Comparing TOF with Non-TOF results, we see that TOF reconstruction leads to an increase in the ALROC values at all activity concentrations. Also, as expected longer scan times lead to improved performance for both TOF and Non-TOF images. In a 240s scan, both TOF and Non-TOF images achieve close to their highest ALROC values at an activity concentration in the range of 0.11-0.16 μCi/cc. For shorter 120s scan times the rate of increase in the ALROC value near the highest activity concentration studied here (0.16 μCi/cc) is small.
E. Change in ALROC as a function of NEC
In Fig. 8 we plot the ALROC value as a function of data NEC. Comparing the plots for either the two TOF or Non-TOF sets of images, we see that the ALROC value is similar for images acquired at the same NEC value but two different scan times and activity levels. The 240s scan results indicate that at high NEC values (8-12 Mcts) the TOF images are very close to the maximal ALROC value of 1. The Non-TOF images in this NEC range of 8-12 Mcts and 240s scan time are however lower than 1, and there may be a slight indication that they are reaching their highest value. So, while the ALROC values increase with higher NEC, the relationship is not linear at high NEC values. With 120s scan times, the results are not as conclusive primarily due to the fact that the images at the highest NEC value are close to 6 Mcts.
IV. Discussion and Conclusion
In this work we have implemented a generalized scan statistics model to estimate lesion detectability numerically with measured phantom data with and without TOF information. Measurements were performed for lesions with 8:1 uptake relative to the background and the results may not generally apply to lesions with lower uptake ratios. Our results show that, while the ALROC increases with NEC, the relationship is not linear especially at higher NEC values. In particular the ALROC value reaches close to a maximum value in the activity range of 0.11-0.16 μCi/cc with a slow rate of increase. With TOF information, however, a higher maximal ALROC value is achieved in the 0.11-0.16 μCi/cc activity concentration range in our experimental setup with an 8:1 lesion uptake. We also show that the ALROC value is similar for images acquired at the same NEC value but two different scan times and activity levels. For example in Figs. 7 and 8 we see that the ALROC and NEC values are similar for a 240s TOF scan acquired at 0.05 μCi/cc and a 120s TOF scan acquired at 0.16 μCi/cc. The timing resolution at these two activity levels is however 630ps and 725ps (from Fig. 4). These results indicate that timing resolution degradation at high activity concentrations (up to 0.16 μCi/cc) does not significantly affect the lesion detectability in the image.
Typical clinical activity concentration injected in patients for scans on the Gemini TF is 0.05-0.10 μCi/cc. For heavy patients, previous studies have also shown that long Non-TOF scan times may be beneficial for clinical diagnosis. This agrees with the ALROC results in Fig. 7, which show that a scan time of 240s (or higher) and activity concentration of 0.11-0.16 μCi/cc are necessary in order to achieve ALROC values greater than 0.5. With TOF imaging, scan time can be reduced to 120s together with 0.11-0.16 μCi/cc activity concentration and still achieve a high ALROC value (0.8-0.9) for lesions with 8:1 or higher uptake (see Fig. 7). For a typical whole-body patient scan of ten bed positions with 2 minutes per bed position for heavy patients, this translates into a total scan time of 10 minutes as opposed to 20 minutes to achieve high quality diagnostic images. Alternatively, keeping the scan time fixed, we can achieve a significant improvement in the ALROC value over Non-TOF imaging, which may be needed for detection of challenging lesions. Scan protocols which require imaging only one or two bed positions (instead of a full body view) such as when following the progress of radiation treatment in a patient, could benefit with the improved performance of TOF PET together with longer scan duration.
In Fig. 7, we also show that with a 240s TOF scan at activity concentrations in the range of 0.04-0.11 μCi/cc, we can still can still achieve ALROC values that are higher than those achieved with Non-TOF imaging performed at higher activity concentrations. This suggests that TOF imaging can also lead to a reduced injected dose in the patient. In situations where repeat scans are needed, or where PET is used as a disease screening tool, the reduction in injected dose without compromising data quality will be important.
The methodology of using scan statistics as applied to the experimental data acquired in this work provides a fairly simple and useful tool in evaluation of PET images. While human observer studies have not yet been performed to verify the application of this technique in patients, its application to lesion phantoms with uniform backgrounds can be used in the optimization of general scanner imaging protocols. Previously [17] we have also calculated the non-prewhitening matched filter signal-to-noise ratio (NPW SNR) [18, 19] for the data set used in this study. The general conclusions of the two studies are similar. However, the NPW SNR metric is not directly related to the ALROC value and applies only to signal known exactly and background known exactly situations, making the scan statistics a potentially more general evaluation metric. A limitation of the scan statistics technique will be when the lesion is present in a large non-uniform background. However, it may be suitable for use in situations where a lesion is searched for in a small, fairly uniform background region, such as the liver.
Acknowledgments
We would like to thank Mr. Matthew Werner of the University of Pennsylvania for help with the image reconstruction.
This work was supported by the National Institutes of Health under Grant Nos. R33-EB001684 and R01-CA113941.
Contributor Information
Suleman Surti, Department of Radiology, University of Pennsylvania, Philadelphia, PA 19104, USA (telephone: 215-662-7214, surti@mail.med.upenn.edu).
Joel S. Karp, Departments of Radiology and Physics & Astronomy, University of Pennsylvania, Philadelphia, PA 19104, USA (telephone: 215-662-3073, joelkarp@mail.med.upenn.edu).
References
- 1.Surti S, Badawi RD, Holdsworth CH, El Fakhri G, Kinahan PE, Karp JS. A multi-scanner evaluation of PET image quality using phantom studies. presented at 2003 IEEE Nuclear Science Symposium and Medical Imaging Conference; Portland, OR. 2003. [Google Scholar]
- 2.Kinahan PE, Surti S, Badawi RD, El Fakhri G, Karp JS, Lewellen TK. Effect of patient thickness on Noise Equivalent Count rates for 2D and fully-3D whole-body PET imaging. J Nucl Med. 2004;45:102P–103P. [Google Scholar]
- 3.Karp JS, Muehllehner G, Mankoff DA, Ordonez CE, Ollinger JM, Daube-Witherspoon ME, Haigh AT, Beerbohm DJ. Continuous-slice PENN-PET: A positron tomograph with volume imaging capability. J Nucl Med. 1990;31:617–627. [PubMed] [Google Scholar]
- 4.Cherry SR, Dahlbom M, Hoffman EJ. 3D PET using a conventional multislice tomograph without septa. J Comput Assist Tomogr. 1991;15:655–68. doi: 10.1097/00004728-199107000-00023. [DOI] [PubMed] [Google Scholar]
- 5.Strother SC, Casey ME, Hoffman EJ. Measuring PET scanner sensitivity: Relating count rates to image signal-to-noise ratios using noise equivalent counts. IEEE Trans Nucl Sci. 1990;37:783–788. [Google Scholar]
- 6.Lartizien C, Comtat C, Kinahan PE, Ferriera N, Bendriem B, Trebossen R. Optimization of injected dose based on noise equivalent count rates for 2-and 3-dimensional whole-body PET. J Nucl Med. 2002;43:1268–1278. [PubMed] [Google Scholar]
- 7.Watson CC, Casey ME, Bendriem B, Carney JC, Townsend DW, Eberl S, Meikle SR, DiFilippo FP. Optimizing Injected Dose in Clinical PET by Accurately Modeling the Counting-Rate Response Functions Specific to Individual Patient Scans. J Nucl Med. 2005;46:1825–1834. [PubMed] [Google Scholar]
- 8.Surti S, Kuhn A, Werner ME, Perkins AE, Kolthammer J, Karp JS. Performance of Philips Gemini TF PET/CT scanner with special consideration for its time-of-flight imaging capabilities. J Nucl Med. 2007;48:471–480. [PubMed] [Google Scholar]
- 9.Jakoby BW, Bercier Y, Conti M, Casey M, Gremillion T, Hayden C, Bendriem B, Townsend DW. Performance Investigation of a Time-of-Flight PET/CT Scanner. presented at 2008 IEEE Nuclear Science Symposium and Medical Imaging Conference; Dresden, Germany. 2008. [Google Scholar]
- 10.Kemp B, Williams JJ, Ruter R, Lowe V, Mullan B. Performance measurements of a whole-body PET/CT system with time-of-fight capability. presented at Annual Meeting of the Society of Nuclear Medicine; Toronto, Canada. 2009. [Google Scholar]
- 11.Karp JS, Surti S, Daube-Witherspoon ME, Muehllehner G. Benefit of Time-of-Flight in PET: Experimental and Clinical Results. J Nucl Med. 2008;49:462–470. doi: 10.2967/jnumed.107.044834. [DOI] [PMC free article] [PubMed] [Google Scholar]
- 12.Surti S, Karp JS. Experimental evaluation of a simple lesion detection task with time-of-flight PET. Phys Med Biol. 2009;54:373–384. doi: 10.1088/0031-9155/54/2/013. [DOI] [PMC free article] [PubMed] [Google Scholar]
- 13.Popescu LM. Iterative image reconstruction using geometrically ordered subsets with list-mode data. presented at 2004 IEEE Nuclear Science Symposium and Medical Imaging Conference; Rome, Italy. 2004. [Google Scholar]
- 14.Watson CC. Extension of Single Scatter Simulation to Scatter Correction of Time-of-Flight PET. IEEE Trans Nucl Sci. 2007;54:1679–1686. [Google Scholar]
- 15.Werner ME, Surti S, Karp JS. Implementation and Evaluation of a 3D PET Single Scatter Simulation with TOF Modeling. presented at 2006 IEEE Nuclear Science Symposium and Medical Imaging Conference; San Diego, CA. 2006. [Google Scholar]
- 16.Popescu LM, Lewitt RM. Small nodule detectability evaluation using a generalized scan-statistic model. Phys Med Biol. 2006;51:6225–6244. doi: 10.1088/0031-9155/51/23/020. [DOI] [PubMed] [Google Scholar]
- 17.Surti S, El Fakhri G, Karp JS. Optimizing Acquisition Parameters in TOF PET Scanners. presented at 2006 IEEE Nuclear Science Symposium and Medical Imaging Conference; San Diego, CA. 2006. [Google Scholar]
- 18.Myers KJ, Barrett HH. Addition of a channel mechanism to the ideal-observer model. J Opt Soc Am A. 1987;4:2447. doi: 10.1364/josaa.4.002447. [DOI] [PubMed] [Google Scholar]
- 19.Myers KJ, Barrett HH, Borgstrom MC, Patton DD, Seeley GW. Effect of noise correlation on detectability of disk signals in medical imaging. J Opt Soc Am A. 1985;2:1752. doi: 10.1364/josaa.2.001752. [DOI] [PubMed] [Google Scholar]


