

Abstract
Electrospray ionization mass spectrometry (ESI MS) is a versatile analytical technique in glycomics of glycosaminoglycans (GAGs). Combined with enzymology, ESI MS is used for assessing changes in disaccharide composition of GAGs biosynthesized under different environmental or physiological conditions. ESI coupled with high-resolution mass analyzers such as a Fourier transform mass spectrometer (FTMS) permits accurate mass measurement of large oligosaccharides and intact GAGs as well as structural characterization of GAG oligosaccharides using information-rich fragmentation methods such as electron detachment dissociation. The first part of this chapter describes methods for disaccharide compositional profiling using ESI MS and the second part is dedicated to FTMS and tandem MS methods of GAG compositional and structural analysis.
1. Overview
Electrospray ionization (ESI) is a soft ionization method and is most suitable for mass spectrometric (MS) analysis of glycosaminoglycans (GAGs) (Bielik and Zaia, 2010; Zaia, 2005, 2008, 2009). The spray conditions can be modified to suppress the loss of sulfo groups and enhance the abundance of a certain types of ions, such as, for example, sodium cationized or protonated species and ions with specific charge states (Zaia, 2005). Compatibility of ESI with liquid chromatographic (LC) separation is another advantage of this ionization method for GAG analysis. There are 17 different structures of GAG-derived 4,5-unsaturated disaccharides but only 8 unique masses; therefore, an LC separation step is required to distinguish the isomers. The sensitivity of ESI MS applications in glycomics of GAGs is superior to other methods of ionization and is continuously improving (Flangea et al., 2009; Staples et al., 2009, 2010; Zamfir et al., 2004, 2009). Modern ESI sources with spray emitter diameters on the order of μm support nL/min flow rates (nano-ESI), resulting in very fine sprays and softer, more efficient desolvation conditions, which in turn leads to an order of magnitude enhancement in the analytical sensitivity (Zaia, 2008, 2009). Due to their acidity, GAG oligosaccharides are usually analyzed by ESI MS in the negative ionization mode. However, under certain experimental conditions, GAG oligosaccharides can be detected as positive ions with comparable or even greater sensitivity (Gunay et al., 2003).
ESI MS in GAG analysis can be divided into two broad categories: the disaccharide composition analysis and the larger oligosaccharide and polysaccharide analysis. The two categories provide complementary information and aid in elucidation of structure–function relationship of GAGs. This chapter describes the ESI MS methods for chondroitin sulfate/dermatan sulfate (CS/DS) and heparan sulfate (HS) disaccharide composition analysis using ion-pairing reverse-phase (IP RP) LC as the separation method. In our laboratory, the methods here described of disaccharide composition profiling are routinely used in determining the effects of different stimuli on GAG expression in various cells, tissues, and small organisms (Nairn et al., 2007; Sinnis et al., 2007; Warda et al., 2006; Zhang et al., 2009a,b).
While the disaccharide compositional profiling is robust and well-established approach to GAG analysis, ESI MS analysis of intact GAGs and large oligosaccharides requires high resolving power of the Fourier transform mass spectrometry (FTMS). The challenges in the MS analysis of intact GAGs arise from physicochemical properties of these biopolymers. GAG component of a single PG is a polydisperse, structurally heterogeneous mixture of chains having different sulfation patterns and associated with innumerable combinations of cations through electrostatic interactions in a physiological solution. Thus, the success of an ESI FTMS analysis of intact GAGs depends on the spray solution conditions (pH and ion composition) and on purity of the GAG sample. This chapter describes two methods for analyzing intact GAG component of a PG bikunin over a narrow molecular weight (MW) range. First method uses continuous-elution polyacrylamide gel electrophoresis (CE PAGE) for separation of bikunin GAG prior to the ESI FTMS analysis. In the second method, the GAGs are ionized as a mixture, and a quadrupole mass filter is used in a manner of sliding window to allow a narrow m/z “band” of ions reach the Fourier Transform Ion Cyclotron Resonance (FT-ICR) mass analyzer (Chi et al., 2008). The advantages of the latter method are its speed and the low analyte requirement: the MW and composition of the bikunin GAG was determined in a matter of hours using less than 10 μg of the GAG mixture. However, only five chain lengths with two different sulfation states were identified, representing a small fraction of the bikunin GAG ensemble. The former method requires a significant amount of the analyte (≥ 300 μg) and is composition time-consuming, but it permits the MW and analysis over entire MW distribution of bikunin GAG. In addition, the isolated GAG fractions are amenable for tion, further characterization, for example, disaccharide or oligosaccharide compositional and structural analysis.
A single-stage high-resolution MS analysis provides information about the oligosaccharide composition, whereas a tandem MS analysis allows for the determination of the type and position of each structural element in the oligosaccharide (Saad and Leary, 2005; Tissot et al., 2008; Wolff et al., 2008a; Zamfir et al., 2002, 2003, 2004, 2009). During a tandem MS experiment, a selected ion, that is, precursor ion is activated to induce its fragmentation. The resulting fragment ions provide information about the number and positions of O-sulfo, N-sulfo, and N-acetyl groups and in some cases help to distinguish the C-5 epimers of uronic acid (Wolff et al., 2007b). The convention for the oligosaccharide fragment ion assignment follows the Domon and Costello nomenclature (Fig. 3.1).
Figure 3.1.

The Domon-Costello nomenclature for naming hexose fragments. Glycosidic cleavages are denoted with B or C if they contain the nonreducing end (NRE), and Y or Z if they contain the reducing end (RE). Cross-ring cleavages are denoted by A or X with A containing the NRE and X containing the RE. Cross-ring superscripts indicate the cleaved bonds and subscripts indicated the position along the oligosaccharide. Complementary cleavage subscripts add up to the length of the oligosaccharide, for example, B3 + Y1 indicate a tetrasaccharide.
For tandem mass analysis, precursor ion activation can be categorized as a threshold or electron-based method. The threshold activation methods, including collision-induced dissociation (CID) and infrared multiphoton dissociation (IRMPD) (Zimmerman et al., 1991), typically cleave the most labile bond in sulfated GAGs, the sulfate half-ester (Zaia, 2005). Selection of a precursor ion in which sulfo groups are ionized or paired with a metal cation minimizes the loss of SO3 (Wolff et al., 2008b; Zaia and Costello, 2003). Recently, electron detachment dissociation (EDD) (Budnik et al., 2001) has been applied in the structural characterization of sulfated GAGs. Compared to the threshold activation methods, EDD results in more abundant cross-ring fragmentation (Wolff et al., 2007a). During this ion activation method, a multiply charged anion is irradiated with electrons of moderate kinetic energy (~19 eV) resulting in the formation of an excited state intermediate. The intermediate then undergoes fragmentation due to electron detachment or electronic excitation (i.e., electron-induced dissociation, EID) (Fig. 3.2). The experimental conditions for high-resolution tandem MS characterization of GAG oligosaccharides are described later in this chapter.
Figure 3.2.
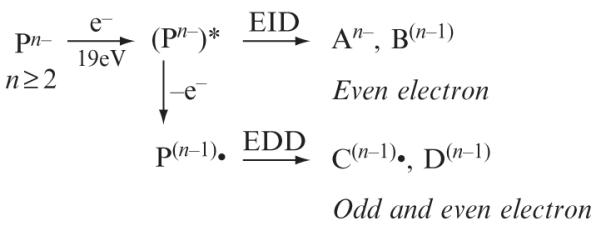
A scheme of electron-based activation of multiply charged anions during the EDD experiment.
2. Preparation of Crude PG/GAG
Procedures for extraction of proteoglycans (PGs) and GAGs from tissues, cells, or whole organisms vary depending on a type of biological sample and are described in great detail in recent literature (Guimond et al., 2009; Iozzo, 2001). A workflow for preparation of crude PG/GAG sample includes (1) tissue or cell homogenization or disruption in a small volume of a neutral pH buffer; (2) PG extraction in a buffered 4 M guanidinium chloride solution containing 0.5–2% CHAPS; (3) buffer exchange to 8 M urea containing 0.5–2% CHAPS; and (4) anion exchange chromatographic enrichment of PGs. If the protein component, including PG core protein, of the tissue or cell sample has to be identified by proteomics methods, protease inhibitors are added to the homogenization and extraction buffers to prevent nonspecific proteolysis. The 4 M guanidinium chloride buffer must be exchanged to a 6–8 M urea buffer containing 0.5–2% CHAPS because guanidinium chloride is incompatible with the ion exchange separation. PGs bound to the anion-exchange medium are washed with the urea/CHAPS buffer, followed by a low-salt buffer, such as 0.15 M sodium chloride to remove contaminants associated with PGs through electrostatic interactions. The PGs are released from the anion-exchange medium with an increasing salt gradient or with a high-salt buffer, and the resulting crude PG fraction is desalted for subsequent enzymatic treatment and analysis. To further enrich and purify the GAG, peptidoglycans (pGs) are obtained from the crude PGfraction by the digestion with DNAse followed by a nonspecific proteolysis and the pGs are purified from the mixture in the second anion-exchange step. The desalted pG fraction is subjected to further treatment with specific GAG lyases to identify the GAGs in the sample and determine their disaccharide composition. Alternatively, GAGs are released from the protein/peptide core of PGs/pGs by β-elimination under reducing conditions prior to the lyase treatment.
3. Disaccharide Profiling Using Ion-Pairing Reverse-Phase (IP RP) HPLC with MS Detection
Disaccharide compositional analysis affords information about the types of disaccharides present in each sample and their relative or absolute amounts and relies on the well-characterized disaccharide standards. It is worth noting that the ion pairing alkyl amines persist in the LC–MS system and their use is best confined to a dedicated instrument.
4. CS/DS Disaccharide Preparation
4.1. Materials and solutions for CS/DS disaccharide preparation
Chondroitin ABC lyase (EC 4.2.2.4) from Proteus vulgaris (Seikagaku, Japan; or Associates of Cape Cod, East Falmouth, MA); 10 mU/ 1 mg of CS (Linhardt, 2001).
A controlled temperature bath or dry block.
Centrifuge capable of achieving 13,000 × g.
Digestion buffer (optional): 5 mM Tris, 6 mM sodium acetate buffer, pH 8 (adjusted with HCl). Distilled water can be used instead of the buffer for the digestion, especially for low amounts of CS, to avoid buffer salt interference during the LC separation.
Centrifugal filter with a 30,000 MWCO membrane (e.g., Millipore Ultracel YM-30, cat. # 42410).
4.2. Method for CS/DS disaccharide preparation
Purified, desalted PG or pG sample is reconstituted in distilled water or in the digestion buffer; and an aliquot of solution containing an appropriate amount of the chondroitin ABC lyase (approximately 10 mU/mg substrate) is added to the sample.
The digestion is allowed to proceed overnight at 37 °C, after which the lyase is inactivated by heating the digestion for 5 min in a boiling water bath.
The disaccharides are separated from the enzyme and the non-CS polysaccharides using a centrifugal filter with 30K MWCO membrane.
The centrifugal filter flow-through containing the CS disaccharides is directly amenable for LC–MS analysis. However, if the sample volume is significantly greater than the volume necessary for the LC–MS analysis (>20 μL), the volume can be reduced by lyophilizing.
5. ESI IP RP LC MS Analysis of CS/DS Disaccharides
5.1. Materials for CS/DS disaccharide analysis
- CS/DS 4,5-unsaturated disaccharide standards (Fig. 3.3) are available from Seikagaku (Associates of Cape Cod, East Falmouth, MA) and from Iduron, Manchester, UK.
- ΔUA-GalNAc
- ΔUA-GalNAc4Sl
- ΔUA-GalNAc6S
- ΔUA2S-GalNAc
- ΔUA2S-GalNAc4S
- ΔUA2S-GalNAc6S
- ΔUA-GalNAc4S6S
- ΔUA2S-GalNAc4S6S
Ion-pairing reagent, n-hexylamine (HXA, Sigma, St. Louis, MO).
Organic modifier, 1,1,1,3,3,3-hexafluoroisopropanol (HFIP, Sigma, St. Louis, MO).
Acquity UPLC bridged ethyl hybrid (BEH) C18 column, 2.1 × 150 mm, 1.7 μm and Acquity BEH C18 VanGuard pre-column, 2.1 × 5mm, 1.7 μm (Waters). The use of silica-supported C18 column packing is not recommended for this method because of a limited compatibility of the silica packing with basic mobile phases (pH > 8) at elevated temperatures.
0.2 μm membrane filters for mobile phase filtration (Millipore prod. # JGWP04700 or similar).
Glass vials, small volume inserts, and screw caps with silicone/PTFE septa for Agilent 1200 autosampler (MicroSolv, Eatontown, NJ; cat. # 9502S-0CV, 95001-04N, and 9502S-10C-B).
Access to an LC–MS instrument equipped with a UV detector and column heater and capable of supporting 100 μL/min flow rate (Agilent 1100 LC–MSD with ion trap mass analyzer and diode array UV detector is used in our laboratory).
Figure 3.3.

Structures, monoisotopic masses, and observed m/z of eight CS/DS disaccharide standards.
5.2. Solutions for CS/DS disaccharide analysis
Mobile phase A: 15 mM HXA, 100 mM HFIP in HPLC-grade water.
Mobile phase B: 15 mM HXA, 100 mM HFIP, 75% acetonitrile in HPLC-grade water.
CS/DS disaccharide standard mixture in HPLC-grade water, 2 μL per injection, containing 10 ng of each disaccharide standard (40 ng/μL total disaccharide concentration).
CS/DS digest: >20 ng disaccharides in >5 μL of digestion buffer or HPLC-grade water. Injection volume of 5 μL requires a >5 μL sample volume to avoid introducing air into the column. The requirement for the additional sample volume depends on the autosampler needle off-set and the shape of the vial insert.
5.3. Method for CS/DS disaccharide analysis
Mobile phase solutions are filtered through 0.2 μm filters. Due to their small particle size, UPLC columns are easily blocked by particulates in the mobile phase.
The column temperature is set to 45 °C, and the column is allowed to equilibrate with 100% A at 100 μL/min.
The UV detector is set to record absorbance at 232 nm.
An LC method consisting of a 10-min isocratic segment of 0% B, and a linear gradient segment of 0–50% B over 10–40 min is created.
The sample injection volume is set at 5 μL(2 μL for the standards mixture). If a series of disaccharide samples are through autosampler, an introduced an appropriate injection sequence is created including 1 injection of the standards for every 8–10 sample injections to monitor the MS detection sensitivity.
MS parameters are set as follows: positive ionization mode, skimmer 40 V, capillary exit 40 V, source temperature 350 °C, drying gas (N2) 8 L/min, nebulizing gas (N2) 40 psi.
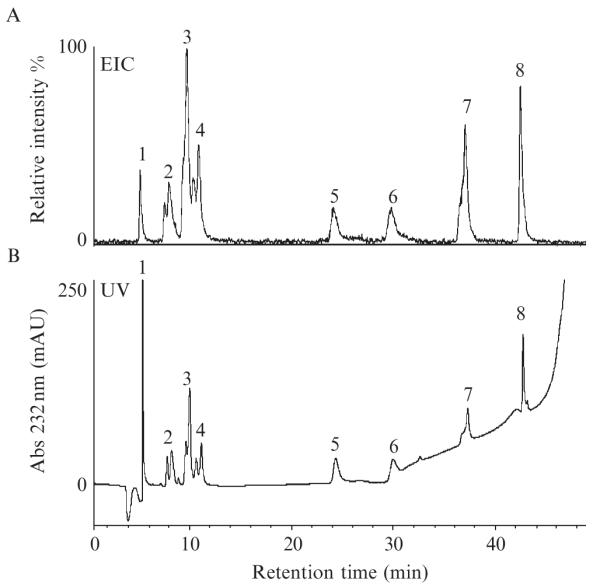
An example of a data set obtained during CS/DS disaccharide analysis is shown in Figs. 3.4 and 3.5. Under the experimental conditions described here, the disaccharides elute in order of increasing number of sulfo groups (Fig. 3.3). The total ion chromatogram (TIC) is a plot of total ion signal as a function of time (Fig. 3.4A). The extracted ion chromatogram (EIC) is a plot of selected ion’s signal as a function of time, and in Fig. 3.4B, the ion signals at m/z 481, 662, 843, and 1024 are extracted from the TIC. The TIC, the EIC, or the UV absorbance chromatogram can be used for constructing the disaccharide compositional profile of a sample in which peak area of an individual disaccharide is a percentage of the sum of peak areas for all detected disaccharides (S/N > 3).
Figure 3.4.

Elution profiles of CS/DS disaccharides separated by IP RP HPLC: (A) total ion chromatogram, (B) extracted ion chromatogram for m/z 481, 662, 843, and 1024, and (C) absorbance trace at 232 nm.
Figure 3.5.

Positive-ion ESI mass spectra of CS/DS disaccharides: (A) unsulfated disaccharide, (B) monosulfated disaccharide, (C) disulfated disaccharide, and (D) trisulfated disaccharide. Characteristic loss of 79 mass units can be attributed to HXA/Na exchange, (−101 + 22).
In the positive-ion mass spectra, major peaks are singly charged and correspond to the HXA adducts of disaccharides with one HXA per acidic site in the disaccharide (Fig. 3.5). Minor peaks represent various Na/H/HXA exchange products. Saccharide mass spectra acquired under the described experimental conditions exhibit a characteristic pattern of peaks separated by 79 mass units which can be attributed to the HXA/Na exchange. The pattern can be used as an aid in assigning unusual saccharide peaks, for example, trisaccharides.
Absolute quantification is best achieved by constructing a standard curve based on several dilutions of the disaccharide standards and using the resulting linear relationship for calculating the amounts of disaccharides in the sample. Our instrument affords good linearity in both UV absorbance and MS signal intensity (R2 ≥ 0.97) with standard mixtures containing 20–100 μg/mL total CS/DS disaccharides.
6. HS Disaccharide Preparation
6.1. Materials and solutions for HS disaccharide preparation
1. Heparin lyase I (EC 4.2.2.7) from Flavobacterium heparinum, heparin lyase II (no EC number) from F. heparinum, and heparin lyase III (EC 4.2.2.8) from F. heparinum can be obtained from Seikagaku, Japan (Associates of Cape Cod, East Falmouth, MA). A 4-mU amount of each heparin lyase (12 mU total) is sufficient to depolymerize 1 mg of HS (Linhardt, 2001).
A controlled temperature bath or dry block.
Centrifuge capable of achieving 13,000 × g.
Digestion buffer (optional): 10 mM sodium phosphate buffer, pH 7.4 (adjusted with phosphoric acid). Distilled water can be used instead of the buffer for the digestion, especially for low amounts of HS, to avoid buffer salt interference during the LC separation.
Centrifugal filter with a 30,000 MWCO membrane (e.g., Millipore Ultracel YM-30, cat. # 42410).
6.2. Method for HS disaccharide preparation
Purified, desalted PG or pG sample is reconstituted in distilled water or the digestion buffer; and an aliquot of solution containing an appropriate amount of the heparin lyases I, II, and III (approximately 12 mU/mg substrate) is added to the sample.
The digestion is allowed to proceed overnight at 35 °C, after which the lyases are inactivated by heating the digestion for 5 min in a boiling water bath.
The disaccharides are separated from the enzymes and the non-HS polysaccharides using a centrifugal filter with 30,000 MWCO membrane.
The centrifugal filter flow-through containing the HS disaccharides is directly amenable for LC–MS analysis. However, if the sample volume is significantly greater than the volume necessary for the LC–MS analysis (>8 μL), the volume can be reduced by lyophilizing.
7. ESI IP RP LC MS Analysis of HS Disaccharides
7.1. Materials for HS disaccharide analysis
- HS 4,5-unsaturated disaccharide standards (Fig. 3.6) are available from Seikagaku, Japan (Associates of Cape Cod, East Falmouth, MA) and from Iduron, Manchester, UK.
- ΔUA-GlcNAc
- ΔUA-GlcNS
- ΔUA-GlcNAc6S
- ΔUA2S-GlcNAc
- ΔUA2S-GlcNS
- ΔUA-GlcNS6S
- ΔUA2S-GlcNAc6S
- ΔUA2S-GlcNS6S
Ion-pairing reagent, tributylamine (TrBA).
Ammonium acetate(NH4OAc).
Acetic acid for adjusting pH.
Zorbax SB-C18 column (Agilent Technologies), 0.5 × 250 mm, 5 μm. The recommended pH range for this column is 1–8.
A syringe pump, such as Harvard Apparatus Pump 11 Pico Plus or similar, and a 1-mL glass syringe (e.g., 1-mL, blunt tip, precision glass syringe, National Scientific product # NS600001) for delivering 5 μL/min postcolumn flow of acetonitrile. We have found that the addition of acetonitrile aids in solvent evaporation and analyte ionization, dramatically improving the quality of the resulting mass spectra.
0.2 μm membrane filters for mobile phase filtration (Millipore prod. # JGWP04700 or similar).
Glass vials, small volume inserts, and screw caps with silicone/PTFE septa for Agilent 1200 autosampler (MicroSolv, Eatontown, NJ; cat. # 9502S-0CV, 95001-04N, and 9502S-10C-B).
Access to an LC–MS instrument equipped with a UV detector and capable of supporting 10 μL/min flow rate (An Agilent 1100 LC–MSD with ion trap mass analyzer and diode array UV detector is used in our laboratory).
Figure 3.6.

Structures, monoisotopic masses, and observed m/z of eight HS disaccharide standards.
7.2. Solutions for HS disaccharide analysis
Mobile phase C: 12 mM TrBA, 38 mM NH4OAc, 15% acetonitrile in HPLC-grade water, pH 6.5 adjusted with acetic acid.
Mobile phase D: 12 mM TrBA, 38 mM NH4OAc, 65% acetonitrile in HPLC-grade water, pH 6.5 adjusted with acetic acid.
HS disaccharide standard mixture, 2 μL containing 50 ng of each disaccharide standard in HPLC-grade water (200 ng/μL total disaccharide concentration). The sensitivity of the HS disaccharide analysis is lower than that of the CS/DS disaccharides.
HS digest: ≥40 ng disaccharides in >2 μL of digestion buffer or HPLC-grade water. Injection volume of 2 μL requires a >2 μL sample volume to avoid introducing air into the column. The requirement for the additional sample volume depends on the autosampler needle off-set and the shape of the vial insert. Lower than 40 ng amounts of HS disaccharides can be detected, but may result in a noisy UV baseline.
7.3. Method for HS disaccharide analysis
Mobile phase solutions are filtered through the 0.2 μm filters.
The column is allowed to equilibrate with 100% C at 10 μL/min at room temperature.
The UV detector is set to record absorbance at 232 nm.
A two-segment LC gradient is programmed as follows: 0% D, 0–20 min; 0–50% D, 20–25 min.
The 1-mL Hamilton syringe is filled with acetonitrile, connected to the postcolumn part of the LC system through a T-connector, positioned in the syringe pump, and the pump flow rate is set to 5 μL/min.
The sample injection volume is set to 2 μL. If a series of disaccharide samples are introduced through an autosampler, an appropriate injection sequence must be created which includes a standard disaccharide mixture injection after every 8–10 sample injections to periodically monitor the MS detection sensitivity.
MS parameters are set as follows: negative ionization mode, skimmer 40 V, capillary exit 40 V, source temperature 325 °C, drying gas (N2) 5 L/min, nebulizing gas (N2) 20 psi.
The data obtained during HS disaccharide analysis in the negative ion mode is straightforward to interpret because the disaccharides appear as [M–H]− ions (Fig. 3.6). An example of elution profile of HS disaccharide standards is shown in Fig. 3.7. The EIC was plotted based on ion signals at m/z 378, 416, 458, 496, 538, and 576. The TIC recorded using 50 ng of each HS disaccharide standard (400 ng total amount) exhibits S/N < 3 (not shown) and therefore is not usable for the relative quantification analysis. The EIC or the UV absorbance chromatogram can be used for constructing the disaccharide compositional profile of the sample as well as for absolute quantification, provided that a linear relationship between a disaccharide signal and its amount is established using the appropriate standards.
Figure 3.7.
Elution profiles of HS disaccharides separated by IP RP HPLC: (A) Extracted negative-ion chromatogram for m/z 378, 416, 458, 496, 538, and 576, and (B) absorbance trace at 232 nm.
8. Direct Infusion ESI FTMS Analysis of Oligosaccharides and Polysaccharides Separated by Preparative Continuous-Elution PAGE
High resolving power and mass accuracy of FTMS are necessary for the molecularweight analysisof GAG polysaccharidesand large oligosaccharidesdue to the formation of multiply charged ions in ESI of these polyanions. As is true for any type of analyte, the sample for MS analysis must be of highest possible purity and homogeneity to obtain a good quality mass spectrum. This requirement is especially important for the GAGs since they produce low ion yields, have a high propensity to form adducts with cations present in solution, and usually exhibit more than one charge state in the ESI mass spectra. Separation of highly polydisperse GAG mixtures can be achieved off-line using preparative PAGE; and the resulting components can be purified from buffer salts and analyzed by ESI FTMS. This method has proven useful in our laboratory for the preparation of heparin oligosaccharide MW markers (Laremore et al., 2010) and heparosan (K5 polysaccharide) MW markers (Ly et al., 2010) as well as in the MW analysis of the proteoglycan bikunin GAG chains. Urinary bikunin is a 16 kDa PG modified with a 5–7 kDa GAG chain on Ser10 and a 2 kDa N-glycanonAsn45 (Chi et al., 2008; Enghild et al., 1999). Bikunin GAG is a CS-A type polysaccharide comprised by GlcA-GalNAc4S and GlcA-GalNAc0S disaccharides (Capon et al., 2003; Enghild et al., 1991, 1999; Fries and Kaczmarczyk, 2003).
A method described here is used in our laboratory for MW analysis of intact GAG released from the urinary bikunin PG by β-elimination under reducing conditions. The analytical workflow consists of (1) separation of the GAG mixture using preparative CE PAGE, (2) analysis of gel-eluted fractions by analytical PAGE, and (3) purification and ESI FTMS MW analysis of fractions of interest.
9. Preparation of Bikunin GAG
9.1. Materials and solutions for GAG release by β-elimination under reducing conditions
Bikunin proteoglycan, 1 mg (Mochida Pharmaceuticals, Tokyo, Japan). To obtain a sufficient amount of each purified GAG fraction for the ESI FTMS analysis, ca. 300 μg GAG mixture is required for CE PAGE separation. Since the GAG is approximately 30% of the bikunin PG mass, the use of such large quantity of the PG as 1 mg is justified.
Amicon Ultra 10,000 MWCO centrifugal filter for volumes <500 μL (Millipore cat. # UFC5010BK).
Narrow range pH paper (colorpHast nonbleeding pH-indicator strips, pH 4.0–7.0, EMD cat. # 9582).
Strong-anion exchange (SAX) spin column for volumes <400 μL, high capacity (VivaPure Q Mini-H, Sartorius Stedim, part # VS-IX01QH24).
A microcentrifuge that can achieve 500 × g and 13,000 × g relative centrifugal force (rcf).
0.5 M sodium hydroxide (NaOH) containing 0.5 M sodium borohydride (NaBH4) for the β-elimination reaction under reducing conditions.
Glacial acetic acid.
Anion exchange loading solution: 50 mM sodium chloride in distilled water.
Anion exchange elution solution: 1.5 M sodium chloride in distilled water.
9.2. Method for GAG release by β-elimination under reducing conditions
The lyophilized PG is dissolved in the 0.5 M NaOH, 0.5 M NaBH4 solution in a 20-mL glass vial and the β-elimination reaction is allowed to proceed for 15–18 h at 4 °C. Bikunin PG is soluble at a concentration of 10 mg/mL, thus it is advisable to keep the reaction volume low for subsequent work-up.
The reaction mixture is neutralized by adding 5-μL aliquots of glacial acetic acid until pH of the solution is between 5.5 and 7.5. The addition of acid to a borohydride solution generates hydrogen gas, resulting in extensive foaming. Using the wide 20-mL vial, adding acetic acid in small aliquots, and gentle swirling of the reaction after each addition will prevent overflow of the mixture.
The β-elimination reaction products are desalted using a 10,000 MWCO centrifugal filter by centrifugation of three 400-μL volumes of distilled water at 13,000 × g.
The desalted β-elimination reaction products, 20–50 μL in the centrifugal filter, are diluted with the anion-exchange loading solution to 400 μL. (Once the sample is transferred out, the filter can be rinsed with water, kept hydrated, and reused for desalting the GAG after the anion-exchange step.)
An SAX spin column is conditioned by centrifugation of 400 μL loading solution at 500 × g for 5 min. If the solution does not pass completely through the SAX packing in 5 min, the time of centrifugation can be increased keeping the same rcf setting.
The β-elimination reaction products are loaded onto the conditioned SAX spin column by centrifugation at 500 × g for 5 min.
The bound GAG is washed with 400 μL loading solution twice by centrifugation for 5 min at 500 × g.
Purified GAG is eluted with two 100-μL aliquots of the 1.5 M NaCl elution solution. The flow-through is collected and desalted using the 10,000 MWCO centrifugal filter as described above. The desalted GAG sample (20–50 μL) can be stored at −20 °C until the analysis.
9.3. Materials and solutions for preparative CE PAGE separation of the bikunin GAG chains
Mini-Prep electrophoresis cell (Bio-Rad cat. # 170-2908) with a power source (Bio-Rad PowerPac Universal Power Supply, cat. # 164-5070).
Gel-casting equipment for mini-gels: casting frames, casting stand, glass plates with 0.75 mm spacers, short glass plates, combs for 15 wells.
Mini-gel electrophoresis cell (Mini-PROTEAN Tetra Cell, Bio-Rad cat. # 165-8000).
Peristaltic pump capable of supporting the 80 μL/min flow rate (Bio-Rad Model EP-1 Econo Pump, cat. # 731-8140).
Fraction collector (Bio-Rad Model 2110 Fraction Collector, cat. # 731-8120).
Glass culture tubes for collecting fractions (13 × 100 mm, Fisher Scientific)
A vacuum pump for degassing the gel monomer solutions.
Molecular weight markers (e.g., oligosaccharide ladder).
Electrode running buffer: 1 M glycine, 0.2 M Tris, pH 8.3 (achieved by dissolution). Mini-Prep electrophoresis cell requires 100 mL electrode running buffer.
Resolving gel buffer (lower chamber buffer and elution buffer): 0.1 M boric acid, 0.1 M Tris, 0.01 M disodium EDTA, pH 8.3 (achieved by dissolution). Mini-Prep electrophoresis cell requires 400 mL lower chamber buffer and 60–100 mL elution buffer. An additional volume of resolving gel buffer is required for soaking the elution frit and dialysis membrane and for purging the lines during the cell assembly.
Resolving gel monomer solution, 15% total acrylamide (15% T): 14.08 w/v acrylamide, 0.92% w/v N,N’-methylene-bis-acrylamide, 5% sucrose in the resolving gel buffer. The monomer solution is filtered through a 0.22 μm filter using vacuum filtration assembly and degassed for an additional 10–15 min under vacuum. A 7 mm diam. × 10 cm resolving gel column requires 4 mL monomer solution. The solution can be stored at 4 °C for several months.
Stacking gel monomer solution, 5% T: 4.75% w/v acrylamide, 0.25% w/v bis-acrylamide in the resolving gel buffer, pH 6.3 adjusted with HCl. The monomer solution must be filtered through a 0.22 μm filter using vacuum filtration assembly and degassed for an additional 10–15 min under vacuum. The stacking gel volume is 1.5- to twofold greater than the volume of sample.
10% (100 mg/mL) ammonium persulfate (APS) aqueous solution prepared fresh.
50% w/v sucrose solution containing 10 μg/mL phenol red (tracking dye). Dissolve 5 g sucrose in enough distilled water to make 10 mL solution and add 100 μL of 1 mg/mL phenol red solution. The sucrose solution can be stored for several months at 4 °C. The 1 mg/mL phenol red solution can be stored at −20 °C for a year.
Water-saturated butanol for gel overlay.
9.4. Method for preparative CE PAGE separation of the bikunin GAG chains
To cast a 15% T resolving gel column, 4 mL monomer solution is combined with 4 μL N,N,N’,N’-tetramethylenediamine (TEMED) and 12 μL 10% APS solution, quickly mixed and poured into the gel tube. The gel tube is tapped to remove bubbles, the gel is overlaid with water-saturated butanol, and allowed to polymerize for 1–2 h. The butanol is replaced with resolving gel buffer and the gel is left to polymerize overnight.
The resolving gel buffer is removed, and a 0.5 mL stacking gel is cast on top of the resolving gel. The stacking gel contains 1 μL TEMED and 30 μL 10% APS per 1 mL of stacking gel monomer solution. The gel is overlaid with water-saturated butanol and allowed to polymerize for 1 h. The overlay is decanted, and the gel surface is gently rinsed with distilled water.
The Mini-Prep electrophoresis cell is assembled as described in the manufacturer instructions. The lower chamber and the elution chamber are filled with the resolving gel buffer, and the upper chamber is filled with the electrode running buffer.
The elution buffer flow rate is set to 80 μL/min, and the fraction collector is set to collect 3-min fractions.
The desalted GAG sample containing approximately 300 μg GAG in 20–50 μL water is diluted to 125 μL with the electrode running buffer and mixed with 125 μL 50% sucrose containing 10 μg/mL phenol red. The red dye in the sample solution allows tracking the ion front migration during the electrophoresis.
The power supply is programmed for an 8-h run at a constant power of 1 W. It takes approximately 2 h for the ion front to reach the bottom of the gel column, during which time the effluent can be collected in a small waste container.
Once the phenol red band has reached the bottom of the gel column, the fractions are collected, and the first fraction containing phenol red is numbered 1.
The gel-eluted fractions are analyzed using 0.75 mm × 68 mm × 86 mm mini-gels. The buffers and the acrylamide monomer solutions used for preparative PAGE are used for the analytical PAGE. One mini-gel requires 4 mL of resolving gel monomer solution, 4 μL TEMED, and 24 μL 10% APS to catalyze polymerization. A stacking gel requires 1 mL of the monomer solution, 1 μL TEMED, and 30 μL 10% APS. The buffer volume requirements vary depending on the electrophoresis cell model.
Under the experimental condition described here, bikunin GAGs start eluting after 3.5–4 h, and after 7.5 h, GAGs are not detected in the gel-eluted fractions by PAGE visualized with silver staining. An example of the PAGE analysis of fractions 49–55 is shown in Fig. 3.8 (inset). The GAG fractions must be purified from the elution buffer using anion-exchange chromatography prior to the FTMS analysis; otherwise, the GAG signal in FT mass spectra is suppressed by disodium EDTA clusters (Laremore et al., 2010).
Figure 3.8.

PAGE and the negative ion ESI FTMS analysis of a bikunin GAG fraction isolated using continuous-elution PAGE: an example of data interpretation.
9.5. Materials and solutions for purification of gel-eluted GAG fractions for FTMS analysis
Strong anion-exchange mini-spin columns, medium capacity (VivaPure Q Mini M, Sartorius Stedim, part # VS-IX01QM24).
Amicon Ultra 10,000 MWCO centrifugal filter for volumes <500 μL (Millipore cat. # UFC5010BK).
A microcentrifuge that can achieve 500 × g and 13,000 × g rcf.
Anion exchange loading solution: 50 mM sodium chloride in distilled water.
Anion exchange elution solution: 1.5 M sodium chloride in distilled water.
Anion exchange sample solution: 120 mM sodium chloride in distilled water.
0.1 M silver nitrate solution.
9.6. Method for purification of gel-eluted GAG fractions for FTMS analysis
The SAX spin-column is conditioned with 400 μL of 50mM NaCl solution by centrifugation at 500 × g for 5 min.
Gel-eluted fractions containing GAGs (240 μL) are brought to 50 mM NaCl concentration by adding 160 μL of the sample solution and loaded on the preconditioned spin-columns by centrifugation at 500 × g for 5 min.
The bound GAGs are washed twice with 400 μL of loading solution by centrifugation at 500 × g for 5 min each time, and eluted with two 100-μL portions of elution solution by centrifugation at 500 × g for 5 min.
The GAGs eluted from the SAX spin column are desalted using the 10,000 MWCO centrifugal filter until the flow-through tests negative for chloride ion with 0.1 M silver nitrate solution. The final volume of purified GAG sample should be 20–30 μL, and this solution can be used for the direct infusion ESI FTMS.
9.7. ESI FTMS analysis of bikunin GAG chains separated by preparative PAGE
ESI is a soft ionization method during which analytes in solution are delivered to a spray tip held at a several kilovolt potential. The charge separation on the surface of solution emerging from the spray tip causes the liquid to form a jet and explode into a plume of droplets which are then evaporated in a stream of drying gas. Followed the desolvation, analyte ions enter the inlet orifice of the mass spectrometer. While the mechanisms of ESI are still under investigation, the experimental evidence suggests that the composition of the spray solution affects the type of ionic species observed in the mass spectra. In our experience, 0.1% formic acid in 50% aqueous methanol (Laremore et al., 2010; Wolff et al., 2008b) suppresses Na/H heterogeneity in the GAG mass spectra, simplifying the data interpretation.
An LTQ XL Orbitrap mass spectrometer (Thermo Fisher Scientific, San Jose, CA) interfaced with Agilent 1200 nano-LC pump was used for the MW analysis of the PAGE-separated bikunin GAG chains.
9.8. Materials and solutions for the ESI FTMS analysis of gel-eluted bikunin GAG fractions
Mobile phase: 0.1% v/v formic acid in 50% v/v aqueous methanol.
Purified GAG samples in HPLC-grade water, volume reduced to 20–30 μL.
Glass vials, small volume inserts, and screw caps with silicone/PTFE septa for Agilent 1200 autosampler (MicroSolv, Eatontown, NJ; cat. # 9502S-0CV, 95001-04N, and 9502S-10C-B).
ESI tuning mix or a GAG oligosaccharide standard.
9.9. Method for the ESI FTMS analysis of gel-eluted bikunin GAG fractions
The mobile phase flow is set to 50 μL/min.
The mass spectrometer is tuned using an available tuning mix to obtain abundant negative ion(s) in the 600–900 m/z region of the mass spectrum. Typical instrument parameters include spray voltage 3 kV, capillary temperature 200 °C, capillary voltage 15 V, tube lens 100 V, the sheath and auxiliary gas flow rates of 20 and 5 units, respectively.
The GAG samples are transferred into the autosampler vials and placed in the sample tray. It is recommended to include a wash injection in the analysis sequence if several GAG samples are to be analyzed. A vial containing HPLC-grade water can be added to a sample tray and the water can be injected after each GAG injection to minimize carryover between the GAG injections.
An injection volume of 5 μL should afford a good quality mass spectrum.
The mass spectra are acquired in the negative ion mode, at a resolution of 30,000 over a range of 400–1500 m/z.
10. An Approach to FTMS Data Interpretation
An example of FT mass spectrum of a gel-eluted bikunin GAG fraction #50 is shown in Fig. 3.8. The mass spectrometer was tuned using bovine lung heparin tetradecasaccharide which was prepared in our laboratory using the CE PAGE method described here for separation and purification of bikunin GAG chains (Laremore et al., 2010).
The bikunin GAG mass spectrum appears to be complex; however, manual deconvolution of 10 abundant peaks reveals four masses (Fig. 3.8A, inset), only three of which correspond to different chain lengths, since two masses differ by 80 mass units corresponding to a sulfo group.
An expanded view of the isotopic peak envelope of the most abundant ion at m/z 1043 shows that the monoisotopic peak (circled in Fig. 3.8B) has m/z 1042.9075. Manual deconvolution affords the monoisotopic mass of this GAG chain:
To find out what composition corresponds to this mass, it is useful to set the lower and upper limits of possible chain lengths. Based on the bikunin GAG disaccharide composition (Chi et al., 2008; Enghild et al., 1999), the shortest chain would contain the linkage region (LR) tetrasaccharide with a mass of 652 Da and all GlcA-GalNAc4S disaccharides with a residue mass of 459 Da. The longest chain would contain the LR tetrasaccharide and all GlcA-GalNAc0S disaccharides with a residue mass of 379 Da (Fig. 3.8B, inset). The range of chain lengths for the GAG with a mass of 6263.4450 units is 28–34 monosaccharides. A CS GAG chain can be comprised by odd or even number of monosaccharides, and in each case its monoisotopic mass can be expressed as follows:
The number of disaccharides is denoted di, the number of sulfo groups is denoted s; and the monoisotopic masses of the LR tetrasaccharide and the nonreducing end GalNAc residues are included in the GAG mass calculations. The two expressions are used in creating an Excel spreadsheet mass calculator for chain lengths of 28–34 monosaccharides and the best match between the observed and the calculated monoisotopic masses is found. Thus, bikunin GAG with a mass of 6263.4450 units contains 31 monosaccharides, including the LR tetrasaccharide, and 6 sulfo groups (Fig. 3.8B).
11. Direct Infusion ESI FT-ICR MS Analysis of Bikunin GAG Mixture
Analysis of intact GAG mixtures is a new frontier in glycomics of GAGs and requires the use of state-of-the-art mass analyzers such as FT-ICR. Mass spectra of polydisperse GAG mixtures are highly complex, exhibiting multiple charge states and various degrees of sodium/hydrogen exchange, which inherently limit the ion signal of any single channel. There is also a space charge limit for ion capacity in the FT-ICR analyzer, which further limits the ability to simultaneously detect ions over the entire m/z range. To overcome the space charge limitation, a quadrupole isolation window of approximately 20 m/z can be used to increase the ion signal within the isolated range and provide sufficient signal-to-noise to make an accurate mass measurement of intact GAGs in the mixture (Fig. 3.9). The ESI FT-ICR analyses described here were performed on a 7T Bruker Apex IV QeFTMS instrument fitted with an Apollo II electrospray ion source.
Figure 3.9.

An illustration of the MS signal improvement achieved with quadrupole mass filter: ESI FT ICR MS analysis of intact bikunin GAG mixture (A) without mass filter, and (B) with a 20 m/z mass window. Overlapping small windows can be combined into a full m/z range mass spectrum with improved S/N.
11.1. Method for the ESI FT-ICR MS analysis of bikunin GAG mixture
Bikunin GAG mixture is dissolved in 50% aqueous methanol to approximately 0.1 mg/mL and ionized through backed nanospray (~1200 V) at 10 μL/h. Due to the small amount of analyte, nanospray is employed instead of microspray.
A20 m/z window is established for the quadrupole mass filter. This window is then incrementally stepped across the desired m/z range, allowing for overlap between windows. At each window setting, a mass spectrum is with 24 acquisitions signal-averaged per mass spectrum. For each mass spectrum, 512K points are acquired, padded with one zero fill, and apodized using a sinebell window. Longer time domain transients can be acquired to obtain higher resolution if desired.
Once the data is acquired, the individual-window spectra are summed to obtain a full mass spectrum with enhanced S/N. The approach to interpretation of the resulting mass spectra is described in the preceding section and in the reference by Chi et al. (2008).
12. Structural Characterization of GAG Oligosaccharides by Tandem Mass Spectrometry
The tandem MS experiments described here are performed on a Bruker Apex Ultra QeFTMS instrument (Billerica, MA). The Apex Ultra is a hybrid FT-ICR MS and contains a mass selective quadrupole for precursor ion isolation prior to activation. The instrument is fitted with an Apollo MTP dual ion source, a 25 W CO2 laser (Synrad model J48-2, Mukilteo, WA) for IRMPD, and an indirectly heated hollow cathode (HeatWave, Watsonville, CA) for generating electrons (Fig. 3.10). The precursor ion charge state and/or degree of Na/H exchange is affected by the solvent composition. Currently, we use 50% methanol in HPLC-grade water containing (1) 0.1% v/v of concentrated ammonium hydroxide solution; (2) 0.1% v/v formic acid; and (3) 1 mM sodium hydroxide. The presence of ammonium hydroxide in the spray solution increases its pH resulting in more abundant negative ions of GAGs with significant Na/H heterogeneity. The addition of formic acid lowers the pH and results in reduced Na/H heterogeneity in the GAG mass spectra. The addition of sodium hydroxide to the spray solution promotes the formation of sodium-cationized precursor ions.
Figure 3.10.

A diagram of the Bruker Apex QeFTMS instrument.
12.1. Method for structural characterization of GAG oligosaccharides by tandem MS
GAG oligosaccharide solutions are prepared at an approximate concentration of 10–20 μg/mL. The concentration is optimized based on the size and degree of sulfation of the analyte.
Depending on the amount of the GAG oligosaccharide available for the analysis, microspray or nanospray is selected for the ionization. In microspray, the sample is sprayed through a metal capillary (Agilent part G2427A) at 120 μL/h with an applied voltage of 4400 V. In backed nanospray, a pulled fused silica spray tip is used (New Objective, Woburn, MA; part FS360-20-10-N-20), and the sample is injected into a sample loop and pushed at 10 μL/h with an applied voltage of approximately 1200 V. The voltage settings are instrument-dependent and should be optimized to achieve desired ion signal.
A single-stage mass spectrum is acquired, and a precursor ion is chosen and isolated with a window of 5–10 m/z. Care should be taken to tune the instrument-specific voltages in the region between the quadrupole mass filter and FT-ICR mass analyzer to minimize preliminary ion activation and subsequent loss of SO3.
Precursor ion is accumulated in the collision cell for 0.5–4 s prior to activation. This time depends on the analyte concentration and signal intensity of the precursor ion.
- Once the precursor ion is isolated, the desired tandem MS experiment is conducted. Experiments conducted within the FT-ICR analyzer, such as IRMPD and EDD, may require refinement of the quadrupole isolation with an applied radiofrequency waveform such CHEF et al. as (de Koning , 1997) or SWIFT (Guan and Marshall, 1996). To further increase the precursor ion intensity, gating trapping can be employed to repeatedly fill the analyzer cell until the space charge capacity is reached.
- CID is performed in the high-pressure collision cell of the Apex instrument where ions undergo collisions with an inert gas, typically argon. The DC voltage applied to the collision cell rods should be tuned to convert 30–40% of the precursor ion to products (typically 5–15 V). This restriction limits the conversion of product ions into secondary products.
- IRMPD is performed in the FT-ICR analyzer of the Apex instrument. IR photons are produced on the lee-side of the instrument and conducted into the UHV region of the analyzer by a BaF2 window. A hollow electron dispenser cathode allows for on-axis alignment of the laser. Precursor ions are typically irradiated with 60–70% attenuation of the laser power for 10–80 ms. As in CID, the IRMPD pulse should be tuned to convert approximately 30–40% of the precursor ion to products to avoid secondary fragmentation. Care should be taken to properly align the laser, as the beam overlap is sensitive to the ion cloud position within the analyzer.
- EDD is performed in the FT-ICR analyzer of the Apex instrument. The EDD experiment is controlled by four parameters which are instrument-specific and depend on the instrument geometry: (1) electron cathode heater current; (2) electron cathode bias; (3) electron extraction lens bias; and (4) electron pulse duration. While the values of these parameters are dependent upon instrument geometry, the electron kinetic energy is typically 19 eV with an electron current of approximately 15 μA entering the analyzer. These values should be optimized for each experimental setup and can be readily achieved by monitoring the electron current (Leach et al., 2008).
During a typical tandem MS experiment, 24–36 acquisitions are signal averaged per mass spectrum. An example of the IRMPD and EDD mass spectra of an HS tetrasaccharide (ΔUAGlcNAc6S-GlcAGlcNAc6S) is shown in Fig. 3.11. For each mass spectrum, 512K points are acquired, padded with one zero fill, and apodized using a sinebell window. Longer time domain transients can be acquired to obtain higher resolution if desired. External calibration of mass spectra affords a mass accuracy of 1 ppm, which can be achieved using negative-ion standards such as insulin A-chain or sodium trifluoroacetate. These standards produce a suitable range of calibrant peaks spanning the typical product range of 150–1500 m/z. Internal calibration affords a mass accuracy of <1 ppm and is performed using confidently assigned glycosidic bond cleavage products as internal calibrants. Due to the large number of low-intensity products formed, only the peaks with S/N > 10 are reported. The assignment of fragmentation products is based on accurate mass measurement and can be assisted by software tools such as Glycoworkbench (Ceroni et al., 2008).
Figure 3.11.

An example of the tandem MS spectra, IRMPD and EDD, of an HS tetrasaccharide (ΔUAGlcNAc6S-GlcAGlcNAc6S) with the assigned fragments.
13. Summary
ESI MS is a versatile and sensitive technique for identification and quantification of GAGs when used in combination with enzymology, permitting the detection of subtle changes in disaccharide composition of GAGs biosynthesized under different environmental or physiological conditions. ESI coupled with high-resolution mass analyzers such as FTMS provides information about MW and composition of large oligosaccharides and intact GAGs. The sequence and fine-structure analysis of GAG oligosaccharides obtained by partial enzymatic treatment of GAG polysaccharides is possible using fragmentation methods such as IRMPD and EDD.
ACKNOWLEDGMENTS
Financial support from National Institutes of Health Grants GM38060, GM090127, and HL096972 is gratefully acknowledged.
REFERENCES
- Bielik AM, Zaia J. Historical overview of glycoanalysis. Methods Mol. Biol. 2010;600:9–30. doi: 10.1007/978-1-60761-454-8_2. [DOI] [PubMed] [Google Scholar]
- Budnik BA, Haselmann KF, Zubarev RA. Electron detachment dissociation of peptide di-anions: An electron-hole recombination phenomenon. Chem. Phys. Lett. 2001;342:299–302. [Google Scholar]
- Capon C, Mizon C, Lemoine J, Rodie-Talbere P, Mizon J. In acute inflammation, the chondroitin-4 sulphate carried by bikunin is not only longer, it is also undersulphated. Biochimie. 2003;85:101–107. doi: 10.1016/s0300-9084(03)00066-x. [DOI] [PubMed] [Google Scholar]
- Ceroni A, Maass K, Geyer H, Geyer R, Dell A, Haslam SM. Glyco-Workbench: A tool for the computer-assisted annotation of mass spectra of glycans. J. Proteome Res. 2008;7:1650–1659. doi: 10.1021/pr7008252. [DOI] [PubMed] [Google Scholar]
- Chi L, Wolff JJ, Laremore TN, Restaino OF, Xie J, Schiraldi C, Toida T, Amster IJ, Linhardt RJ. Structural analysis of bikunin glycosaminoglycan. J. Am. Chem. Soc. 2008;130:2617–2625. doi: 10.1021/ja0778500. [DOI] [PMC free article] [PubMed] [Google Scholar]
- de Koning LJ, Nibbering NMM, van Orden SL, Laukien FH. Mass selection of ions in a Fourier transform ion cyclotron resonance trap using correlated harmonic excitation fields (CHEF) Int. J. Mass Spectrom. 1997;165:209–219. [Google Scholar]
- Enghild JJ, Salvesen G, Hefta SA, Thogersen IB, Rutherfurd S, Pizzo SV. Chondroitin-4-sulfate covalently cross-links the chains of the human blood protein pre-α-inhibitor. J. Biol. Chem. 1991;266:747–751. [PubMed] [Google Scholar]
- Enghild JJ, Thogersen IB, Cheng F, Fransson LA, Roepstorff P, Rahbek-Nielsen H. Organization of the inter-alpha-inhibitor heavy chains on the chondroitin sulfate originating from Ser(10) of bikunin: Posttranslational modification of IalphaI-derived bikunin. Biochemistry. 1999;38:11804–11813. doi: 10.1021/bi9908540. [DOI] [PubMed] [Google Scholar]
- Flangea C, Schiopu C, Sisu E, Serb A, Przybylski M, Seidler DG, Zamfir AD. Determination of sulfation pattern in brain glycosaminoglycans by chip-based electrospray ionization ion trap mass spectrometry. Anal. Bioanal. Chem. 2009;395:2489–2498. doi: 10.1007/s00216-009-3167-0. [DOI] [PubMed] [Google Scholar]
- Fries E, Kaczmarczyk A. Inter-alpha-inhibitor, hyaluronan and inflammation. Acta Biochim. Pol. 2003;50:735–742. [PubMed] [Google Scholar]
- Guan SH, Marshall AG. Stored waveform inverse Fourier transform (SWIFT) ion excitation in trapped-ion mass spectometry: Theory and applications. Int. J. Mass Spectrom. Ion Processes. 1996;158:5–37. [Google Scholar]
- Guimond SE, Puvirajesinghe TM, Skidmore MA, Kalus I, Dierks T, Yates EA, Turnbull JE. Rapid purification and high sensitivity analysis of heparan sulfate from cells and tissues: Toward glycomics profiling. J. Biol. Chem. 2009;284:25714–25722. doi: 10.1074/jbc.M109.032755. [DOI] [PMC free article] [PubMed] [Google Scholar]
- Gunay NS, Tadano-Aritomi K, Toida T, Ishizuka I, Linhardt RJ. Evaluation of counterions for electrospray ionization mass spectral analysis of a highly sulfated carbohydrate, sucrose octasulfate. Anal. Chem. 2003;75:3226–3231. doi: 10.1021/ac034053l. [DOI] [PubMed] [Google Scholar]
- Iozzo RV. Proteoglycan Protocols. Humana Press; Totowa, NJ: 2001. [Google Scholar]
- Laremore TN, Ly M, Solakyildirim K, Zagorevski DV, Linhardt RJ. High-resolution preparative separation of glycosaminoglycan oligosaccharides by polyacrylamide gel electrophoresis. Anal. Biochem. 2010;401:236–241. doi: 10.1016/j.ab.2010.03.004. doi:10.1016/j.ab.2010.03.004. [DOI] [PMC free article] [PubMed] [Google Scholar]
- Leach FE, Wolff JJ, Laremore TN, Linhardt RJ, Amster IJ. Evaluation of the experimental parameters which control electron detachment dissociation, and their effect on the fragmentation efficiency of glycosaminoglycan carbohydrates. Int. J. Mass Spectrom. 2008;276:110–115. doi: 10.1016/j.ijms.2008.05.017. [DOI] [PMC free article] [PubMed] [Google Scholar]
- Linhardt RJ. Analysis of glycosaminoglycans with polysaccharide lyases. Curr. Protoc. Mol. Biol. Chapter. 2001;17 doi: 10.1002/0471142727.mb1713bs48. Unit17 13B. [DOI] [PubMed] [Google Scholar]
- Ly M, Wang Z, Laremore TN, Zhang F, Zhong W, Pu D, Zagorevski DV, Dordick JS, Linhardt RJ. Analysis of E. coli K5 capsular polysaccharide heparosan. Anal. Bioanal. Chem. 2010 doi: 10.1007/s00216-010-3679-7. (in press) [DOI] [PMC free article] [PubMed] [Google Scholar]
- Nairn AV, Kinoshita-Toyoda A, Toyoda H, Xie J, Harris K, Dalton S, Kulik M, Pierce JM, Toida T, Moremen KW, Linhardt RJ. Glycomics of proteoglycan biosynthesis in murine embryonic stem cell differentiation. J. Proteome Res. 2007;6:4374–4387. doi: 10.1021/pr070446f. [DOI] [PMC free article] [PubMed] [Google Scholar]
- Saad OM, Leary JA. Heparin sequencing using enzymatic digestion and ESI-MSn with HOST: A heparin/HS oligosaccharide sequencing tool. Anal. Chem. 2005;77:5902–5911. doi: 10.1021/ac050793d. [DOI] [PubMed] [Google Scholar]
- Sinnis P, Coppi A, Toida T, Toyoda H, Kinoshita-Toyoda A, Xie J, Kemp MM, Linhardt RJ. Mosquito heparan sulfate and its potential role in malaria infection and transmission. J. Biol. Chem. 2007;282:25376–25384. doi: 10.1074/jbc.M704698200. [DOI] [PMC free article] [PubMed] [Google Scholar]
- Staples GO, Bowman MJ, Costello CE, Hitchcock AM, Lau JM, Leymarie N, Miller C, Naimy H, Shi X, Zaia J. A chip-based amide-HILIC LC/MS platform for glycosaminoglycan glycomics profiling. Proteomics. 2009;9:686–695. doi: 10.1002/pmic.200701008. [DOI] [PMC free article] [PubMed] [Google Scholar]
- Staples GO, Naimy H, Yin H, Kileen K, Kraiczek K, Costello CE, Zaia J. Improved hydrophilic interaction chromatography LC/MS of heparinoids using a chip with postcolumn makeup flow. Anal. Chem. 2010;82:516–522. doi: 10.1021/ac901706f. [DOI] [PMC free article] [PubMed] [Google Scholar]
- Tissot B, Ceroni A, Powell AK, Morris HR, Yates EA, Turnbull JE, Gallagher JT, Dell A, Haslam SM. Software tool for the structural determination of glycosaminoglycans by mass spectrometry. Anal. Chem. 2008;80:9204–9212. doi: 10.1021/ac8013753. [DOI] [PubMed] [Google Scholar]
- Warda M, Toida T, Zhang F, Sun P, Munoz E, Xie J, Linhardt RJ. Isolation and characterization of heparan sulfate from various murine tissues. Glycoconj. J. 2006;23:555–563. doi: 10.1007/s10719-006-7668-1. [DOI] [PMC free article] [PubMed] [Google Scholar]
- Wolff JJ, Amster IJ, Chi L, Linhardt RJ. Electron detachment dissociation of glycosaminoglycan tetrasaccharides. J. Am. Soc. Mass Spectrom. 2007a;18:234–244. doi: 10.1016/j.jasms.2006.09.020. [DOI] [PMC free article] [PubMed] [Google Scholar]
- Wolff JJ, Chi L, Linhardt RJ, Amster IJ. Distinguishing glucuronic from iduronic acid in glycosaminoglycan tetrasaccharides by using electron detachment dissociation. Anal. Chem. 2007b;79:2015–2022. doi: 10.1021/ac061636x. [DOI] [PMC free article] [PubMed] [Google Scholar]
- Wolff JJ, Laremore TN, Busch AM, Linhardt RJ, Amster IJ. Electron detachment dissociation of dermatan sulfate oligosaccharides. J. Am. Soc. Mass Spectrom. 2008a;19:294–304. doi: 10.1016/j.jasms.2007.10.007. [DOI] [PMC free article] [PubMed] [Google Scholar]
- Wolff JJ, Laremore TN, Busch AM, Linhardt RJ, Amster IJ. Influence of charge state and sodium cationization on the electron detachment dissociation and infrared multiphoton dissociation of glycosaminoglycan oligosaccharides. J. Am. Soc. Mass Spectrom. 2008b;19:790–798. doi: 10.1016/j.jasms.2008.03.010. [DOI] [PMC free article] [PubMed] [Google Scholar]
- Zaia J. Principles of mass spectrometry of glycosaminoglycans. J. Biomol. Mass Spectrom. 2005;1:3–36. [Google Scholar]
- Zaia J. Mass spectrometry and the emerging field of glycomics. Chem. Biol. 2008;15:881–892. doi: 10.1016/j.chembiol.2008.07.016. [DOI] [PMC free article] [PubMed] [Google Scholar]
- Zaia J. On-line separations combined with MS for analysis of glycosaminoglycans. Mass Spectrom. Rev. 2009;28:254–272. doi: 10.1002/mas.20200. [DOI] [PMC free article] [PubMed] [Google Scholar]
- Zaia J, Costello CE. Tandem mass spectrometry of sulfated heparin-like glycosaminoglycan oligosaccharides. Anal. Chem. 2003;75:2445–2455. doi: 10.1021/ac0263418. [DOI] [PubMed] [Google Scholar]
- Zamfir A, Seidler DG, Kresse H, Peter-Katalinic J. Structural characterization of chondroitin/dermatan sulfate oligosaccharides from bovine aorta by capillary electrophoresis and electrospray ionization quadrupole time-of-flight tandem mass spectrometry. Rapid Commun. Mass Spectrom. 2002;16:2015–2024. doi: 10.1002/rcm.820. [DOI] [PubMed] [Google Scholar]
- Zamfir A, Seidler DG, Kresse H, Peter-Katalinic J. Structural investigation of chondroitin/dermatan sulfate oligosaccharides from human skin fibroblast decorin. Glycobiology. 2003;13:733–742. doi: 10.1093/glycob/cwg086. [DOI] [PubMed] [Google Scholar]
- Zamfir A, Seidler DG, Schonherr E, Kresse H, Peter-Katalinic J. On-line sheathless capillary electrophoresis/nanoelectrospray ionization-tandem mass spectrometry for the analysis of glycosaminoglycan oligosaccharides. Electrophoresis. 2004;25:2010–2016. doi: 10.1002/elps.200405925. [DOI] [PubMed] [Google Scholar]
- Zamfir AD, Flangea C, Sisu E, Serb AF, Dinca N, Bruckner P, Seidler DG. Analysis of novel over- and under-sulfated glycosaminoglycan sequences by enzyme cleavage and multiple stage MS. Proteomics. 2009;9:3435–3444. doi: 10.1002/pmic.200800440. [DOI] [PubMed] [Google Scholar]
- Zhang F, Zhang Z, Thistle R, McKeen L, Hosoyama S, Toida T, Linhardt RJ, Page-McCaw P. Structural characterization of glycosaminoglycans from zebrafish in different ages. Glycoconj. J. 2009a;26:211–218. doi: 10.1007/s10719-008-9177-x. [DOI] [PMC free article] [PubMed] [Google Scholar]
- Zhang Z, Xie J, Liu H, Liu J, Linhardt RJ. Quantification of heparan sulfate disaccharides using ion-pairing reversed-phase microflow high-performance liquid chromatography with electrospray ionization trap mass spectrometry. Anal. Chem. 2009b;81:4349–4355. doi: 10.1021/ac9001707. [DOI] [PMC free article] [PubMed] [Google Scholar]
- Zimmerman JA, Watson CH, Eyler JR. Multiphoton ionization of laser-desorbed neutral molecules in a Fourier transform ion cyclotron resonance mass spectrometer. Anal. Chem. 1991;63:361–365. [Google Scholar]