Background: ENPP1 is expressed in precursor cells, but the role of ENPP1 in these cells is unknown.
Results: High cellular ENPP1 expression promotes osteoblast (bone cell) differentiation, whereas low ENPP1 expression prevents osteoblast differentiation. Pyrophosphate and phosphate do not mediate this effect.
Conclusion: ENPP1 promotes osteoblast differentiation.
Significance: ENPP1 promotes osteoblast differentiation in precursor cells, which is a critical component of anabolic bone activity.
Keywords: Bone, Cell Differentiation, Cell Surface Enzymes, Osteoblasts, shRNA, Phosphate, Pyrophosphate
Abstract
ENPP1 (ectonucleotide pyrophosphatase/phosphodiesterase-1) is an established regulator of tissue mineralization. Previous studies demonstrated that ENPP1 is expressed in differentiated osteoblasts and that ENPP1 influences matrix mineralization by increasing extracellular levels of inorganic pyrophosphate. ENPP1 is also expressed in osteoblastic precursor cells when stimulated with FGF2, but the role of ENPP1 in preosteoblastic and other precursor cells is unknown. Here we investigate the function of ENPP1 in preosteoblasts. We find that ENPP1 expression is critical for osteoblastic differentiation and that this effect is not mediated by changes in extracellular concentration levels of phosphate or pyrophosphate or ENPP1 catalytic activity. MC3T3E1(C4) preosteoblastic cells, in which ENPP1 expression was suppressed by ENPP1-specific shRNA, and calvarial cells isolated from Enpp1 knock-out mice show defective osteoblastic differentiation upon stimulation with ascorbate, as indicated by a lack of cellular morphological change, a lack of osteoblast marker gene expression, and an inability to mineralize matrix. Additionally, MC3T3E1(C4) cells, in which wild type or catalytic inactive ENPP1 expression was increased, exhibited an increased tendency to differentiate, as evidenced by increased osteoblast marker gene expression and increased mineralization. Notably, treatment of cells with inorganic phosphate or pyrophosphate inhibited, as opposed to enhanced, expression of multiple genes that are expressed in association with osteoblast differentiation, matrix deposition, and mineralization. Our results indicate that ENPP1 plays multiple and distinct roles in the development of mineralized tissues and that the influence of ENPP1 on osteoblast differentiation and gene expression may include a mechanism that is independent of its catalytic activity.
Introduction
ENPP1 (ectonucleotide pyrophosphatase/phosphodiesterase-1) is a membrane-bound, nucleoside triphosphate pyrophosphohydrolase (NTPPPH)2 that generates pyrophosphate through the hydrolysis of nucleotides and nucleotide sugars (1). ENPP1 is the primary enzymatic generator of extracellular inorganic pyrophosphate by mature osteoblasts and chondrocytes (3–5), and substantial data exist indicating that ENPP1-generated pyrophosphate plays an essential role in both hard and soft tissue mineralization. Pyrophosphate is a well established inhibitor of hydroxyapatite crystal deposition and growth (6, 7), yet pyrophosphate can also serve as an essential source of phosphate to enhance mineralization when it is hydrolyzed by TNAP (tissue-nonspecific alkaline phosphatase/Alpl/Akp2), which is co-expressed with ENPP1 in matrix vesicles and plasma membranes of mineralizing cells (5, 8). Additionally, whereas physiologic inorganic pyrophosphate levels inhibit soft tissue hydroxyapatite calcification, excessive pyrophosphate can promote the pathologic calcification of non-bony tissues in the form of calcium pyrophosphate dihydrate crystals (2, 9–12).
Three mouse models of ENPP1 deficiency exist, and all show a phenotype of decreased eutopic and increased ectopic tissue mineralization. The “tiptoe walking” mouse (ttw mouse) carries a naturally occurring truncation mutation in the Enpp1 gene, resulting in deficient ENPP1 expression and enzyme activity (13, 14). This mouse exhibits abnormal calcium deposition in cartilage and ligaments, with significantly diminished cortical bone thickness and trabecular bone volume compared with wild type littermates (14–18). The gene-targeted, global ENPP1 knock-out mouse (ENPP1−/− mouse) also exhibits diminished bone density with ectopic calcification of joints and vertebrae (19–21). Finally, a recent genome-wide chemical mutagenesis screen to identify genes associated with bone mass demonstrated that mice with a C392S mutation in ENPP1 have deficient ENPP1 protein expression with calcification in joints and blood vessels, in combination with significantly diminished long bone mineral density and content (22).
Importantly, a cross of the TNAP−/− mouse with the ENPP1−/− mouse generates a double knock-out mouse with significantly greater bone mineralization than the TNAP−/− mouse (23). This result clearly supports the idea that ENPP1 and TNAP work together to produce normally mineralized bone matrix via the generation and hydrolysis of pyrophosphate. Importantly, however, closer inspection of the ENPP1−/−/TNAP−/− mice revealed that the low bone mass phenotype of the double knock-out mice is incompletely rescued (24). This finding suggests that ENPP1 may also play a role in bone formation that is independent from that of generating inorganic pyrophosphate for hydrolysis by TNAP.
Because patients and mice who carry activating mutations in fibroblast growth factor receptors (FGFRs) show evidence of abnormal eutopic and ectopic tissue mineralization (25–29) and because ENPP1 is an essential mediator of hard and soft tissue mineralization, we became interested in the ability of FGF signaling to regulate expression of this enzyme. We initially showed that FGF2 induces ENPP1 expression in predifferentiated but not in differentiated calvarial osteoblasts (30). Subsequently, we showed that FGF signaling induces ENPP1 expression in a direct and cell type-specific manner that is dependent upon RUNX2 and MSX2 transcriptional activity (31, 32). That FGF signaling induces ENPP1 expression in preosteoblasts but not in differentiated osteoblasts suggests that the primary function of ENPP1 in preosteoblasts may be distinct from that in differentiated cells. Significantly, ENPP1 is also highly expressed in mesenchymal precursor cells of developing molars several days prior to the onset of tooth mineralization in a RUNX2-dependent manner (33). This result also supports the idea that ENPP1 has cellular functions in premineralizing cells that are distinct from that of generating extracellular pyrophosphate for control of matrix mineralization in differentiated cells.
To elucidate the cellular function of ENPP1 in preosteoblasts, we inhibited Enpp1 expression by transduction with Enpp1-specific shRNA and by isolation of calvarial cells from ENPP1−/− mice. We also enhanced wild type and catalytic inactive ENPP1 expression by transduction in calvarial preosteoblastic MC3T3E1(C4) cells. Here we show that ENPP1 expression is a necessary stimulator of osteoblast differentiation and that this effect is independent of extracellular inorganic phosphate and pyrophosphate generation and independent of ENPP1 enzymatic activity.
EXPERIMENTAL PROCEDURES
Cell Culture
ENPP1 knock-out mice were generously provided by Dr. Jose Millan (Sanford Burnham Medical Research Institute, La Jolla, CA). These mice were created by insertion of a neomycin cassette into exon nine of the gene for Enpp1 to disrupt Enpp1 gene expression (19). Primary calvarial cells were isolated from ENPP1−/− and wild type mice by collagenase digestion, as described previously (31). MC3T3E1(C4) preosteoblastic calvarial cells and primary calvarial cells were cultured in custom formulated α-minimum essential medium containing no ascorbate, supplemented with 10% fetal bovine serum (FBS) and 10,000 μg/ml penicillin/streptomycin. Cells were differentiated by the addition of 50 μg/ml ascorbate. Hek 293 Phoenix cells were cultured in DMEM supplemented with 10% FBS and penicillin/streptomycin. For stimulation of ENPP1 expression, recombinant FGF2 (Peprotech) was added to a final concentration of 50 ng/ml in medium containing 0.5% FBS. Inorganic phosphate was added at a final concentration of 5 mm, and inorganic pyrophosphate was added at a final concentration of 0.5 mm, based upon previously published reports showing that extracellular inorganic pyrophosphate and phosphate can regulate osteoblastic gene expression (34, 35).
DNA Constructs
Full-length murine Enpp1 cDNA (GenBankTM NM_008813) in the pcDNA3 mammalian expression vector (Invitrogen) was a generous gift from Dr. Robert Terkeltaub (University of California, San Diego, La Jolla, CA). Enpp1 cDNA was subcloned into the pPGS-NEO-CITE-3HA retroviral expression vector, which was a generous gift from Dr. Kun-Liang Guan (University of California, San Diego, Medical Center, La Jolla, CA).
Mutagenesis
The catalytic site of ENPP1 was inactivated by conversion of the critical threonine at position 238 to alanine, via PCR-based in vitro mutagenesis using the primer 5′- ATTGGGAAACGTCTTAGCAGGGTACATAGGCCTCAT-3′. This mutation was previously shown to abolish ENPP1 catalytic activity (36).
Transfections
Superfect transfection reagent (Qiagen) was utilized for all transfection experiments, following the manufacturer's recommended protocol. Briefly, cells were incubated with DNA-Superfect complexes for 4 h, in medium containing 10% FBS and penicillin/streptomycin. Cells were then washed with phosphate-buffered saline (PBS), and medium was replaced. Cells were incubated for an additional 24 h prior to cytokine treatment or cell lysis.
mRNA Quantification
RNA was isolated using TRIzol reagent (Invitrogen) following the manufacturer's protocols. mRNA levels were assayed by reverse transcription and real-time PCR. Real-time PCR was performed utilizing the murine Enpp1 primer/probe set Mm01193752_m1, the murine GAPDH primer/probe set Mm9999915_g1, the murine osteocalcin (OCN) Mm03413826_mH primer/probe set, the murine bone sialoprotein (BSP) primer/probe set Mm00492555_m1, the murine tissue-nonspecific alkaline phosphatase (TNAP) primer/probe set Mm00475834_m1, the murine osteopontin (OPN) primer/probe set Mm01204014_m1, the murine collagen type 1, α1 (Col1a1) primer/probe set Mm00801666_g1, the murine Runx2 primer/probe set Mm00501578_m1, and Taqman Universal PCR Master Mix (Applied Biosystems). Real-time PCR was performed on a GeneAmp 7700 thermocyler (Applied Biosystems) and quantified by comparison with a standard curve. Experiments were performed in triplicate. mRNA levels are reported after normalization to GAPDH mRNA levels.
ENPP1 Enzyme Activity Assay
ENPP1 enzyme activity was assayed using the colorimetric substrate, p-nitrophenyl thymidine 5′-monophosphate (Sigma). Cells were lysed in 1% Triton, 200 mm Tris, pH 8.0. Equivalent amounts of protein were incubated with 1 mg/ml p-nitrophenyl thymidine 5′-monophosphate for 1 h. 100 mm NaOH was added after 1 h to stop the reaction, and absorbance was measured at 405 nm.
Alkaline Phosphatase Enzyme Activity Assay
TNAP enzyme activity was assayed using the colorimetric substrate, nitro blue tetrazolium/5-bromo-4-chloro-3-indolyl phosphate (Sigma). Cells were fixed in 70% ethanol for 10 min at room temperature, air-dried, and incubated with substrate for 1 h at 37 °C. Cells were then rinsed with distilled H2O, air-dried, and visualized macroscopically for evidence of staining. For quantification, wells were scanned, and densitometry was measured using NIH Image software.
Collagen Stain
Collagenous matrix was stained with Sirius Red. Cells were fixed in Bouin's fixative, washed, and air-dried. Cells and matrix were then incubated with 100 mg/ml Sirius Red for 1 h. Cells and matrix were rinsed with 0.01 n HCl and visualized macroscopically for evidence of staining.
Mineralization Assay
Cells were grown for 5 days in α-minimum essential medium containing 50 μg/ml ascorbate. Mineralization was induced by supplementation of medium with 5 mm NaPO4 or 10 mm β-glycerophosphate, with medium replacement every day. For Von Kossa staining, cells were rinsed with phosphate-buffered saline, fixed with 100% ethanol for 30 min, and rehydrated in a graded ethanol series. Cells were rinsed with distilled H2O, incubated at 37 °C for 1 h in 5% AgNO3, rinsed again with distilled H2O, and exposed to light for 1 h. For Alizarin Red staining, cells were rinsed with phosphate-buffered saline, fixed with 100% ethanol for 30 min, and air-dried. Cells were then incubated with 0.5% Alizarin Red-S for 30 min. Cells were washed with 70% ethanol and air dried. For Alizarin quantification, stained calcium was solubilized in 10% cetylpyridinium chloride for 1 h, and absorbance was read at 562 nm.
Establishment of ENPP1-deficient Cells
MC3T3E1(C4) cells were transduced with lentiviral particles expressing a puromycin resistance gene and Enpp1-specific shRNA (Sigma Mission, SHCLNV-NM_008813) or non-target shRNA (Sigma Mission, SHC002V) in the presence of 8 μg/ml hexadimethrine bromide. 48 h after transduction, cells were selected in medium containing 10 μg/ml puromycin. Puromycin-resistant colonies were expanded and tested for expression of ENPP1.
Establishment of ENPP1-overexpressing Cells
Hek 293 Phoenix cells were transfected with pPGS empty vector or pPGS vector containing full-length murine Enpp1 cDNA (pPGS/Enpp1) or a catalytic inactive version of murine Enpp1 cDNA (pPGS/Enpp1/T238A). 48 h after transfection, medium containing virus was collected, filtered through a 0.45-μm filter, and transferred to culture plates containing MC3T3E1(C4) cells at a 70% confluence. Stably transduced cells were selected by growth in medium containing 500 μg/ml neomycin.
Immunoblots
Preparation of cell lysate was achieved by solubilization in radioimmune precipitation buffer (50 mm Tris-Cl, pH 7.4, 150 mm NaCl, 1% sodium deoxycholate, 1% Triton X-100, 0.1% SDS) containing 1× protease inhibitor mixture (Sigma), followed by removal of insoluble material by centrifugation at 12,000 rpm for 10 min. Prior to loading, 5× Laemmli loading buffer was added to a final 1× concentration, and samples were boiled for 3 min and then iced. Samples were separated by SDS-PAGE and transferred onto Immobilon (Millipore). Immunoreactive protein bands were visualized by enhanced chemiluminescence (Pierce).
Chromatin Immunoprecipitation (ChIP) Assays
ChIP assays were conducted as described previously (31). 10 μg of chromatin (input DNA) and 2 μg of RUNX2 or control IgG antibody were used for each reaction. PCR was performed using primers generated to detect the established RUNX2 binding site found within the BSP gene promoter. PCR bands were quantified with Scion Image version 4.0.3 software. RUNX2 ChIP results are presented as normalized to control IgG ChIP results.
RESULTS
shRNA for Enpp1 Suppresses Enpp1 Expression
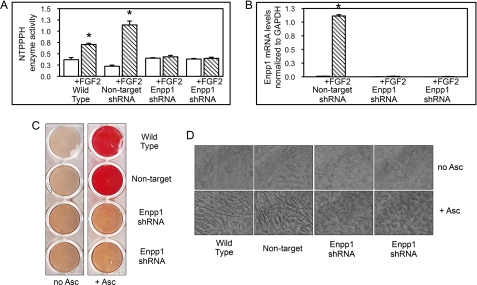
We previously showed that FGF2 induces Enpp1 gene expression in preosteoblastic cells via MAPK signaling (30, 31). To investigate the function of ENPP1 in preosteoblasts, we suppressed ENPP1 expression in calvarial preosteoblastic MC3T3E1(C4) cells by transducing with a lentivirus expressing Enpp1-specific or non-target shRNA. To substantiate our data, two distinct MC3T3E1(C4) cell clones expressing Enpp1 shRNA were compared with an MC3T3E1(C4) cell clone expressing non-target shRNA and with wild type cells. To establish strong suppression of ENPP1 expression by Enpp1 shRNA, we treated cells with FGF2, which stimulates ENPP1 expression (30–32). Here we demonstrate that FGF2 treatment significantly increases NTPPPH enzyme activity, which is indicative of ENPP1 enzyme activity, in wild type MC3T3E1(C4) cells and MC3T3E1(C4) cells stably expressing non-target shRNA, but not in the two MC3T3E1(C4) clones stably expressing Enpp1-specific shRNA (Fig. 1A). Further results demonstrate that FGF2 treatment induces Enpp1 mRNA expression in non-target shRNA MC3T3E1(C4) cells but not in Enpp1 shRNA MC3T3E1(C4) cells (Fig. 1B). Because FGF2 treatment should stimulate cellular expression of ENPP1, these results demonstrate that Enpp1 gene expression was effectively suppressed by Enpp1-specific shRNA.
FIGURE 1.
ENPP1 expression is required for ascorbate induced mineralization and cellular morphological changes. A, Enpp1 shRNA suppresses FGF2-induced ENPP1 enzyme activity. NTPPPH enzyme activity (indicative of ENPP1 enzyme activity) was analyzed in wild type MC3T3E1(C4) calvarial preosteoblasts, MC3T3E1(C4) cells expressing non-target shRNA, and two MC3T3E1(C4) cell clones expressing Enpp1-specific shRNA. Cells were treated with FGF2 to induce ENPP1 expression. NTPPPH activity was measured by incubation of cell lysate with a colorimetric substrate. *, p < 0.05 versus no FGF2. B, Enpp1 shRNA suppresses FGF2-induced Enpp1 mRNA expression. Cells expressing non-target or Enpp1-specific shRNA were treated with FGF2 to induce ENPP1 expression. Enpp1 mRNA was measured by real-time PCR. Results are presented as normalized to GAPDH. *, p < 0.05 versus no FGF2. C, ENPP1-deficient cells have a defect in matrix mineralization. Wild type, non-target shRNA and Enpp1-specific shRNA-expressing cells were cultured in medium with ascorbate and β-glycerophosphate. Mineralized matrix was stained with Alizarin Red. D, ascorbate does not induce cellular morphological changes in ENPP1-deficient cells. Wild type, non-target shRNA and Enpp1-specific shRNA-expressing cells were cultured in medium with or without ascorbate. Live cells were photographed at ×20 magnification. Error bars, S.D.
ENPP1-deficient MC3T3E1(C4) Cells Are Defective in Osteoblast Differentiation
Because ENPP1 generates extracellular pyrophosphate, which inhibits extracellular matrix mineralization, we expected ENPP1-deficient cells to exhibit an enhanced ability to produce mineralized matrix in the presence of inorganic phosphate. To test this hypothesis, we performed an initial mineralization assay with our ENPP1-deficient cells using β-glycerophosphate as a source of phosphate. To our surprise, we found that multiple Enpp1 shRNA-expressing clones showed dramatically diminished mineralized nodule formation, as compared with wild type or non-target shRNA-expressing cells (Fig. 1C). To better comprehend this result, we next examined the cells over time as they were induced to undergo osteoblast differentiation by culture in ascorbate. We found that wild type and non-target shRNA-expressing cells underwent typical osteoblastic morphological changes resulting in primarily spindle-shaped cells after 14 days of culture, whereas Enpp1 shRNA-expressing cells did not (Fig. 1D). This result indicated that ENPP1-deficient cells may have a primary defect in osteoblast differentiation.
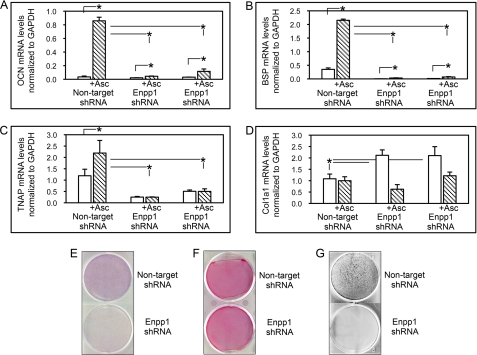
To substantiate these results, we measured the expression of genes associated with osteoblast maturation, including OCN, BSP, TNAP, and Col1a1 in non-target shRNA-expressing cells and in two clones expressing Enpp1 shRNA. Results demonstrated that non-target shRNA cells express significantly more OCN, BSP, and TNAP mRNA after 6 days of culture in ascorbate, compared with Enpp1 shRNA-expressing cells. Although stimulation with ascorbate did increase expression of OCN and BSP in Enpp1 shRNA cells, the increase was dramatically reduced compared with non-target shRNA cells (2, A and B). Notably, stimulation with ascorbate did not increase expression of TNAP in ENPP1-deficient cells, whereas it did so in non-target shRNA cells (Fig. 2C). In accordance with this, TNAP enzyme activity was also significantly diminished in Enpp1 shRNA cells compared with non-target shRNA cells after 6 days of culture in ascorbate (Fig. 2E).
FIGURE 2.
Enpp1 shRNA-expressing cells do not undergo osteoblast differentiation upon stimulation with ascorbate. A–D, ascorbate treatment does not stimulate osteoblastic gene expression in ENPP1-deficient cells. MC3T3E1(C4) cells expressing non-target shRNA and two MC3T3E1(C4) cell clones expressing Enpp1-specific shRNA were cultured with or without ascorbate to induce osteoblast differentiation. OCN, BSP, TNAP, and Col1a1 mRNA levels were measured by real-time PCR. Results are presented as normalized to GAPDH. *, p < 0.05 between the indicated groups. E, ascorbate treatment does not stimulate TNAP enzyme activity in ENPP1-deficient cells. Cells expressing non-target or Enpp1-specific shRNA were cultured with ascorbate, and TNAP enzyme activity was assayed by incubation with a colorimetric substrate. F, ENPP1-deficient cells produce similar amounts of collagenous matrix. MC3T3E1(C4) cells expressing non-target or Enpp1-specific shRNA were cultured with ascorbate, and collagen was stained with Sirius Red. G, ENPP1-deficient cells do not produce mineralized nodules in the presence of inorganic phosphate. Non-target shRNA and Enpp1-specific shRNA expressing MC3T3E1(C4) cells were cultured in medium containing ascorbate and Na2HPO4. Mineralized matrix was stained by Von Kossa. Error bars, S.D.
Ascorbate stimulates the production of a functional collagenous extracellular matrix, which is essential for the induction of osteoblastic gene expression in differentiating cells (37), so we also examined Col1a1 mRNA expression in the Enpp1 shRNA-expressing cells. Results show that the ENPP1-deficient cells express significantly more Col1a1 mRNA than non-target shRNA-expressing cells, which is diminished to levels similar to that of non-target shRNA-expressing cells upon culture in ascorbate. This indicates that the inability of Enpp1 shRNA cells to produced mineralized nodules was not due to diminished Col1a1 expression (Fig. 2D). Similarly, Sirius Red collagen staining revealed relatively similar levels of collagen deposition by ENPP1-deficient and control cells after induction of osteoblast differentiation by culture in ascorbate, again indicating that the defective mineralization was not likely to be due to inadequate collagen production.
β-Glycerophosphate is a TNAP enzyme-dependent source of inorganic phosphate for hydroxyapatite deposition in culture. ENPP1-deficient cells do not increase expression levels of TNAP in response to treatment with ascorbate; therefore, their inability to produce mineralized matrix in the presence of β-glycerophosphate could be due to a lack of β-glycerophosphate hydrolysis. To eliminate this possibility, we compared mineralized nodule formation of ENPP1-deficient and control cells in the presence of NaH2PO4 as a source of inorganic phosphate. Von Kossa staining for mineral deposition demonstrates that the ENPP1-deficient cells were unable to form mineralized nodules even upon direct medium supplementation with inorganic phosphate (Fig. 2G). This result indicates that the lack of matrix mineralization by these cells is not simply due to insufficient TNAP expression. Taken together, these results demonstrate that ENPP1-deficient cells have a primary defect in osteoblast differentiation.
ENPP1-overexpressing Cells Show Enhanced Osteoblastic Gene Expression
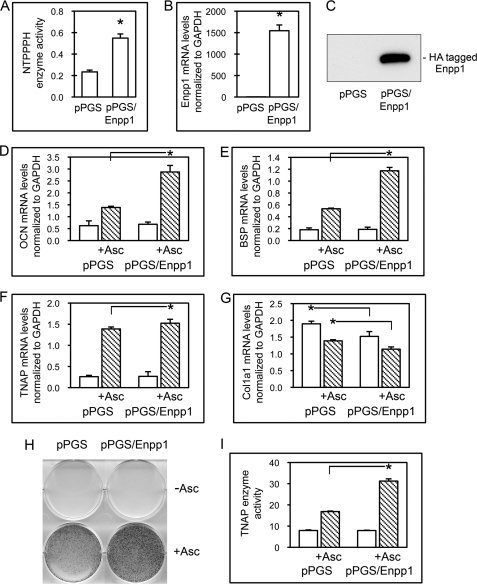
To further investigate ENPP1 as a regulator of osteoblast differentiation, we transduced MC3T3E1(C4) cells with Enpp1 cDNA and selected for stable transductants. Results demonstrate that cells stably transduced with Enpp1 cDNA (pPGS/Enpp1 cells) show significantly increased NTPPPH enzyme activity as compared with cells stably transduced with the empty vector (pPGS cells), reflective of increased ENPP1 enzyme activity (Fig. 3A). pPGS/Enpp1 cells also express significantly more Enpp1 mRNA than control cells (Fig. 3B), and pPGS/Enpp1 cells but not pPGS cells express the exogenous ∼105-kDa HA-tagged ENPP1 protein, confirming that pPGS/Enpp1-stable transductants express exogenous ENPP1 (Fig. 3C).
FIGURE 3.
Overexpression of ENPP1 promotes expression of genes associated with osteoblast differentiation. A, MC3T3E1(C4) cells transduced with Enpp1 cDNA exhibit high ENPP1 enzyme activity. NTPPPH enzyme activity was analyzed in cells stably expressing a control vector (pPGS) or an Enpp1 expression vector (pPGS/Enpp1) by incubation of cell lysate with a colorimetric substrate. *, p < 0.05 versus pPGS cells. B, cells transduced with Enpp1 cDNA express high levels of Enpp1 mRNA. Enpp1 mRNA was measured by real-time PCR. Results are presented as normalized to GAPDH. *, p < 0.05 versus pPGS cells. C, cells transduced with Enpp1 cDNA express HA-tagged ENPP1. ENPP1 protein was assayed by immunoblotting for HA-tagged ENPP1. D–G, ENPP1-overexpressing cells show enhanced expression of osteoblastic genes. Cells were cultured with or without ascorbate to induce osteoblast differentiation. OCN, BSP, TNAP, and Col1a1 mRNA levels were measured by real-time PCR. Results are presented as normalized to GAPDH. *, p < 0.05 between the indicated groups. H and I, ENPP1-overexpressing MC3T3E1(C4) cells exhibit increased TNAP enzyme activity. Cells were cultured with or without ascorbate, and TNAP enzyme activity was visualized by incubation of cells with a colorimetric substrate. TNAP enzyme activity was quantified by densitometry. Results are shown as means ± S.D. (error bars) of triplicate experiments. *, p < 0.05 between indicated groups.
To determine if overexpression of ENPP1 affects osteoblast differentiation, we next compared the expression of genes associated with osteoblast maturation, including OCN, BSP, TNAP, and Col1a1, in control and ENPP1-overexpressing cells. Results show that overexpression of ENPP1 in preosteoblasts leads to significantly higher expression levels of OCN and BSP compared with control cells upon stimulation to differentiate by treatment with ascorbate (Fig. 3, D and E). Ascorbate treatment also increased TNAP mRNA levels in pPGS/Enpp1 cells to a greater extent than in pPGS cells, although this difference was not as dramatic (Fig. 3F). Ascorbate treatment did increase TNAP enzyme activity levels in pPGS/Enpp1 cells to almost twice that seen in pPGS cells (Fig. 3, H and I). This result is consistent with a previous report that demonstrated that ENPP1 expression in calvarial osteoblastic cells influenced TNAP enzyme activity to a greater extent than TNAP mRNA expression upon treatment of cells with ascorbate (38).
Because production of a collagenous matrix is essential for expression of osteoblast marker genes, we also examined Col1a1 mRNA expression in the ENPP1-overexpressing cells. In accordance with our results for ENPP1-deficient cells, Col1a1 mRNA levels were significantly lower in pPGS/Enpp1 cells with no treatment, when compared with control pPGS cells (Fig. 3G). Additionally, Col1a1 mRNA levels were not higher in ascorbate-treated pPGS/Enpp1 cells than in ascorbate-treated pPGS cells. These results indicate that the increased levels of osteoblastic gene expression seen in pPGS/Enpp1 cells upon ascorbate treatment are not due to increased collagen expression in the pPGS/Enpp1 cells. That Col1a1 mRNA expression is increased in Enpp1 shRNA-expressing cells and decreased in Enpp1 cDNA-expressing cells is consistent with the previous report that type I collagen expression and synthesis is increased in calvarial osteoblasts isolated from Enpp1−/− mice (38). In support of our findings that Enpp1 enhances osteoblast differentiation, pPGS control and ENPP1-overexpressing cells were generated on two separate occasions, and results were similar with both sets of cells (data not shown).
Calvarial Cells of ENPP1−/− Mice Exhibit Diminished Osteoblast Differentiation
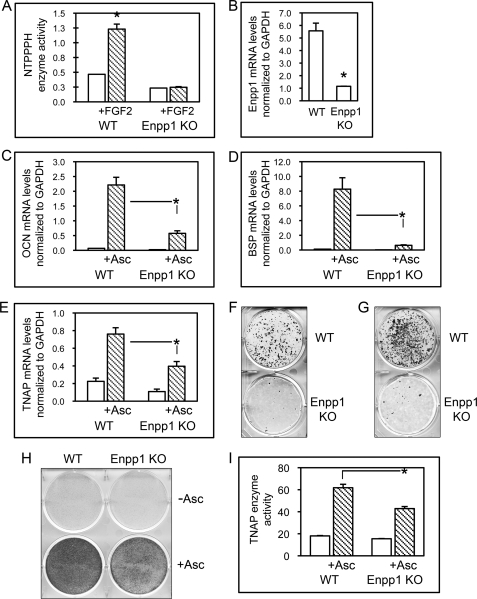
To establish that ENPP1 effects upon osteoblast differentiation are not specific to the MC3T3E1(C4) calvarial cell line, we isolated calvarial osteoblastic cells from ENPP1 knock-out mice and wild type littermates. To confirm that ENPP1 expression is absent in ENPP1−/− mice, we treated cells with FGF2 to stimulate ENPP1 expression. FGF2 treatment significantly increased NTPPPH enzyme activity (indicative of ENPP1 enzyme activity) in cells isolated from wild type mice but not in cells isolated from ENPP1−/− mice (Fig. 4A). Furthermore, Enpp1 mRNA expression was evident in cells isolated from wild type mice but was not evident in cells isolated from ENPP1−/− mice (Fig. 4B).
FIGURE 4.
Calvarial cells isolated from ENPP1 knock-out mice exhibit diminished osteoblast differentiation. A, calvarial cells from ENPP1 knock-out mice show diminished ENPP1 enzyme activity. Cells were treated with FGF2 to induce ENPP1 expression. NTPPPH activity was measured by incubation of cell lysate with a colorimetric substrate. *, p < 0.05 versus no treatment. B, calvarial cells from ENPP1 knock-out mice show diminished Enpp1 mRNA expression. Enpp1 mRNA was measured by real-time PCR. Results are presented as normalized to GAPDH. *, p < 0.05 versus WT. C–E, calvarial cells from ENPP1 knock-out mice show diminished osteoblastic gene expression. Primary calvarial cells were cultured with or without ascorbate. OCN, BSP, and TNAP mRNA levels were measured by real-time PCR. Results are presented as normalized to GAPDH. *, p < 0.05 between the indicated groups. F and G, calvarial cells from ENPP1 knock-out mice show diminished mineralization. Mineralized nodule formation was induced by culture of cells in medium containing ascorbate and β-glycerophosphate (F) or NaPO4 (G). Mineralized matrix was stained by Von Kossa. H and I, calvarial cells from ENPP1 knock-out mice show diminished TNAP enzyme activity. Cells were cultured with or without ascorbate, and TNAP enzyme activity was visualized by incubation of cells with a colorimetric substrate. TNAP enzyme activity was quantified by densitometry. Results are shown as means ± S.D. (error bars) of triplicate experiments. *, p < 0.05 between the indicated groups.
We next measured the expression of genes associated with osteoblast maturation, including OCN, BSP, and TNAP, in cells isolated from wild type and ENPP1−/− mice. Results demonstrate that wild type cells express significantly more OCN, BSP, and TNAP mRNA after 6 days of culture in ascorbate, compared with ENPP1−/− cells. Although stimulation with ascorbate did increase expression of OCN, BSP, and TNAP in ENPP1−/− cells, the increase was reduced compared with that seen in wild type cells (Fig. 4, C–E). TNAP enzyme activity was also significantly diminished in ENPP1−/− cells compared with wild type cells after 6 days of culture in ascorbate (Fig. 4, H and I).
Because TNAP expression was low in ENPP1−/− cells and because β-glycerophosphate is a TNAP-dependent source of phosphate for mineralization, we compared mineralized nodule formation by ENPP1−/− and wild type cells in the presence of β-glycerophosphate and in the presence of NaH2PO4 as a source of inorganic phosphate. Von Kossa staining for mineral deposition clearly demonstrates that the ENPP1−/− cells formed fewer mineralized nodules in the presence of β-glycerophosphate or NaH2PO4 when compared with wild type cells (Fig. 4, F and G). Together, these results indicate that calvarial cells isolated from ENPP1−/− mice are defective in both osteoblastic gene expression and matrix mineralization.
Extracellular Inorganic Phosphate and Pyrophosphate Regulate Calvarial Osteoblastic Gene Expression
Osteopontin expression is significantly diminished in calvarial cells and tissues of ENPP1-deficient mice (20, 39), and treatment of primary ENPP1−/− calvarial cells or of MC3T3E1(C4) calvarial cells with pyrophosphate increases osteopontin expression, indicating that ENPP1 may mediate osteoblastic gene expression by increasing extracellular levels of inorganic pyrophosphate (20, 38). ENPP1-generated extracellular pyrophosphate can be hydrolyzed by enzymes in addition to TNAP (34), and previous reports have also demonstrated that extracellular inorganic phosphate can stimulate osteopontin expression in MC3T3E1 calvarial cells, regardless of confluence or of differentiation state (35). Therefore, we next sought to determine if changes in extracellular inorganic pyrophosphate or phosphate levels mediated the differential osteoblastic gene expression seen in our ENPP1-deficient and -overexpressing cells.
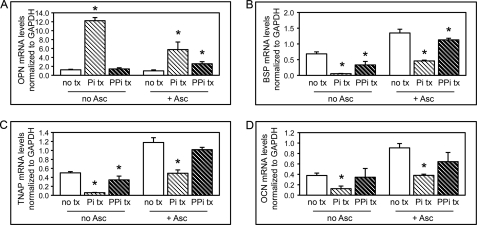
Treatment of wild type MC3T3E1(C4) cells with phosphate significantly increased OPN mRNA expression in both predifferentiated and differentiated cells, whereas treatment with inorganic pyrophosphate increased OPN gene expression in only differentiated cells (Fig. 5A). This result is consistent with previously reported results showing that the stimulation of OPN gene expression by pyrophosphate is independent of hydrolysis and phosphate transport (39), indicating that the mechanism by which extracellular pyrophosphate influences osteoblastic gene expression is independent of phosphate. Altogether, our results confirm previous results demonstrating that extracellular pyrophosphate induces OPG gene expression.
FIGURE 5.
Inorganic phosphate and pyrophosphate regulate osteoblastic gene expression. A–D, wild type MC3T3E1(C4) cells were cultured with or without ascorbate and with or without inorganic phosphate (Pi) or inorganic pyrophosphate (PPi). OCN, BSP, TNAP, and Col1a1 mRNA levels were measured by real-time PCR. Results are presented as normalized to GAPDH. *, p < 0.05 versus no phosphate or pyrophosphate treatment (no tx). Error bars, S.D.
In direct contrast to the effect of inorganic phosphate and pyrophosphate on OPN expression, treatment of MC3T3E1(C4) cells with phosphate or pyrophosphate diminished BSP, TNAP, and OCN gene expression (Fig. 5, B–D). Because pyrophosphate and phosphate inhibited, as opposed to enhanced, expression of BSP, TNAP, and OCN, these results indicate that the diminished BSP, TNAP, and OCN gene expression seen in ENPP1-deficient cells and the enhanced BSP, TNAP, and OCN gene expression seen in ENPP1-overexpressing cells are not mediated by ENPP1-generated extracellular pyrophosphate or phosphate.
Enhanced Differentiation of ENPP1-overexpressing Cells Is Not Mediated by Inorganic Pyrophosphate or Phosphate
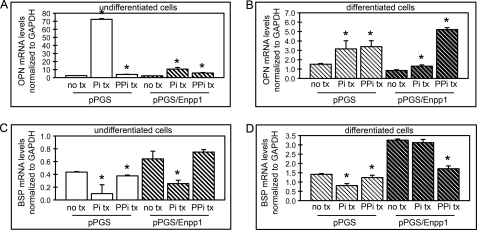
We find that ENPP1-overexpressing cells show enhanced expression of BSP, TNAP, and OCN (genes associated with osteoblast differentiation) upon stimulation with ascorbate. ENPP1 activity is known to increase extracellular levels of pyrophosphate and/or phosphate, yet we also find that pyrophosphate and phosphate inhibit, as opposed to enhance, expression of these genes in wild type osteoblastic cells. To confirm that the enhanced expression of BSP, TNAP, and OCN in pPGS/Enpp1 cells is not due to increased extracellular levels of phosphate or pyrophosphate, we next investigated phosphate and pyrophosphate treatment effects on gene expression in pPGS and pPGS/Enpp1 cells. Similar to our results with wild type MC3T3E1(C4) cells, results show that treatment with inorganic pyrophosphate or phosphate increased OPN expression, whereas they inhibited BSP expression in both pPGS and pPGS/Enpp1 cells (Fig. 6, A–D). These results indicate that the enhanced BSP gene expression seen in ENPP1-overexpressing cells is not mediated by ENPP1-generated extracellular pyrophosphate or phosphate.
FIGURE 6.
Inorganic phosphate and pyrophosphate regulate osteoblastic gene expression in control and ENPP1-overexpressing cells. A–D, control cells (pPGS) or cells overexpressing ENPP1 (pPGS/Enpp1) were cultured in the absence (undifferentiated cells) or presence of ascorbate (differentiated cells) and treated with or without inorganic phosphate (Pi) or inorganic pyrophosphate (PPi). OCN and BSP mRNA levels were measured by real-time PCR. Results are presented as normalized to GAPDH. *, p < 0.05 versus no phosphate or pyrophosphate treatment (no tx). Error bars, S.D.
Diminished Osteoblastic Gene Expression by Primary Calvarial Cells of ENPP1−/− Mice Is Not Mediated by Deficient Inorganic Pyrophosphate or Phosphate
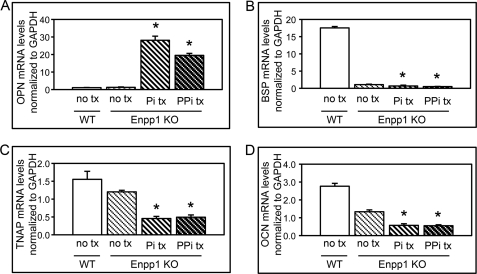
We find that primary calvarial osteoblastic cells isolated from ENPP1 knock-out mice show significantly decreased expression of OCN, BSP, and TNAP upon differentiation with ascorbate, as compared with cells isolated from wild type mice. To determine if this effect is due to diminished extracellular elaboration of phosphate or pyrophosphate by the ENPP1−/− cells, we investigated phosphate and pyrophosphate treatment effects on gene expression in primary calvarial osteoblastic cells isolated from ENPP1 knock-out mice. Similar to MC3T3E1(C4) cells, results show that treatment with inorganic pyrophosphate or phosphate increased OPN expression in primary calvarial cells isolated from ENPP1 knock-out mice (Fig. 7A). Significantly, treatment with inorganic pyrophosphate or phosphate decreased, as opposed to increased, BSP, TNAP, and OCN gene expression in ENPP1−/− primary cells (Fig. 7, B–D). These results are similar to our results for MC3T3E1(C4) cells and confirm that the diminished osteoblastic gene expression seen in ENPP1−/− cells is not likely to be mediated by lower levels of extracellular pyrophosphate or phosphate.
FIGURE 7.
Inorganic phosphate and pyrophosphate do not increase osteoblastic gene expression in primary calvarial cells isolated from ENPP1 knock-out mice. A–D, wild type (WT) and ENPP1 knock-out cells (Enpp1 KO) were cultured in the presence of ascorbate and treated with or without inorganic phosphate (Pi) or inorganic pyrophosphate (PPi). OPN, BSP, TNAP, and OCN mRNA levels were measured by real time PCR. Results are presented as normalized to GAPDH. *, p < 0.05 versus no phosphate or pyrophosphate treatment (no tx). Error bars, S.D.
Catalytic Inactive ENPP1 Enhances Osteoblast Differentiation
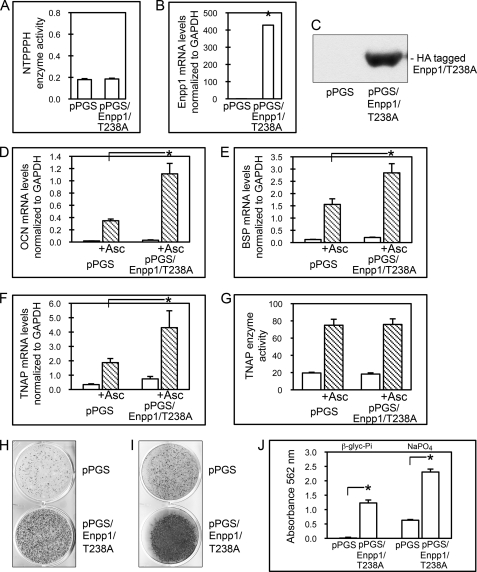
Because osteoblastic gene expression appears to be mediated by ENPP1 in a phosphate- and pyrophosphate-independent manner, we wanted to determine if ENPP1 catalytic activity is required for its ability to regulate osteoblast differentiation. To do this, we mutated a critical threonine within the catalytic site of ENPP1, to create Enpp1/T238A, and transduced MC3T3E1(C4) cells with Enpp1/T238A cDNA or a control vector. Results demonstrate that cells stably transduced with Enpp1/T238A cDNA (pPGS/Enpp1/T238A cells) show significantly increased Enpp1/T238A mRNA and protein expression but not increased NTPPPH enzyme activity, as compared with cells stably transduced with the empty vector (pPGS cells) (Fig. 8, A–C) or cells transfected with wild type ENPP1 (pPGS/Enpp1 cells; Fig. 3, A–C). In addition, pPGS/Enpp1/T238A cells but not pPGS cells express the exogenous ∼105-kDa HA-tagged ENPP1 protein, confirming that pPGS/Enpp1/T238A cells express full-length exogenous Enpp1/T238A protein (Fig. 8C).
FIGURE 8.
Overexpression of catalytic inactive ENPP1 (Enpp1/T238A) enhances osteoblast differentiation. A, MC3T3E1(C4) cells stably transduced with a catalytic mutant version of Enpp1 cDNA exhibit no increase in ENPP1 enzyme activity. NTPPPH enzyme activity was analyzed in MC3T3E1(C4) cells stably expressing a control vector (pPGS) or pPGS/Enpp1/T238A. NTPPPH activity was measured by incubation of cell lysate with a colorimetric substrate. B, MC3T3E1(C4) cells transduced with Enpp1/T238A cDNA express high levels of Enpp1 mRNA. Enpp1 mRNA was measured in pPGS and pPGS/Enpp1/T238A cells by real-time PCR. Results are presented as normalized to GAPDH. *, p < 0.05 versus pPGS cells. C, MC3T3E1(C4) cells transduced with Enpp1/T238A cDNA express HA-tagged ENPP1. HA-tagged ENPP1 protein was assayed by immunoblotting for HA-tagged ENPP1 protein in cell lysate of pPGS and pPGS/Enpp1/T238A cells. D–F, Enpp1/T238A-overexpressing cells show enhanced expression of osteoblastic genes. pPGS and pPGS/Enpp1/T238A cells were cultured with or without ascorbate to induce osteoblast differentiation. OCN, BSP, and TNAP mRNA levels were measured by real-time PCR. Results are presented as normalized to GAPDH. *, p < 0.05 between the indicated groups. G, cells overexpressing Enpp1/T238A do not show changes in TNAP enzyme activity. Cells were cultured with or without ascorbate, and TNAP enzyme activity was visualized by incubation of cells with a colorimetric substrate. TNAP enzyme activity was quantified by densitometry. Results are shown as means ± S.D. (error bars) of triplicate experiments. H–J, Enpp1/T238A-overexpressing cells exhibit increased matrix mineralization. pPGS- and pPGS/Enpp1/T238A-expressing cells were cultured in medium containing ascorbate and β-glycerophosphate (H and J) or Na2HPO4 (I and J). Mineralized matrix was stained by Von Kossa (H and I) or Alizarin Red (J). Alizarin matrix staining was quantified by absorbance. Results are shown as means ± S.D. of triplicate experiments. *, p < 0.05 between the indicated groups.
To determine if overexpression of catalytic inactive ENPP1 stimulates osteoblast differentiation, we next compared the expression of OCN, BSP, and TNAP in control and Enpp1/T238A-overexpressing cells. Results show that overexpression of Enpp1/T238A in preosteoblasts leads to significantly higher expression levels of OCN, BSP, and TNAP compared with control cells upon stimulation with ascorbate (Fig. 8, D–F). Ascorbate treatment did not increase TNAP enzyme activity levels in pPGS/Enpp1/T238A cells as compared with pPGS cells (Fig. 8G). This result indicates that although TNAP mRNA expression can be stimulated by catalytic inactive ENPP1, stimulation of TNAP enzyme active requires catalytic activity of the enzyme.
We next compared mineralized nodule formation by pPGS/Enpp1/T238A and pPGS cells in the presence of β-glycerophosphate or NaH2PO4 as source of inorganic phosphate. Von Kossa staining of mineral deposition demonstrates that pPGS/Enpp1/T238A cells formed more mineralized nodules in the presence of β-glycerophosphate or NaH2PO4 when compared with control pPGS cells (Fig. 8, H and I). Alizarin staining of mineral deposition demonstrates that pPGS/Enpp1/T238A cells exhibited significantly greater matrix mineralization in the presence of β-glycerophosphate or NaH2PO4, when compared with control pPGS cells (Fig. 8J). These results together indicate that overexpression of catalytically inactive ENPP1 can enhance osteoblastic differentiation.
ENPP1 Mediates RUNX2 Association with the Bone Sialoprotein Gene Promoter
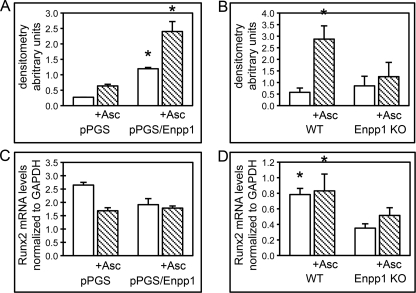
RUNX2 is an established mediator of osteoblast differentiation (40); therefore, we hypothesized that the increased osteoblastic gene expression seen in ENPP1-overexpressing cells was mediated by RUNX2. To examine this hypothesis, we performed ChIP assays to determine if RUNX2 associates with previously established RUNX2 binding sites located within the BSP gene promoter (41) to a greater extent in ENPP1-overexpressing cells than in control cells. Results demonstrate that RUNX2 associates with the BSP gene promoter to a greater extent in ENPP1-overexpressing than in control cells at base line and upon differentiation with ascorbate (Fig. 9A). Increased association of RUNX2 with the BSP gene promoter could be due to increased expression levels of RUNX2 or increased activation of RUNX2 in ENPP1-overexpressing cells. To distinguish between these two possibilities, we measured Runx2 mRNA levels in ENPP1-overexpressing and control cells and found that Runx2 levels are not higher in ENPP1-overexpressing cells as compared with control cells (Fig. 9C). These results indicate that the greater RUNX2 association with the BSP gene promoter seen in ENPP1-overexpressing cells is not likely to be due to higher overall expression levels of RUNX2.
FIGURE 9.
ENPP1 expression influences RUNX2 association with the BSP gene promoter. A, control transduced MC3T3E1(C4) cells (pPGS) or MC3T3E1(C4) cells overexpressing ENPP1 (pPGS/Enpp1) were cultured with or without ascorbate. Cross-linked chromatin was immunoprecipitated with RUNX2 or control IgG antibody. PCR was performed using primers generated to detect the RUNX2 binding site located within the BSP gene promoter. PCR bands were quantified by densitometry, and RUNX2 ChIP results are shown as normalized to control IgG ChIP results. *, p < 0.05 versus pPGS cells. B, wild type and ENPP1−/− primary calvarial cells were cultured with or without ascorbate, and RUNX2 ChIP was assayed as described above. *, p < 0.05 versus ENPP1−/− cells. C, pPGS and pPGS/Enpp1 cells were cultured with or without ascorbate, and Runx2 mRNA levels were measured by real-time PCR. Results are shown as normalized to GAPDH mRNA levels. D, wild type and ENPP1−/− primary cells were cultured with or without ascorbate, and Runx2 mRNA levels were measured by real-time PCR. Results are shown as normalized to GAPDH mRNA levels. *, p < 0.05 versus ENPP1−/− cells. Error bars, S.D.
Next, to determine if the decreased osteoblastic gene expression seen in ENPP1-deficient cells is also mediated by changes in RUNX2 association with chromatin, we performed BSP promoter RUNX2 ChIP in calvarial cells isolated from ENPP1−/− and wild type mice. Results demonstrate that ascorbate treatment promotes RUNX2 association with the BSP gene promoter in primary wild type calvarial cells but not in primary ENPP1−/− calvarial cells (Fig. 9B). We also measured Runx2 mRNA levels in ENPP1−/− and wild type cells and found that Runx2 levels are significantly higher in wild type cells than in ENPP1−/− cells (Fig. 9D). This result indicates that the lower RUNX2 association with the BSP promoter seen in ENPP1−/− cells may be due to lower overall RUNX2 expression levels in these cells. Altogether, our results indicate that RUNX2 association with the bone sialoprotein gene promoter increases with increased Enpp1 gene expression and decreases with decreased Enpp1 gene expression. Future studies are required to determine if changes in RUNX2 expression, location, and/or activity result directly from changes in ENPP1 expression or are secondary to the overall effects of ENPP1 on osteoblast differentiation.
DISCUSSION
ENPP1 is an enzymatic generator of pyrophosphate in differentiated osteoblasts and chondrocytes, and is an established mediator of tissue mineralization. Three mouse models of ENPP1 deficiency indicate that ENPP1 expression is essential for inhibiting soft tissue mineralization (ectopic mineralization) and for promoting hard tissue mineralization (eutopic mineralization). ENPP1-deficient mice were originally described as “tiptoe walking mice” due their abnormal gait resulting from progressive calcification and fusion of multiple joints, including those of the metatarsal bones and phalanges (42). Subsequent studies have revealed that ENPP1-deficient mice (ttw mice, ENPP1−/− mice, and ENPP1C392S mice) develop ectopic mineralization in cartilaginous, ligamentous, vascular, and hepatic tissues (13, 15, 22, 39, 43, 44). That ENPP1 functions to inhibit soft tissue calcification is also evidenced by the fact that humans with inactivating mutations in the gene for ENPP1 develop infantile arterial calcification (45, 46) and ossification of the posterior longitudinal ligament of the spine (47). Pyrophosphate/phosphate tissue concentration ratios control matrix mineralization, and humans and mice with ENPP1 deficiency have low levels of serum pyrophosphate. Therefore, the mechanism by which ENPP1 inhibits ectopic mineralization is likely to be due to low tissue levels of pyrophosphate. Subsequent analysis of the ENPP1−/− mouse has also revealed a role for the bone mineralization inhibitor OPN in mediating the ectopic calcification defects seen in this mouse (20, 39). As stated previously, ENPP1-generated pyrophosphate induces OPN expression. OPN inhibits hydroxyapatite crystal growth; therefore, ENPP1 may also inhibit ectopic mineralization by promoting the expression of OPN (48, 49).
Although much of the previous work investigating the role of Ennp1 in tissue mineralization has focused on the ability of ENPP1 to inhibit ectopic soft tissue mineralization, it is clear that ENPP1 also functions to promote eutopic bone mineralization. As previously mentioned, ttw mice, ENPP1−/− mice, and ENPP1C392S mice show diminished bone mass and bone volume (18, 20, 22). Because ENPP1 and TNAP can function together in differentiated chondrocytes and osteoblasts to locally increase tissue concentration levels of phosphate, the diminished mineralization seen in these mice has been purported to be due to insufficient locally generated inorganic phosphate, yet ENPP1 is also expressed in precursor cells, and the function of ENPP1 in these cells is unknown. Here we demonstrate ENPP1 functions to enhance osteoblast differentiation. MC3T3E1(C4) calvarial preosteoblasts and primary calvarial cells that do not express ENPP1 exhibit diminished osteoblast differentiation upon stimulation with ascorbate, as evidenced by a lack of morphological change, diminished osteoblastic gene expression, an inability to mineralize a collagenous matrix, and diminished RUNX2 association with the bone sialoprotein gene promoter. Although these results are dramatic, it is important to recognize that the extremity of these results may be due to experimental culture conditions. ENPP1−/− mice, ttw mice, and ENPP1C392S mice have deficient bone, but they do have bone and at least partially functional osteoblasts (18, 20–22). It is therefore likely either that ENPP1 is essential for only a subpopulation of osteoblastic precursor cells or that the effects of ENPP1 on osteoblast differentiation are moderated by additional factors in vivo.
In accordance with results showing that decreased ENPP1 expression inhibits osteoblast differentiation, preosteoblastic cells that overexpress ENPP1 show enhanced osteoblastic gene expression and enhanced association of RUNX2 to the BSP promoter upon differentiation with ascorbate. That ENPP1 expression can influence osteoblast differentiation is supported by studies investigating the role of ENPP1 in diabetes and obesity. Gene variants of ENPP1 are associated with insulin resistance, glucose intolerance, and obesity in humans (50, 51), and ENPP1 has been shown to control adipocyte differentiation (52). In direct contrast to increasing expression patterns during osteoblast differentiation, ENPP1 expression decreases with adipocyte differentiation in culture. Additionally, ENPP1 overexpression inhibits adipocyte marker gene expression and adipogenesis in 3T3-L1 preadipocytic cells. Mouse embryonic fibroblasts from ENPP1−/− mice also show enhanced expression of adipocyte marker gene expression. Osteoblasts and adipocytes derive from the same mesenchymal cell lineage, and some mature osteoblasts may even maintain adipocytic potential (53). That ENPP1 functions in mesenchymal precursor cells to control adipocytic versus osteoblastic differentiation is an intriguing idea.
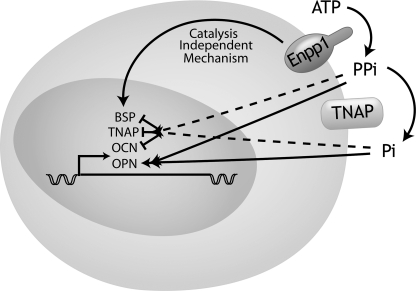
We find that inorganic pyrophosphate induces osteopontin expression in osteoblastic cells. This finding is consistent with previous studies and supports the hypothesis that one of the mechanisms by which ENPP1 controls tissue mineralization is via a pyrophosphate-mediated influence on osteopontin gene expression (20, 34). However, we also find that pyrophosphate inhibits the enhanced bone sialoprotein gene expression seen in ENPP1-overexpressing cells and that treatment with inorganic pyrophosphate or phosphate decreases, as opposed to increases, expression of bone sialoprotein, tissue-nonspecific alkaline phosphatase, and osteocalcin gene expression in ENPP1−/− primary calvarial osteoblastic cells. In addition, here we show that a catalytic inactive version of ENPP1 (Enpp1/T238A) enhances osteoblastic gene expression and matrix mineralization. These findings indicate that ENPP1 also influences osteoblastic gene expression through a mechanism that is independent of phosphate or pyrophosphate generation (Table 1 and Fig. 10). The inhibitory effect of ENPP1 on adipocytic gene expression has been proposed to be mediated by cell-autonomous changes in insulin receptor signaling (52). ENPP1 overexpression inhibits insulin receptor signaling and Akt phosphorylation in response to insulin in adipocytic 3T3-L1 cells. Relevant to our finding that catalytically inactive ENPP1 promotes osteoblast differentiation, the influence of ENPP1 on insulin receptor activity was previously shown to also not require ENPP1 catalytic activity (54). Although insulin receptor signaling has long been known to play a critical role in glucose homeostasis, diabetes, and obesity, recent results demonstrate an additional essential role for insulin receptor signaling in osteoblast maturation and bone formation (55, 56). Future studies are required to determine if the mechanism by which ENPP1 regulates osteoblast differentiation involves changes in insulin receptor signaling.
TABLE 1.
Summary of osteoblastic gene expression regulation by FGF2, ascorbate, ENPP1, phosphate (Pi), and pyrophosphate (PPi)
Shown is change in mRNA expression levels for the indicated genes by culture in medium containing FGF2, ascorbate, Pi, or PPi or change in mRNA expression levels for the indicated genes in osteoblastic cells in which ENPP1 has been suppressed by shRNA or gene targeting or in osteoblastic cells in which wild type or catalytic inactive ENPP1 (Enpp1/T238A) has been overexpressed. Please note that col1a1 mRNA expression patterns during ascorbate-induced osteoblast differentiation are cyclic, although type I collagen production consistently increases over time during osteoblast differentiation.
| Treatment | Effect on osteoblastic gene expression |
|||||
|---|---|---|---|---|---|---|
| Enpp1 | OCN | BSP | TNAP | OPN | Col1a1 | |
| FGF2 treatment | Increased expression (32–34) | |||||
| 6 days of ascorbate treatment | Increased expression | Increased expression | Increased expression | Increased expression | Increased expression | No change or decreased expression |
| Pi treatment | Decreased expression | Decreased expression | Decreased expression | Increased expression (20, 35) | ||
| PPi treatment | Decreased expression | Decreased expression | Decreased expression | Increased expression (20, 34, 39) | ||
| Enpp1 suppression | Decreased expression | Decreased expression | Decreased expression | Decreased expression | Decreased expression (20) | Increased expression (38) |
| Enpp1 overexpression | Increased expression | Increased expression | Increased expression | Increased expression | Decreased expression | |
| Enpp1/T238A overexpression | Increased expression of catalytically inactive Enpp1 | Increased expression | Increased expression | Increased expression | ||
FIGURE 10.
Model of ENPP1 regulation of osteoblastic gene expression. ENPP1 colocalizes with TNAP in the plasma membrane of osteoblastic cells. ENPP1 generates extracellular inorganic pyrophosphate (PPi) through the hydrolysis of nucleotides. Inorganic pyrophosphate is hydrolyzed by TNAP to inorganic phosphate (Pi). Inorganic pyrophosphate and inorganic phosphate increase OPN gene expression but decrease BSP, OCN, and TNAP gene expression. ENPP1 increases BSP, OCN, and TNAP gene expression via a mechanism that is independent of its enzymatic generation of inorganic pyrophosphate and phosphate.
Footnotes
- NTPPPH
- nucleoside triphosphate pyrophosphohydrolase
- ttw
- tiptoe walking mouse/mouse with naturally occurring loss-of-function ENPP1 mutation
- OPN
- osteopontin
- BSP
- bone sialoprotein
- TNAP
- tissue non-specific alkaline phosphatase
- OCN
- osteocalcin
- Col1α1
- collagen type 1, α1.
REFERENCES
- 1. Evans W. H., Hood D. O., Gurd J. W. (1973) Biochem. J. 135, 819–826 [DOI] [PMC free article] [PubMed] [Google Scholar]
- 2. Terkeltaub R., Rosenbach M., Fong F., Goding J. (1994) Arthritis Rheum. 37, 934–941 [DOI] [PubMed] [Google Scholar]
- 3. Johnson K., Moffa A., Chen Y., Pritzker K., Goding J., Terkeltaub R. (1999) J. Bone Miner. Res. 14, 883–892 [DOI] [PubMed] [Google Scholar]
- 4. Johnson K., Vaingankar S., Chen Y., Moffa A., Goldring M. B., Sano K., Jin-Hua P., Sali A., Goding J., Terkeltaub R. (1999) Arthritis Rheum. 42, 1986–1997 [DOI] [PubMed] [Google Scholar]
- 5. Johnson K. A., Hessle L., Vaingankar S., Wennerg C., Mauro S., Narisawa S., Goding J. W., Sano K., Millan J. L., Terkeltaub R. (2000) Am. J. Physiol. Int. Comp. Physiol. 279, R1365–R1377 [DOI] [PubMed] [Google Scholar]
- 6. Fleisch H., Straumann F., Schenk R., Bisaz S., Allgöwer M. (1966) Am. J. Physiol. 211, 821–825 [DOI] [PubMed] [Google Scholar]
- 7. Register T. C., Wuthier R. E. (1985) Bone 6, 307–312 [DOI] [PubMed] [Google Scholar]
- 8. Terkeltaub R. (2006) Purinergic Signal. 2, 371–377 [DOI] [PMC free article] [PubMed] [Google Scholar]
- 9. Johnson K., Pritzker K., Goding J., Terkeltaub R. (2001) J. Rheumatol. 28, 2681–2691 [PubMed] [Google Scholar]
- 10. Johnson K., Hashimoto S., Lotz M., Pritzker K., Goding J., Terkeltaub R. (2001) Arthritis Rheum. 44, 1071–1081 [DOI] [PubMed] [Google Scholar]
- 11. Terkeltaub R. A. (2001) Am. J. Physiol. Cell Physiol. 281, C1–C11 [DOI] [PubMed] [Google Scholar]
- 12. Johnson K., Terkeltaub R. (2005) Front. Biosci. 10, 988–997 [DOI] [PubMed] [Google Scholar]
- 13. Okawa A., Nakamura I., Goto S., Moriya H., Nakamura Y., Ikegawa S. (1998) Nat. Genet. 19, 271–273 [DOI] [PubMed] [Google Scholar]
- 14. Hosoda Y., Yoshimura Y., Higaki S. (1981) Ryumachi 21, Suppl 157–164 [PubMed] [Google Scholar]
- 15. Sakamoto M., Hosoda Y., Kojimahara K., Yamazaki T., Yoshimura Y. (1994) Pathol. Int. 44, 420–427 [DOI] [PubMed] [Google Scholar]
- 16. Hirakawa H., Kusumi T., Nitobe T., Ueyama K., Tanaka M., Kudo H., Toh S., Harata S. (2004) J. Orthop. Sci. 9, 591–597 [DOI] [PubMed] [Google Scholar]
- 17. Koshizuka Y., Ikegawa S., Sano M., Nakamura K., Nakamura Y. (2001) Cytogenet. Cell Genet. 94, 163–168 [DOI] [PubMed] [Google Scholar]
- 18. Okawa A., Goto S., Moriya H. (1999) Calcif. Tissue Int. 64, 239–247 [DOI] [PubMed] [Google Scholar]
- 19. Sali A., Favaloro J. M., Terkeltaub R., Goding J. W. (1999) Ecto-ATPases and Related Ectoenzymes, pp. 267–282, Shaker Publishing BV, Maastricht, The Netherlands [Google Scholar]
- 20. Johnson K., Goding J., Van Etten D., Sali A., Hu S. I., Farley D., Krug H., Hessle L., Millán J. L., Terkeltaub R. (2003) J. Bone Miner. Res. 18, 994–1004 [DOI] [PubMed] [Google Scholar]
- 21. Anderson H. C., Sipe J. B., Hessle L., Dhanyamraju R., Atti E., Camacho N. P., Millán J. L. (2004) Am. J. Pathol. 164, 841–847 [DOI] [PMC free article] [PubMed] [Google Scholar]
- 22. Babij P., Roudier M., Graves T., Han C. Y., Chhoa M., Li C. M., Juan T., Morony S., Grisanti M., Li X., Yu L., Dwyer D., Lloyd D. J., Bass M. B., Richards W. G., Ebeling C., Amato J., Carlson G. (2009) J. Bone Miner. Res. 24, 1552–1564 [DOI] [PubMed] [Google Scholar]
- 23. Hessle L., Johnson K. A., Anderson H. C., Narisawa S., Sali A., Goding J. W., Terkeltaub R., Millan J. L. (2002) Proc. Natl. Acad. Sci. U.S.A. 99, 9445–9449 [DOI] [PMC free article] [PubMed] [Google Scholar]
- 24. Anderson H. C., Harmey D., Camacho N. P., Garimella R., Sipe J. B., Tague S., Bi X., Johnson K., Terkeltaub R., Millán J. L. (2005) Am. J. Pathol. 166, 1711–1720 [DOI] [PMC free article] [PubMed] [Google Scholar]
- 25. Kreiborg S. (1981) Scand. J. Plast. Reconstr. Surg. Suppl. 18, 1–198 [PubMed] [Google Scholar]
- 26. Cohen M. M., Jr., Kreiborg S. (1996) Int. J. Oral Maxillofac. Surg. 25, 45–53 [DOI] [PubMed] [Google Scholar]
- 27. Eswarakumar V. P., Horowitz M. C., Locklin R., Morriss-Kay G. M., Lonai P. (2004) Proc. Natl. Acad. Sci. U.S.A. 101, 12555–12560 [DOI] [PMC free article] [PubMed] [Google Scholar]
- 28. Chen L., Li D., Li C., Engel A., Deng C. X. (2003) Bone 33, 169–178 [DOI] [PubMed] [Google Scholar]
- 29. Zhou Y. X., Xu X., Chen L., Li C., Brodie S. G., Deng C. X. (2000) Hum. Mol. Genet. 9, 2001–2008 [DOI] [PubMed] [Google Scholar]
- 30. Hatch N. E., Nociti F., Swanson E., Bothwell M., Somerman M. (2005) Connect. Tissue Res. 46, 184–192 [DOI] [PubMed] [Google Scholar]
- 31. Hatch N. E., Li Y., Franceschi R. T. (2009) J. Bone Miner. Res. 24, 652–662 [DOI] [PMC free article] [PubMed] [Google Scholar]
- 32. Li Y., Liu J., Hudson M., Kim S., Hatch N. E. (2010) J. Cell Biochem. 111, 1346–1358 [DOI] [PubMed] [Google Scholar]
- 33. James M. J., Järvinen E., Wang X. P., Thesleff I. (2006) J. Bone Miner. Res. 21, 1034–1044 [DOI] [PubMed] [Google Scholar]
- 34. Addison W. N., Azari F., Sørensen E. S., Kaartinen M. T., McKee M. D. (2007) J. Biol. Chem. 282, 15872–15883 [DOI] [PubMed] [Google Scholar]
- 35. Beck G. R., Jr., Zerler B., Moran E. (2000) Proc. Natl Acad Sci. U.S.A. 97, 8352–8357 [DOI] [PMC free article] [PubMed] [Google Scholar]
- 36. Belli S. I., Mercuri F. A., Sali A., Goding J. W. (1995) Eur. J. Biochem. 228, 669–676 [DOI] [PubMed] [Google Scholar]
- 37. Franceschi R. T., Iyer B. S. (1992) J. Bone Miner. Res. 7, 235–246 [DOI] [PubMed] [Google Scholar]
- 38. Polewski M. D., Johnson K. A., Foster M., Millán J. L., Terkeltaub R. (2010) Bone 46, 81–90 [DOI] [PMC free article] [PubMed] [Google Scholar]
- 39. Harmey D., Hessle L., Narisawa S., Johnson K. A., Terkeltaub R., Millán J. L. (2004) Am. J. Pathol. 164, 1199–1209 [DOI] [PMC free article] [PubMed] [Google Scholar]
- 40. Schroeder T. M., Jensen E. D., Westendorf J. J. (2005) Birth Defects Res. C Embryo Today 75, 213–225 [DOI] [PubMed] [Google Scholar]
- 41. Roca H., Phimphilai M., Gopalakrishnan R., Xiao G., Franceschi R. T. (2005) J. Biol. Chem. 280, 30845–30855 [DOI] [PubMed] [Google Scholar]
- 42. Hosoda Y., Yoshimura Y., Higaki S. (1981) Ryumachi 21, (suppl.) 157–164 [PubMed] [Google Scholar]
- 43. Koshizuka Y., Kawaguchi H., Ogata N., Ikeda T., Mabuchi A., Seichi A., Nakamura Y., Nakamura K., Ikegawa S. (2002) J. Bone Miner. Res. 17, 138–144 [DOI] [PubMed] [Google Scholar]
- 44. Johnson K., Polewski M., van Etten D., Terkeltaub R. (2005) Arterioscler. Thromb. Vasc. Biol. 25, 686–691 [DOI] [PubMed] [Google Scholar]
- 45. Rutsch F., Ruf N., Vaingankar S., Toliat M. R., Suk A., Höhne W., Schauer G., Lehmann M., Roscioli T., Schnabel D., Epplen J. T., Knisely A., Superti-Furga A., McGill J., Filippone M., Sinaiko A. R., Vallance H., Hinrichs B., Smith W., Ferre M., Terkeltaub R., Nürnberg P. (2003) Nat. Genet. 34, 379–381 [DOI] [PubMed] [Google Scholar]
- 46. Ruf N., Uhlenberg B., Terkeltaub R., Nürnberg P., Rutsch F. (2005) Hum. Mutat. 25, 98. [DOI] [PubMed] [Google Scholar]
- 47. Nakamura I., Ikegawa S., Okawa A., Okuda S., Koshizuka Y., Kawaguchi H., Nakamura K., Koyama T., Goto S., Toguchida J., Matsushita M., Ochi T., Takaoka K., Nakamura Y. (1999) Hum. Genet. 104, 492–497 [DOI] [PubMed] [Google Scholar]
- 48. Hunter G. K., Kyle C. L., Goldberg H. A. (1994) Biochem. J. 300, 723–728 [DOI] [PMC free article] [PubMed] [Google Scholar]
- 49. Addison W. N., Masica D. L., Gray J. J., McKee M. D. (2010) J. Bone Miner. Res. 25, 695–705 [DOI] [PubMed] [Google Scholar]
- 50. Pizzuti A., Frittitta L., Argiolas A., Baratta R., Goldfine I. D., Bozzali M., Ercolino T., Scarlato G., Iacoviello L., Vigneri R., Tassi V., Trischitta V. (1999) Diabetes 48, 1881–1884 [DOI] [PubMed] [Google Scholar]
- 51. Meyre D., Bouatia-Naji N., Tounian A., Samson C., Lecoeur C., Vatin V., Ghoussaini M., Wachter C., Hercberg S., Charpentier G., Patsch W., Pattou F., Charles M. A., Tounian P., Clément K., Jouret B., Weill J., Maddux B. A., Goldfine I. D., Walley A., Boutin P., Dina C., Froguel P. (2005) Nat. Genet. 37, 863–867 [DOI] [PMC free article] [PubMed] [Google Scholar]
- 52. Liang J., Fu M., Ciociola E., Chandalia M., Abate N. (2007) PLoS One 2, e882. [DOI] [PMC free article] [PubMed] [Google Scholar]
- 53. Yoshiko Y., Oizumi K., Hasegawa T., Minamizaki T., Tanne K., Maeda N., Aubin J. E. (2010) PLoS One 5, e11782. [DOI] [PMC free article] [PubMed] [Google Scholar]
- 54. Grupe A., Alleman J., Goldfine I. D., Sadick M., Stewart T. A. (1995) J. Biol. Chem. 270, 22085–22088 [DOI] [PubMed] [Google Scholar]
- 55. Fulzele K., Riddle R. C., DiGirolamo D. J., Cao X., Wan C., Chen D., Faugere M. C., Aja S., Hussain M. A., Brüning J. C., Clemens T. L. (2010) Cell 142, 309–319 [DOI] [PMC free article] [PubMed] [Google Scholar]
- 56. Ferron M., Wei J., Yoshizawa T., Del Fattore A., DePinho R. A., Teti A., Ducy P., Karsenty G. (2010) Cell 142, 296–308 [DOI] [PMC free article] [PubMed] [Google Scholar]


