Background: Heat shock protein 12 (Hsp12) is produced in response to stress.
Results: We determined structures of Hsp12 in aqueous solution and in the presence of dodecylphosphocholine (DPC) and SDS micelles.
Conclusion: Hsp12 is disordered in water, but forms one helix with DPC and three additional helices with SDS micelles.
Significance: Interaction with a membrane-like surface induces local structure in Hsp12.
Keywords: Heat Shock Protein, Membrane Proteins, Nuclear Magnetic Resonance, Protein Dynamics, Protein Structure, Yeast Physiology
Abstract
Hsp12 (heat shock protein 12) belongs to the small heat shock protein family, partially characterized as a stress response, stationary phase entry, late embryonic abundant-like protein located at the plasma membrane to protect membrane from desiccation. Here, we report the structural characterization of Hsp12 by NMR and biophysical techniques. The protein was labeled uniformly with nitrogen-15 and carbon-13 so that its conformation could be determined in detail both in aqueous solution and in two membrane-mimetic environments, SDS and dodecylphosphocholine (DPC) micelles. Secondary structural elements determined from assigned chemical shifts indicated that Hsp12 is dynamically disordered in aqueous solution, whereas it gains four helical stretches in the presence of SDS micelles and a single helix in presence of DPC. These conclusions were reinforced by circular dichroism spectra of the protein in all three environments. The lack of long range interactions in NOESY spectra indicated that the helices present in SDS micelles do not pack together. R1 and R2, relaxation and heteronuclear NOE measurements showed that the protein is disordered in aqueous solution but becomes more ordered in presence of detergent micelles. NMR spectra collected in presence of paramagnetic spin relaxation agents (5DSA, 16DSA, and Gd(DTPA-BMA)) indicated that the amphipathic α-helices of Hsp12 in SDS micelles lie on the membrane surface. These observations are in agreement with studies suggesting that Hsp12 functions to protect the membrane from desiccation.
Introduction
Heat shock protein 12 (Hsp12),2 a 109-residue protein (12 kDa) encoded by gene HSP12 in Saccharomyces cerevisiae (UniprotKB ID: P22943/HSP12_YEAST), belongs to Pfam family PF04119, which currently contains 74 members with unknown three-dimensional structure. Hsp12 is part of a group of small heat shock proteins (Hsp) that function as chaperone proteins and are ubiquitously involved in nascent protein folding, typically by protecting proteins from misfolding (1–5). The transcriptionally regulated gene expression of Hsp proteins increases when the cells are exposed to extreme environments, such as high and low temperature or other stress (6). Accordingly, Hsp12 is produced by cells in early stationary phase and can be massively induced by oxidative or osmotic stress or by exposing cells to low or high temperatures or to high concentrations of sugar or ethanol (7, 8). Hsp12 has been characterized as a late embryonic abundant-like protein on the basis of its high content of hydrophilic amino acids, high solubility at very high temperatures (80 °C), and induction by osmotic shock (9–11). It has been shown that the Hsp12 gene is activated by the high osmolarity glycerol pathways and negatively regulated by protein kinase A (PKA) (12). Mutational studies suggest that Hsp12 is essential to the formation of a biofilm by the Sardinian wine strain of yeast (13), which contributes to the tolerance of this yeast strain to freezing and high alcohol concentrations (14).
Trehalose is a disaccharide carbohydrate known to play an important role in protecting the cell membrane from dehydration. Trehalose replaces bound water in the membrane and stabilizes the intracellular water structure to preserve the structure and functional integrity of the plasma membrane (15–18). Accumulation of high levels of trehalose and Hsp12 induction in both stressed and stationary phase cells have been implicated in the protective response to heat, cold, high concentration of alcohol, or desiccation. Because both trehalose synthesis and Hsp12 induction are increased by exposing the cells to the same extreme conditions, it has been suggested that they function synergistically. In fact, deletion of the Hsp12 gene results in the accumulation of increased levels of trehalose to maintain intracellular hydration (19).
We report results from solution nuclear magnetic resonance (NMR) spectroscopy, paramagnetic spin relaxation experiments, and circular dichroism (CD) spectroscopy that provide detailed information on the conformational state of Hsp12 in aqueous solution and in a membrane-mimetic environments. In aqueous solution, Hsp12 is dynamically disordered, whereas it forms one helix in the presence of DPC micelles and four helices in the presence of SDS that lie on the surface of the micelle. Another group that carried out more qualitative NMR investigations of Hsp12 in aqueous solution and in the presence of SDS micelles also reported ordering of the protein in the membrane-type environment (20).
EXPERIMENTAL PROCEDURES
Protein Production and Sample Preparation
We expressed the Hsp12 gene from yeast and purified the protein product by the pipeline protocol developed by the Center for Eukaryotic Structural Genomics (21). Briefly, we produced protein samples containing a cleavable N-terminal His6 tag in Escherichia coli cells grown in media supplemented either with 15NH4Cl, for uniform labeling with nitrogen-15, or with 15NH4Cl and 13C-glucose, for uniform labeling with both nitrogen-15 and carbon-13. We isolated protein samples by two-step immobilized metal ion affinity chromatography and added tobacco etch virus protease to cleave the purification tag, which we separated from the Hsp12 protein by gel filtration chromatography. The molecular masses of the purified 15N-labeled and 15N,13C-labeled proteins were determined at the University of Wisconsin-Madison Biotechnology Center by electrospray ionization mass spectrometry on an Applied Biosystems 3200 Q Trap LC/MS/MS system and by matrix-assisted laser desorption/ionization on an Applied Biosystems 4800 MALDI TOF/TOF. Protein identification was carried out by tryptic proteolysis and molecular weight assignment of the generated peptides by using an Agilent 1100 series nanoLC/MSD Trap SL.
We used three paramagnetic spin labels, 5DSA (5-doxyl steric acid free radical), 16DSA (16-doxyl steric acid free radical), and Gd(DTPA-BMA), to identify the interaction between the detergent and the protein. 5DSA and 16DSA were purchased from Sigma-Aldrich, and Gd(DTPA-BMA) was purchased from GE Healthcare, which markets it under the trade name OmniscanTM. Because of their poor aqueous solubility, we dissolved 5DSA and 16DSA separately in methanol and dried the samples overnight under vacuum. To each of these samples (10 mm final spin label concentration) we added 0.2 mm [U-15N]Hsp12 in the presence of 200 mm SDS and incubated the solutions overnight at 40 °C. We added a solution of Gd(DTPA-BMA) directly to yield a sample consisting of 10 mm spin label, 0.2 mm [U-15N]Hsp12, and 200 mm SDS.
NMR Spectroscopy
We recorded all NMR spectra at the National Magnetic Resonance Facility at Madison on Varian VNMRS (600 MHz and 900 MHz) spectrometers equipped with triple-resonance cryogenic probes. The temperature of the sample was regulated at 25 °C for Hsp12 in aqueous solution and 40 °C for Hsp12 in the presence of 200 mm SDS (Hsp12_SDS) or 200 mm DPC (Hsp12_DPC). We collected a series of two- and three-dimensional NMR spectra (22) at 600 MHz for Hsp12, Hsp12_SDS, and Hsp12_DPC for use in assignments. All three samples contained 0.7 mm [U-13C,15N]Hsp12 in NMR buffer with 10 mm MOPS, 100 mm NaCl, 3 mm NaN3, 5 mm DTT, pH 7.0, 95% H2O, 5% D2O; the Hsp12_SDS and Hsp12_DPC samples contained in addition, respectively, 200 mm SDS or 200 mm DPC. We collected 13C-resolved three-dimensional 1H-1H NOESY and 15N-resolved three-dimensional 1H-1H NOESY data on 900 MHz for Hsp12_SDS and 600 MHz for Hsp12_DPC for deriving distance constraints. Raw NMR data were processed with NMRPipe (23) and analyzed using the program XEASY (24). Two-dimensional 1H-15N HSQC and three-dimensional HNCO datasets were used to identify the number of spin systems, and these identifications plus three-dimensional HNCACB and three-dimensional CBCA(CO)NH datasets were used as input to the PINE server (25) to determine sequence specific backbone resonance assignments. In addition, backbone resonance assignments were confirmed on the basis of 15N-resolved 1H-1H NOESY data for Hsp12_SDS and Hsp12_DPC. Two-dimensional 1H-13C HSQC, three-dimensional HBHA(CO)NH, three-dimensional HC(CO)NH, and three-dimensional C(CO)NH experiments were used to assign the side chain and HB and HA resonances for Hsp12_SDS and Hsp_DPC. Three-dimensional 15N-edited 1H-1H NOESY (100-ms mixing time), and three-dimensional 13C-edited 1H-1H NOESY (120 ms) experiments were used to derive the distance constraints to determine the three-dimensional structure of the protein (26). We used standard pulse sequences (27) to record steady-state [1H]-15N NOE and 15N relaxation (T1, T2) data at 600 MHz. We acquired multiple interleaved NMR spectra with relaxation delays of 0, 50, 100, 150, 210, 280, 340, 440, 600, 800, and 1100 ms for T1 and 10, 30, 50, 70, 90, 110, 130, 150, 170, 190, and 210 ms for T2 determinations. The relaxation rates were calculated by least squares fitting of peak heights versus relaxation delay to a single exponential decay. The reported error estimates are standard deviations derived from fitting the data. Steady-state [1H]-15N NOE values were calculated from the ratio of peak heights in a pair of NMR spectra acquired with and without 3-s proton saturation. The signal-to-noise ratio in each spectrum was used to estimate the experimental uncertainty.
Structure Calculations and Analysis
We derived 1H-1H distance restraints from 15N-resolved three-dimensional 1H-1H NOESY and 13C-resolved three-dimensional 1H-1H NOESY spectra. We used TALOS+ software (28) to obtain backbone dihedral angle restraints (ϕ and ψ) from assigned 1Hα, 15N, 13Cα, 13Cβ, and 13C′ chemical shifts and CYANA software version 3.0 (29) for automated NOESY peak assignments and structure calculations. We used MOLMOL (30) and PyMOL (31) software to calculate the root mean square deviation (r.m.s.d.) and for graphical analysis. We used the PSVS server (32) to check structure quality.
RESULTS AND DISCUSSION
Resonance Assignments and Secondary Structure of Hsp12
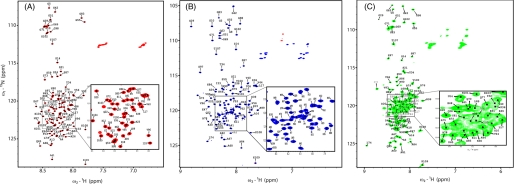
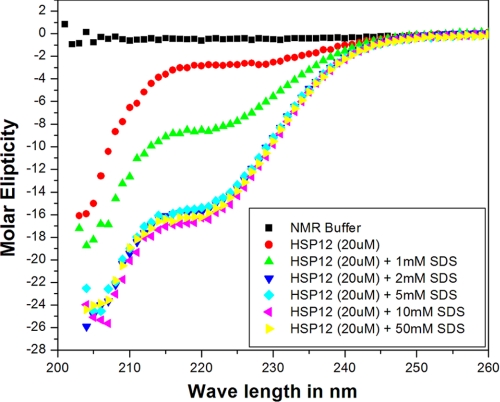
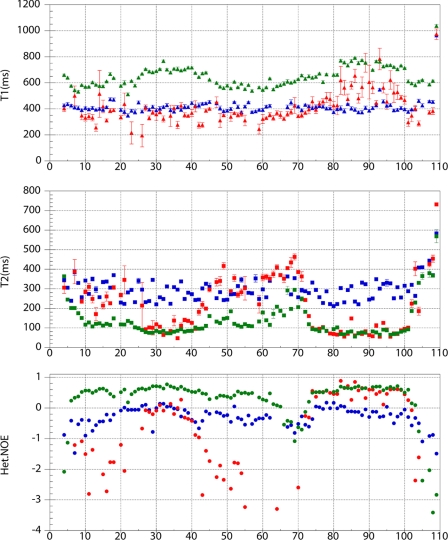
The 15N HSQC spectrum of Hsp12 (Fig. 1A) is characterized by peaks with uniform line width and signal intensity indicating that the protein was suitable for NMR study. However, the poor resonance dispersion in the 1H dimension implied that the protein is natively disordered, which was further confirmed by circular dichroism (Fig. 2), heteronuclear 1H-15N NOE experiments (see Fig. 5), and the lack of long range interactions in 1H-1H NOESY spectra. Traditional triple-resonance datasets were collected to make full sequence-specific backbone resonance assignment for the protein. Comparison of secondary 13Cα chemical shifts with random coil shifts further confirmed that the protein backbone is intrinsically disordered (Fig. 3). Accordingly, the TALOS+ program failed to predict any secondary structural elements. The assigned backbone and CB chemical shifts are available from BioMagResBank under accession code 17483.
FIGURE 1.
Hsp12 is intrinsically disordered in aqueous solution but becomes partly structured in the presence of SDS micelles. A, assigned 1H-15N HSQC spectrum of Hsp12 in aqueous solution at 25 °C. B, assigned 1H-15N HSQC spectrum of Hsp12 in the presence of 200 mm SDS micelles at 40 °C. C, assigned 1H-15N HSQC spectrum of Hsp12 in the presence of 200 mm DPC at 40 °C. All spectra were recorded on a 900 MHz Varian spectrometer equipped with a cryogenic probe.
FIGURE 2.
CD spectrum of Hsp12 as a function of added SDS micelles.
FIGURE 5.
Dynamics of Hsp12 in aqueous solution and in the presence of SDS and DPC micelles. Comparison of T1, T2 and {1H-15N} heteronuclear NOE values for HSP12 at 25 °C (blue symbols), HSP_SDS (green symbols), and HSP12_DPC at 40 °C (red symbols).
FIGURE 3.
Secondary chemical shifts (experimental minus random coil) for Hsp12. A, in aqueous solution. B, in the presence of SDS micelles. C, in the presence of DPC, where the shifts indicate the induction of α-helices as indicated by the cylinders at the bottom.
Resonance Assignments and Secondary Structure of Hsp12_SDS and Hsp12_DPC
We collected a series of 15N HSQC spectra upon adding increasing amounts of SDS or DPC micelles. In both cases, the spectra showed large chemical shift differences indicative of conformational change. However, Hsp12 in presence of SDS micelles at 40 °C (Fig. 1B) showed more uniform signal intensity and peak distribution than in the presence of DPC (Fig. 1C). The induction of helix by added SDS was evident from CD spectra (Fig. 2) and was confirmed by 13Cα secondary chemical shifts (Fig. 3B). Analysis of assigned chemical shifts by both TALOS+ and PINE indicated the presence of four α-helices in presence of SDS and one α-helix in presence of DPC. The assigned chemical shifts are available from BioMagResBank under accession codes 17482 (Hsp12_SDS) and 17948 (Hsp12_DPC).
Structure Determinations of Hsp12_SDS and Hsp12_DPC
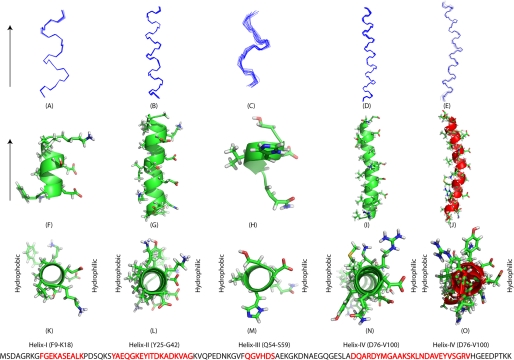
We used advanced NMR techniques in attempting to solve the three-dimensional structure of Hsp12 in the presence of detergent micelles. In the presence of SDS, a total of 1126 distance constraints and 124 dihedral angle constraints derived from TALOS+ (Table 1) were used as input for CYANA structural calculations. The results confirmed the presence of four helical regions, but the software failed to generate a global fold because of the absence of long range NOEs indicating interactions between the α-helices. The individual helices contained the characteristic NOE signatures of α-helices, and by using these constraints we were able to derive a high quality model for the secondary structure. Fig. 4 shows the four well defined α-helices consisting of residues Phe9-Lys18 (αI), Tyr25-Gly42 (αII), Gln54-Ser59 (αIII), and Asp76-Val100 (αIV). The r.m.s.d. for the backbone heavy atoms to the mean coordinates were 0.08 Å for αI, 0.17 Å for αII, 0.41 Å for αIII, and 0.22 Å for αIV (Table 1). Helix αIII was not as well defined as the others as indicated by its r.m.s.d. and 13Cα secondary shifts (Fig. 3). The coordinates of the structural models are available from the Protein Data Bank under accession code of 2L9Q.
TABLE 1.
Statistics of NMR structures of protein Hsp12 in SDS micelles and DPC at 40 °C
| Conformationally restricting distance constraints | SDS | DPC (74–100) |
| Intraresidue (i = j) | 470 | 155 |
| Sequential ((i– j) = 1) | 376 | 104 |
| Medium range (1 < (i – j) ≤ 5) | 282 | 63 |
| Long range ((i – j) > 5) | 0 | 0 |
| Total | 1,128 | 322 |
| Dihedral angle constraints | ||
| ϕ | 62 | 26 |
| ψ | 62 | 26 |
| Number of constraints per residue | 11.4 | 13.8 |
| Number of long range constraints per residue | 0 | 0 |
| CYANA target function (Å) | 2.11 ± 0.16 | 1.52 ± 0.1 |
| Average r.m.s.d. to the mean CYANA coordinates (Å) | ||
| Helix I, backbone heavy (F9-K18) | 0.08 ± 0.04 | |
| Helix I, all heavy atoms (F9-K18) | 0.67 ± 0.15 | |
| Helix II, backbone heavy (Y25-G42) | 0.17 ± 0.05 | |
| Helix II, all heavy atoms (Y25-G42) | 0.66 ± 0.08 | |
| Helix III, backbone heavy (Q54-S59) | 0.41 ± 0.14 | |
| Helix III, all heavy atoms (Q54-S59) | 0.90 ± 0.19 | |
| Helix IV, backbone heavy (D76-V100) | 0.22 ± 0.09 | 0.30 ± 0.14 |
| Helix IV, all heavy atoms (D76-V100) | 0.75 ± 0.11 | 0.83 ± 0.11 |
| PROCHECK raw score (ϕ and Ψ/all dihedral angles) (34) | 0.21/−0.42a | 0.44/−0.24b |
| PROCHECK z-scores (ϕ and Ψ/all dihedral angles) | 1.14/−2.48a | 2.05/−1.42b |
| MOLPROBITY raw score/z-score (35) | 6.05/0.49a | 2.97/1.02b |
| Ramachandran plot summary for ordered residues (%) | ||
| Most favored regions | 97.6a | 96.9b |
| Additionally allowed regions | 2.4 | 3.1 |
| Generously allowed regions | 0.0 | 0.0 |
| Disallowed regions | 0.0 | 0.0 |
| Average number of distance constraints violations per CYANA conformer (Å) | ||
| 0.2–0.5 | 0.0 | 0.0 |
| >0.5 | 0 | 0 |
| Average number of dihedral angle constraint violations per CYANA conformer (º) | 0 | 0 |
a Residues 9–19 (α-helix I), 25–44 (α-helix II), 52–61 (α-helix III), 74–100 (α-helix IV) considered by PSVS server.
b Residues 74–99 (α-helix IV) considered by PSVS server.
FIGURE 4.
Solution NMR structures of the individual α-helices of Hsp12 in presence of SDS micelles and DPC at 40 °C. A–E, backbone superimposed 20 low energy conformers with lowest CYANA target function value. F–J, ribbon diagram with side chains shown in sticks for a low energy conformer with hydrophobic residues on left side and hydrophilic residues on the right side of the helix. K–O, top view of the ribbon diagram for the low energy conformer with side chains showed in stick mode. The primary sequence of Hsp12 is shown at the bottom with α-helical residues in red. Structures E, J, and O are from helix IV of Hsp12 in presence of DPC at 40 °C.
In the presence of DPC, Hsp12 gained a single helix that is similar to helix αIV (Asp76-Val100). A total of 322 distance constraints and 52 dihedral angle constraints derived from TALOS+ were used to generate helix αIV with the backbone r.m.s.d. of 0.31 Å (Fig. 4). The secondary shifts from the CA carbons additionally support the presence of a single helix (Fig. 3C). The coordinates of the structural models are available from the Protein Data Bank under the accession code 2LJL.
Backbone Dynamics of Hsp12, Hsp12_SDS, and Hsp12_DPC
Hsp12 in aqueous solution showed a uniform distribution of T1, T2 values, indicating that the protein backbone has uniform mobility throughout the protein sequence. The short T1 values (∼400 ms), comparable T2 values (∼300 ms), and negative 15N NOEs indicate that the protein backbone is highly dynamic (Fig. 5). Much of this mobility was lost upon the addition of SDS micelles as shown by the longer T1 values (∼600 ms), shorter T2 values (∼100 ms), and positive 15N NOEs (Fig. 5). The T1, T2, and 15N NOE values were uniform across the peptide sequence, apart from few N- and C-terminal residues and residues 65–75, which appear to form a loop. In HSP_DPC, positive 15N NOE values for the residues 74–100 (αIV) additionally support the presence of single α-helix (Fig. 5).
Paramagnetic Spin Relaxation Experiments
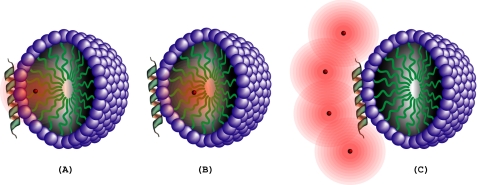
Spin relaxation agents provide tools for identifying membrane-associated and aqueous regions of proteins (33). The strategy behind the use of the three different paramagnetic spin labels is represented pictorially in Fig. 6. We compared 1H-15N HSQC signal intensities in spectra of Hsp12_SDS without and with spin labels. Loss of signal intensity resulting from Gd(DTPA-BMA) identified residues exposed to the solvent. Loss of signal intensity resulting from 5DSA or 16DSA indicated residues facing the SDS micelles. The glycine region of 1H-15N HSQC spectra (Fig. 7) clearly indicates the effect of paramagnetic spin relaxation agents. Amide resonances from residues Gly5, Gly55, Gly63, Gly71, Gly83, and Gly102, which were affected by Gd(DTPA-BMA), were unaffected by 16DSA. However, resonances from residues Gly10, Gly29, and Gly42, which were affected by 16DSA, were not affected by Gd(DTPA-BMA).
FIGURE 6.
Effects of differentially localized paramagnetic spin labels (red dots) on an α-helix lying on the face of a detergent micelle. The polar head groups of the micelle are represented by violet balls and the hydrophobic chains by green lines. The region relaxed by the spin label is indicated by a pink cloud. A, spin label at carbon-5 of an acyl chain (5DSA). B, spin label at carbon-16 of an acyl chain (16DSA). C, spin label in aqueous solution (Gd(DTPA-BMA)).
FIGURE 7.
Effect of shift reagents on glycine 1H-15N HSQC signals of Hsp12 in presence of 200 mm SDS. A, water-soluble shift reagent, 10 mm Gd(DTPA-BMA). B, no shift reagent (control). C, lipid-soluble shift reagent, 10 mm 16DSA. Spectra were recorded at 40 °C on a 900 MHz spectrometer equipped with a cryogenic probe.
CONCLUSIONS
Our extensive structural characterization of Hsp12 by NMR, CD, and paramagnetic relaxation experiments show that Hsp12 is intrinsically disordered in aqueous solution but folds to generate four local α-helices in the presence of SDS micelles or one local α-helix in the presence of DPC. NMR-derived backbone relaxation parameters (T1, T2, and 15N NOE) showed a significant difference between the disordered and folded protein. The effects of added paramagnetic spin labels to Hsp12 in the presence of SDS micelles are consistent with the view that the protein associates with the plasma membrane. A recent, more qualitative, NMR investigation of Hsp12 in the presence of SDS micelles also found that the detergent induced formation of four α-helices (20), but they did not extend their NMR study to other detergent micelles.
Acknowledgments
NMR data were collected at the National Magnetic Resonance Facility (Madison). We thank other staff members of the Center for Eukaryotic Structural Genomics who assisted in preparing the protein sample.
This work was supported, in whole or in part, by National Institutes of Health Grants P41 RR02301, P41 GM66326, and 1U54 GM074901 (to J. L. M.).
The atomic coordinates and structure factors (codes 2L9Q and 2LJL) have been deposited in the Protein Data Bank, Research Collaboratory for Structural Bioinformatics, Rutgers University, New Brunswick, NJ (http://www.rcsb.org/).
- Hsp
- heat shock protein
- DPC
- dodecylphosphocholine
- 5DSA
- 5-doxyl steric acid free radical
- 16DSA
- 16-doxyl steric acid free radical
- Gd(DTPA-BMA)
- 2-[bis[2-[[2-(methylamino)-2-oxoethyl]-(2-oxido-2-oxoethyl)amino]ethyl]amino] acetate gadolinium(3+)
- Hsp12_SDS
- Hsp12 in the presence of SDS micelles
- Hsp12_DPC
- Hsp12 in the presence of DPC
- HSQC
- heteronuclear single-quantum correlation
- r.m.s.d.
- root mean square deviation.
REFERENCES
- 1. Craig E. A. (1993) Science 260, 1902–1903 [DOI] [PubMed] [Google Scholar]
- 2. Hendrick J. P., Hartl F. U. (1993) Annu. Rev. Biochem. 62, 349–384 [DOI] [PubMed] [Google Scholar]
- 3. Martin J., Hartl F. U. (1997) Curr. Opin. Struct. Biol. 7, 41–52 [DOI] [PubMed] [Google Scholar]
- 4. Lindquist S., Craig E. A. (1988) Annu. Rev. Genet. 22, 631–677 [DOI] [PubMed] [Google Scholar]
- 5. Schlesinger M. J. (1990) J. Biol. Chem. 265, 12111–12114 [PubMed] [Google Scholar]
- 6. Tissières A., Mitchell H. K., Tracy U. M. (1974) J. Mol. Biol. 84, 389–398 [DOI] [PubMed] [Google Scholar]
- 7. Praekelt U. M., Meacock P. A. (1990) Mol. Gen. Genet. 223, 97–106 [DOI] [PubMed] [Google Scholar]
- 8. Stone R. L., Matarese V., Magee B. B., Magee P. T., Bernlohr D. A. (1990) Gene 96, 171–176 [DOI] [PubMed] [Google Scholar]
- 9. Mtwisha L., Brandt W., McCready S., Lindsey G. G. (1998) Plant Mol. Biol. 37, 513–521 [DOI] [PubMed] [Google Scholar]
- 10. Sales K., Brandt W., Rumbak E., Lindsey G. (2000) Bba Biomembranes 1463, 267–278 [DOI] [PubMed] [Google Scholar]
- 11. Motshwene P., Karreman R., Kgari G., Brandt W., Lindsey G. (2004) Biochem. J. 377, 769–774 [DOI] [PMC free article] [PubMed] [Google Scholar]
- 12. Varela J. C., Praekelt U. M., Meacock P. A., Planta R. J., Mager W. H. (1995) Mol. Cell. Biol. 15, 6232–6245 [DOI] [PMC free article] [PubMed] [Google Scholar]
- 13. Zara S., Antonio Farris G., Budroni M., Bakalinsky A. T. (2002) Yeast 19, 269–276 [DOI] [PubMed] [Google Scholar]
- 14. Pacheco A., Pereira C., Almeida M. J., Sousa M. J. (2009) Microbiology 155, 2021–2028 [DOI] [PubMed] [Google Scholar]
- 15. Schade B., Jansen G., Whiteway M., Entian K. D., Thomas D. Y. (2004) Mol. Biol. Cell 15, 5492–5502 [DOI] [PMC free article] [PubMed] [Google Scholar]
- 16. Sano F., Asakawa N., Inoue Y., Sakurai M. (1999) Cryobiology 39, 80–87 [DOI] [PubMed] [Google Scholar]
- 17. Park J. I., Grant C. M., Attfield P. V., Dawes I. W. (1997) Appl. Environ. Microbiol. 63, 3818–3824 [DOI] [PMC free article] [PubMed] [Google Scholar]
- 18. Sharma S. C. (1997) FEMS Microbiol. Lett. 152, 11–15 [DOI] [PubMed] [Google Scholar]
- 19. Shamrock V. J., Lindsey G. G. (2008) Can. J. Microbiol. 54, 559–568 [DOI] [PubMed] [Google Scholar]
- 20. Welker S., Rudolph B., Frenzel E., Hagn F., Liebisch G., Schmitz G., Scheuring J., Kerth A., Blume A., Weinkauf S., Haslbeck M., Kessler H., Buchner J. (2010) Mol. Cell 39, 507–520 [DOI] [PubMed] [Google Scholar]
- 21. Tyler R. C., Sreenath H. K., Singh S., Aceti D. J., Bingman C. A., Markley J. L., Fox B. G. (2005) Protein Expr. Purif. 40, 268–278 [DOI] [PubMed] [Google Scholar]
- 22. Sattler M., Schleucher J., Griesinger C. (1999) Prog. NMR Spectr. 34, 93–158 [Google Scholar]
- 23. Delaglio F., Grzesiek S., Vuister G. W., Zhu G., Pfeifer J., Bax A. (1995) J. Biomol. NMR 6, 277–293 [DOI] [PubMed] [Google Scholar]
- 24. Bartels C., Xia T. H., Billeter M., Güntert P., Wüthrich K. (1995) J. Biomol. NMR 6, 1–10 [DOI] [PubMed] [Google Scholar]
- 25. Bahrami A., Assadi A. H., Markley J. L., Eghbalnia H. R. (2009) PLoS Comput. Biol. 5, e1000307. [DOI] [PMC free article] [PubMed] [Google Scholar]
- 26. Kay L. E., Keifer P., Saarinen T. (1992) J. Am. Chem. Soc. 114, 10663–10665 [Google Scholar]
- 27. Farrow N. A., Zhang O., Forman-Kay J. D., Kay L. E. (1995) Biochemistry 34, 868–878 [DOI] [PubMed] [Google Scholar]
- 28. Shen Y., Delaglio F., Cornilescu G., Bax A. (2009) J. Biomol. NMR 44, 213–223 [DOI] [PMC free article] [PubMed] [Google Scholar]
- 29. Güntert P. (2004) Methods Mol. Biol. 278, 353–378 [DOI] [PubMed] [Google Scholar]
- 30. Koradi R., Billeter M., Wüthrich K. (1996) J. Mol. Graph. 14, 51–55 [DOI] [PubMed] [Google Scholar]
- 31. DeLano W. L. (2010) The PyMOL Molecular Graphics System, version 1.3r1, Schrödinger, LLC, New York [Google Scholar]
- 32. Bhattacharya A., Tejero R., Montelione G. T. (2007) Proteins 66, 778–795 [DOI] [PubMed] [Google Scholar]
- 33. Hilty C., Wider G., Fernández C., Wüthrich K. (2004) Chem. Bio. Chem. 5, 467–473 [DOI] [PubMed] [Google Scholar]
- 34. Laskowski R. A., Rullmann J. A., MacArthur M. W., Kaptein R., Thornton J. M. (1996) J. Biomol. NMR 8, 477–486 [DOI] [PubMed] [Google Scholar]
- 35. Davis I. W., Leaver-Fay A., Chen V. B., Block J. N., Kapral G. J., Wang X., Murray L. W., Arendall W. B., 3rd, Snoeyink J., Richardson J. S., Richardson D. C. (2007) Nucleic Acids Res. 35, W375–383 [DOI] [PMC free article] [PubMed] [Google Scholar]


