

Background: Pro-TNFα is transformed into the active/soluble form through proteolysis by TNFα-converting enzyme (TACE).
Results: Genetic ablation of ceramide kinase induces an increase in TACE activity and secreted TNFα.
Conclusion: Ceramide 1-phosphate (C1P) negatively regulates the activity of TACE.
Significance: The TACE/C1P interaction is a viable drug target for the treatment of heart disease and sepsis.
Keywords: Lipids, Lipid-binding Protein, Lipid Synthesis, Sphingolipid, Tumor Necrosis Factor (TNF)
Abstract
Tumor necrosis factor α (TNFα) is a well known cytokine involved in systemic and acute inflammation. In this study, we demonstrate that ceramide 1-phosphate (C1P) produced by ceramide kinase (CERK) is a negative regulator of LPS-induced TNFα secretion. Specifically, bone marrow-derived macrophages isolated from CERK knock-out mice (CERK−/−) generated higher levels of TNFα than the wild-type mice (CERK+/+) in response to LPS. An increase in basal TNFα secretion was also observed in CERK−/− murine embryonic fibroblasts, which was rescued by re-expression of wild-type CERK. This effect was due to increased secretion and not transcription. The secretion of TNFα is regulated by TNFα-converting enzyme (TACE also known as ADAM17), and importantly, the activity of TACE was higher in cell extracts from CERK−/− as compared with wild type. In vitro analysis also demonstrated that C1P is a potent inhibitor of this enzyme, in stark contrast to ceramide and sphingosine 1-phosphate. Furthermore, TACE specifically bound C1P with high affinity. Finally, several putative C1P-binding sites were identified via homology throughout the protein sequence of TACE. These results indicate that C1P produced by CERK has a negative effect on the processing/secretion of TNFα via modulation of TACE activity.
Introduction
Lipopolysaccharide (LPS) is the glycolipid of the outer membrane of Gram-negative bacteria (1–3). Recognition of LPS by immune cells is essential in mounting responses against invading microbes (1, 4); however, hyperactivation of the immune response can also lead to the overwhelming production of tissue-damaging cytokines inducing septic shock. Sepsis or septic shock is a major cause of mortality with ∼120,000 deaths/year in the United States (5), and currently, there are no effective therapeutics available.
LPS is recognized by immune cells via Toll-like receptors. Toll-like receptors are evolutionarily conserved proteins that recognize pathogen-associated molecular patterns (6), and molecular studies coupled with genetic mouse models have identified TLR4 as an essential receptor for LPS signaling (7). Specifically, genetic mouse models lacking key molecules involved in TLR4-mediated signaling are protected from LPS-induced septic shock (8), and one key molecule produced in response to LPS is the proinflammatory/tissue-damaging cytokine, tumor necrosis factor α (TNFα) (9). As alluded above, excessive production of proinflammatory cytokines like TNFα can cause deleterious effects on normal body functions (10). Injection of neutralizing antibodies against TNFα was considered a promising therapeutic approach to block LPS-induced septic shock (11–14), but this therapeutic approach in septic patients did not achieve the same therapeutic efficiency as observed in animal models (15–17). Therefore, characterization of TNFα downstream signaling cascades may aid in developing better therapeutics to modulate inflammatory cascades during the development of sepsis.
With regard to signaling cascades, there are two main levels of regulation for TNFα production/secretion in response to LPS as follows: 1) induction of TNFα synthesis via the NF-κB pathway (18); and 2) induction of TNFα secretion via increased processing (e.g. shedding) of TNFα (19). With regard to secretion/“shedding,” TNFα is produced in the body as pro-TNFα, an inactive precursor of the cytokine in the form of a 233-amino acid membrane-anchored propeptide. Pro-TNFα is transformed into the active and soluble form by limited proteolysis at the Ala76 and Val77 bond by the protease, TNFα-converting enzyme (TACE6/ADAM17) (20).
TACE/ADAM17 belongs to the ADAM family of proteinases, and the enzyme is a type I transmembrane protein synthesized as a zymogen (21). It contains a prodomain, a catalytic domain, a disintegrin and cysteine-rich region, a transmembrane segment, and a cytoplasmic tail (21). Mature, active TACE is sequestered within cholesterol-rich membrane microdomains, otherwise known as lipid rafts or detergent-resistant microdomains (22, 23). Numerous substrates of TACE are localized in these rafts, and depletion of cholesterol from the lipid rafts by cyclodextrin or high density lipoprotein treatment increased the shedding of TACE substrates without increasing TACE activity (24).
As TACE regulates the secretion of TNFα, orally bioavailable TACE inhibitors may have the potential to effectively treat sepsis and other inflammatory diseases by limiting the levels of soluble TNFα release by cells (25). Indeed, inhibition of TACE by small molecular weight compounds has been more effective than TNFα neutralizing antibodies on alleviating septic shock in animal models (26). Hence, researchers are actively pursuing the development of small molecules as orally bioavailable TACE inhibitors (27).
In this study, we find that genetic ablation of the enzyme, ceramide kinase (CERK), leads to a significant increase in TNFα production in response to LPS. Mechanistic studies demonstrate that the increase in TNFα is due to an increase in TNFα processing/shedding. Finally, this study demonstrates that the loss of CERK leads to an increase in TACE activity, and TACE is directly and specifically inhibited by the product of CERK, ceramide 1-phosphate (C1P).
EXPERIMENTAL PROCEDURES
Materials
Macrophage colony-stimulating factor was obtained from Sigma. Dulbecco's modified Eagle's medium (DMEM), RPMI, fetal bovine serum (FBS), and penicillin/streptomycin (100 units/ml penicillin G sodium and 100 μg/ml streptomycin sulfate) were obtained from Invitrogen. HPLC used was a Shimadzu Prominence LC-20-AD system, and the mass spectrometer was a 4000 QTRAP from ABSciex. Prior to mass spectrometric analysis, lipids were separated by reverse phase chromatography using a Phenomenex Kinetex 2.6-μ C18 100A 50 × 2.1-mm reverse phase HPLC column (Torrance, CA). HPLC grade methanol, HPLC grade chloroform, and ACS grade formic acid (EMD Chemicals) were purchased from VWR (Bridgeport, NJ). The TNFα assay kit was obtained from PeproTech. 1-Palmitoyl-2-oleoyl-sn-glycero-3-phosphocholine (POPC), 1-palmitoyl-2-oleoyl-sn-glycero-3-phosphoethanolamine (POPE), 1-oleoyl-2-oleoyl-sn-glycero-3-phosphate, 1-palmitoyl-2-oleoyl-sn-glycero-3-phosphate, C18:1 C1P, C16 C1P, sphingosine 1-phosphate (S1P), C18:1 ceramide, C16 ceramide, the lipid extruder, and 100-nm polycarbonate filters were from Avanti Polar Lipids (Alabaster, AL). Triton X-100, CHAPS, and octyl glucoside were from Sigma and Fisher, respectively. L1 sensor chips were from GE Healthcare. Full-length TACE was obtained from EMD Chemicals, and the fluorogenic substrate was obtained from R&D Systems.
Bone Marrow-derived Macrophages (BMDMs)
Primary monocytes were isolated from CERK+/+ and CERK−/− mice (28) and placed in RPMI 1640 medium containing 10% serum and MCSF at 20 ng/ml for differentiation into BMDMs as described previously (29). For experiments, BMDMs were seeded in 6-well plates (5 × 10⁵ cells/35-mm well), and incubated for 24 h at standard incubator conditions. The BMDMs were then stimulated by LPS (0.5 ng/ml) or treated with PBS sham control. The medium was collected at various times for TNFα quantification. For mass spectrometric quantification of lipids, the BMDM (1 × 10⁶ cells) were grown in 100-mm plates under the same condition as above for the same length of time. The cells were harvested and lipids quantified by HPLC ESI-MS/MS as described previously (30).
Mouse Embryonic Fibroblasts (MEFs)
Primary MEFs were isolated from 13 or 14 days pregnant females, as described previously (31), and grown in high glucose Dulbecco's modified Eagle's medium (Invitrogen) supplemented with 20% fetal bovine serum (Invitrogen) and 2% penicillin/streptomycin (BioWhittaker) at standard incubation conditions. The cells were passaged every 3 days, and after 20 serial passages of the primary MEFs, immortalized MEFs were obtained. For experiments, immortalized MEFs were seeded in 6-well plates (5 × 10⁵ cells/35 mm well) and incubated for 24 h at standard incubator conditions. The medium was changed to Dulbecco's modified Eagle's medium (Invitrogen) supplemented with 2% fetal bovine serum before treatment and TNFα quantification.
TNFα Assay
TNFα levels were measured using mouse TNFα EIA kit (PeproTech) following the manufacturer's instructions. The kit uses a monoclonal antibody to mouse TNFα immobilized on a microtiter plate to bind the mouse TNFα in the samples. After a short incubation, polyclonal antibody to mouse TNFα was added. This antibody bound to the mouse TNFα captured on the plate. After another short incubation, a donkey anti-rabbit IgG conjugated to HRP was added, which bound to the polyclonal mouse TNFα antibody. The reaction was stopped, and the color generated was read at 450 nm using a microplate spectrophotometer (BMG Labtech FLUOStar Optima). The measured optical density was directly proportional to the concentration of TNFα.
RNA Isolation, Reverse Transcription-PCR, and Quantitative PCR
To evaluate the transcript level of TNFα, total RNA from BMDMs was isolated using RNeasy kit (Qiagen) according to the manufacturer's instructions. Total RNA (1 μg) was reverse-transcribed using Superscript III reverse transcriptase (Invitrogen) as described previously (32–38), and the levels of TNFα mRNA transcript were determined using quantitative PCR in accord with the TaqMan technology (Applied Biosystems) (33, 37, 38) specific to TNFα and GAPDH. The cDNA was amplified using ABI 7900HT.
TACE Activity Assay
BMDM cell extracts (10 μg) were diluted in 50 mm Tris, pH 7.9, and incubated with 10 μm of the fluorogenic substrate III (7-methoxycoumarin-PLAQAV-N-3-(2,4-dinitrophenyl)-l-2,3-diaminopropionyl-RSSSR-NH2) as specified by the manufacturer's instructions. For examination of lipid effects on the enzymatic activity of TACE, a Triton X-100 mixed micelle approach was utilized as described previously (39, 39–48). Briefly, recombinant human TACE (0.2 ng/ml) was premixed for 5 min with Triton X-100 micelles (10 times CMC) at 37 °C prior to the addition of substrate. Of note, the addition of Triton X-100 below CMC and ≤20× CMC had no effect on in vitro TACE activity. To prepare the lipid-containing micelles, an appropriate volume of the indicated phospholipids (previously solubilized in an appropriate organic solvent) was dried under nitrogen. Triton X-100 at 20× CMC in TACE assay buffer was added to the dried lipid to produce a 2× concentrated lipid/micelle solution for each designated mol %. The solution was vortexed vigorously for 2 min followed by probe sonication (1 min on and 1 min off for 3 min) on ice. The lipid/micelle solution was then added to the enzyme to a final concentration of 10× CMC for Triton X-100 containing the designated mol % of lipid. The fluorescence emitted from the cleavage product was quantified by spectrofluorometry using excitation and emission wavelength of 320 and 405 nm, respectively and was used to calculate specific activity of TACE following the manufacturer's protocol. The data were plotted using SigmaPlot Version 12 (Systat Software).
Expression of Ceramide Kinase by Adenovirus-mediated Transfection
Recombinant adenovirus for ceramide kinase was generated using Adeno-XTM Tet-Off system (Clontech) followed by purification and titration using Adeno-XTM virus mini purification kit (Clontech) and Adeno-XTM rapid titer kit (Clontech), respectively. For overexpression of CERK, cells were treated with the recombinant CERK adenovirus together with the Tet-Off adenovirus at a multiplicity of infection of 20 as described previously (40). Assays requiring CERK ectopic expression were carried out 48 h postinfection, and expression of CERK was verified by western immunoblotting for the His6 tag.
SPR-binding Protein-Lipid Interaction
All SPR measurements were performed at 25 °C in 20 mm HEPES, pH 7.4, containing 0.16 m KCl as described previously (40, 44–46, 49). Following washing of the sensor chip surfaces, POPC/POPE/X (70:20:10, where X = C1P, PA, S1P, or ceramide) and POPC/POPE (80:20) vesicles were injected at 5 μl/min onto the active surface and the control surface, respectively, to give the same resonance unit (6000 resonance units) values. Under our experimental conditions, no binding to the control surface was detected beyond the refractive index change for all proteins. Each lipid layer was washed three times with 10 μl of 50 mm NaOH at 100 μl/min. Typically, no decrease in lipid signal was seen after the first injection. Equilibrium SPR measurements were done at the flow rate of 5 μl/min to allow sufficient time for the R values of the association phase to reach equilibrium values (Req) for 1 μm TACE (44, 49).
CERK Knock-out Mouse and Animal Welfare Assurances
Breeding pairs for the CERK−/− and wild-type counterparts were obtained from Novartis Pharma as a gracious gift from Dr. Frederic Bornancin. The phenotype and biological characterization of these mice are reported elsewhere by Bornancin and co-workers (28, 51–53). All cells derived from these mice were genetically verified for each presented n for each experiment as described by Bornancin and co-workers (28). Animal experiments were conducted at Virginia Commonwealth University (Virginia Commonwealth University) (Richmond, VA). The research protocol IACUC AM10089 was approved by the Virginia Commonwealth University Institutional Animal Care and Use Committee (IACUC) in accordance with the USDA Animal Welfare Regulations; the Public Health Service Policy on the Humane Care and Use of Laboratory Animals; and The United StatesGovernment Principles for the Utilization and Care of Vertebrate Animals Used in Testing, Research, and Training. Virginia Commonwealth University is in compliance with all provisions of the Animal Welfare Act and other federal statutes and regulations relating to animals. Virginia Commonwealth University is registered under the Animal Welfare Act as a Class “R” Research Facility with the USDA-APHIS-Animal Care (Registration number: 52-R-0007). The Office of Laboratory Animal Welfare has approved the Virginia Commonwealth University's Animal Welfare Assurance in compliance with the United States Public Health Policy (assurance number A3281-01).
RESULTS
Ex Vivo Cells from CERK−/− Mice Secrete Increased Levels of TNFα
Compounds structurally related to C1P have been shown previously to block TNFα production in cells challenged with LPS in culture and also in vivo in septic shock models (54–58). Our laboratory hypothesized that these compounds were acting as C1P mimetics and inhibiting TNFα production via an unknown mechanism. Therefore, our hypothesis infers that TNFα production would be increased in ex vivo cells derived from CERK−/− mice (e.g. cells lacking CERK-derived C1P). To test this hypothesis, MEFs from CERK−/− and CERK+/+ mice were grown under standard incubator conditions, and basal TNFα secretion was analyzed. Fig. 1A demonstrates that secreted TNFα was significantly increased in the media from MEFs derived from the CERK−/− mouse. To verify the phenotype and to specifically examine the role of CERK in the production of TNFα, “rescue” experiments were concomitantly undertaken. Specifically, CERK cDNA was re-introduced in CERK −/− MEFs by adenovirus-mediated transfection, and indeed, re-expression of CERK reduced the levels of secreted TNFα in accord with wild-type cells (Fig. 1A). These data demonstrate that the levels of TNFα are increased due to the specific loss of CERK expression.
FIGURE 1.

Genetic ablation of ceramide kinase increases the levels of TNFα. A, genetic ablation of ceramide kinase increases the levels of TNFα in immortalized MEFs. MEFs (2 × 10⁵ cells) derived from either wild-type mice or CERK−/− mice were seeded overnight in 35-mm plates. The following day, cells were transfected with either control adenovirus (adCMV) (20 multiplicities of infection) or CERK adenovirus (adCERK) (20 multiplicities of infection). After 48 h, cells were then washed and placed in complete media supplemented with 2% FBS. After 4 h, the media were collected and analyzed for TNFα content by ELISA. Data presented is the mean of n = 7 ± S.E. repeated on three separate occasions. Student's t test was used to assess statistical significance (statistical significance = p < 0.01). B, genetic ablation of ceramide kinase increases the levels of TNFα in response to LPS. BMDMs (2 × 10⁵ cells) derived from either wild-type mice or CERK−/− mice were seeded overnight in 35-mm plates. Cells were treated for 0, 4, 8, 24, and 48 h with LPS (0.5 ng/ml). The media were then collected at the appropriate time points and analyzed for TNFα content by ELISA. The data presented are representative of the means ± S.E. of an n = 7 repeated on three separate occasions (asterisk indicates a statistical significance of p < 0.01).
During the course of these studies, Nikolova-Karakashian and co-workers reported a role for ceramide derived from acid sphingomyelinase (aSMase) in LPS-induced secretion of TNFα in primary macrophages (59). This study coupled to our above findings suggested the hypothesis that the conversion of aSMase-derived ceramide to C1P may be a key step in this regulatory mechanism. To determine whether CERK regulated the production of TNFα in a relevant cell model and for comparison with the Nikolova-Karakashian studies(59), we utilized primary BMDMs to determine whether loss of CERK produced the same phenotype. The treatment of BMDMs with LPS induced TNFα secretion, with a maximum production after 8 h of treatment (Fig. 1B). However, TNFα levels were significantly elevated in CERK−/− macrophages as compared with CERK+/+ cells analogous to the findings of Nikolova-Karakashian and co-workers (59) with the aSMase ablation model (Fig. 1B). These results suggest that the conversion of ceramide to C1P is a key step in the secretion of TNFα.
CERK Deficiency Does Not Affect the Rate of Synthesis for TNFα mRNA
Nikolova-Karakashian and co-workers (59) reported that genetic ablation of aSMase affected the secretion/processing of TNFα and not the synthesis of TNFα mRNA. To determine whether the differences in TNFα levels upon LPS stimulation were due to a change in the transcription rate of TNFα, the levels of TNFα mRNA from CERK−/− and CERK+/+ BMDMs challenged with LPS were analyzed by quantitative PCR. CERK deficiency did not have the effect of increasing the rate of synthesis of TNFα mRNA (Fig. 2A).
FIGURE 2.
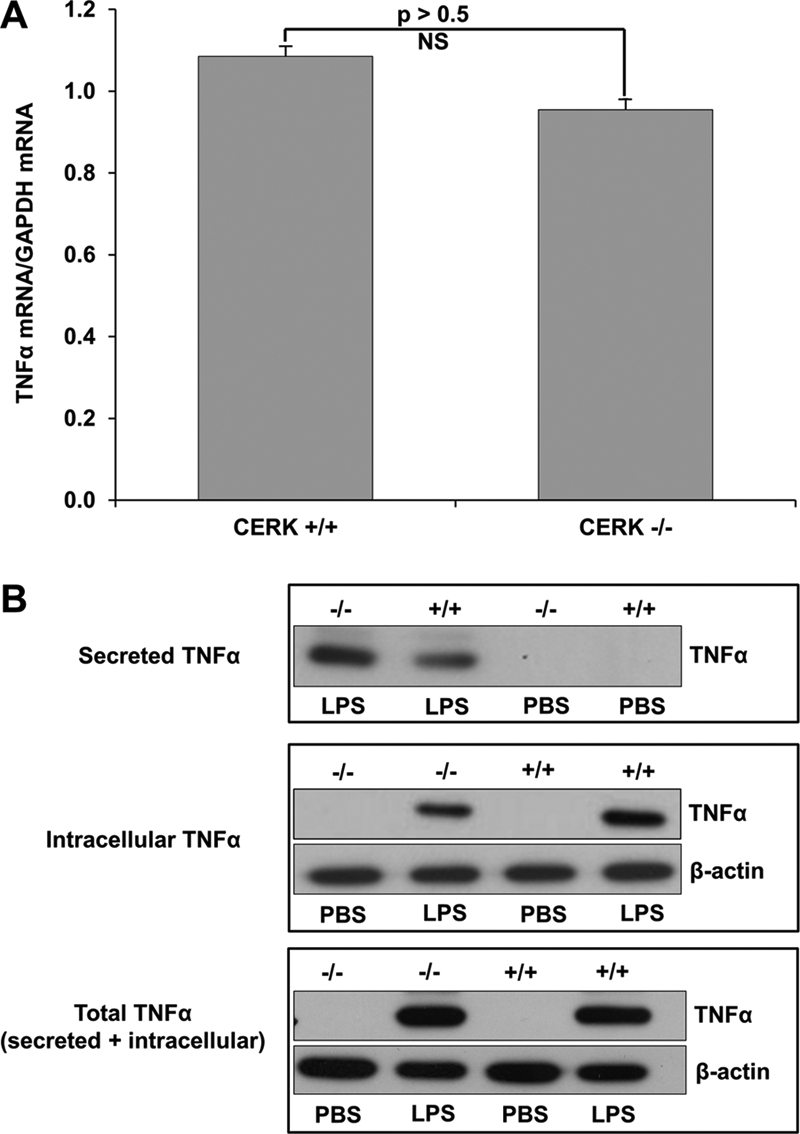
TNFα secretion but not expression is significantly different in CERK null macrophages compared with wild type. Primary monocytes isolated from the bone marrow of CERK null mice and their wild-type littermates were differentiated into BMDMs as described under “Experimental Procedures.” The BMDMs (5 × 10⁵ cells), thus obtained, were seeded overnight in 35-mm plates. Cells were then treated with LPS (0.5 ng/ml) or PBS sham, and total RNA and protein were harvested 4 h post-treatment. A, TNFα and GAPDH mRNA levels were quantified via quantitative PCR with TNFα mRNA levels normalized to GAPDH expression. Data presented in this figure are the means of three separate experiments ± S.E. (n = 3). B, protein extracts from cells (10 μg) (labeled as Intracellular TNFα) or media (20 μl of cell media) (labeled as Secreted TNFα) were subjected to SDS-PAGE and Western immunoblotting analysis for TNFα and β-actin expression. Of note: the cell media demonstrated no β-actin expression (data not shown). The lower panel labeled Total TNFα represents a mixture of cell extracts (5 μg) combined with cell media (10 μl) from the same samples utilized to generate the data presented in the upper panels. Data presented in this figure are representative of n = 6 on two separate occasions.
As the loss of CERK did not have an effect on the transcription rate of TNFα mRNA, we examined whether the amount of TNFα secreted by shedding was increased in CERK−/− BMDMs subjected to LPS. Indeed, the amount of TNFα retained in the CERK−/− BMDMs was significantly less than the CERK+/+ BMDMs (Fig. 2B). These data correlated with an increase in the amount of TNFα secreted into the media by CERK−/− BMDMs exposed to LPS in comparison with CERK+/+ BMDMs (Fig. 2B). Furthermore, the total levels of TNFα (when the cell and media extracts are combined) were not significantly different between CERK−/− and CERK+/+ BMDMs. Therefore, these data demonstrate a role for CERK-derived C1P in the post-translational mechanism of TNFα processing/shedding in response to LPS.
Enzymatic Activity of TACE Is Higher in BMDMs from CERK−/− Mice
The maturation process of TNFα is regulated by the protease, ADAM17, also known as TNFα converting enzyme (TACE). Nikolova-Karakashian and co-workers (59) reported that TACE activity was higher in ex vivo cells from aSMase−/− mice (36). To determine whether the increased TNFα secretion in CERK−/− cells was due to differences in TACE activity, we examined the TNFα converting activity of the enzyme in BMDM extracts from CERK−/− and CERK+/+ mice. CERK−/− BMDMs exhibited higher TACE activity as compared with their respective CERK +/+ control cells (Fig. 3A). These differences were not due to alterations in TACE protein content as Western blot analysis of TACE protein in macrophages from CERK+/+ and CERK−/− mice did not show any genotype-related differences (Fig. 3B). However, as expected, CERK−/− BMDM contained significantly lower amounts of the major CERK-derived C1P species (d18:1/16:0 and d18:1/24:1 C1P) compared with CERK+/+ BMDM (Fig. 3C), suggesting that the increase in TACE activity is related to the cellular levels of CERK-derived C1P. Although the d18:1/16:0 ceramide levels were higher for these BMDM compared with wild type, the total ceramide was not significantly changed between the two cell types (Fig. 3D) arguing against a direct role for ceramide in the regulation of TACE activity. Insignificant differences were also observed between the two cell types for the total levels of the sphingolipids, d18:1 monohexosyl ceramides, sphingomyelins, sphingosine, sphinganine, sphingosine 1-phosphate, and sphinganine 1-phosphate (Fig. 3, E–J). These data demonstrate that CERK-derived C1P negatively regulates the activity of TACE, which would explain the effects of CERK ablation on secreted TNFα levels.
FIGURE 3.

Higher levels of TACE enzymatic activity are observed in primary macrophages isolated from CERK null mice. A, primary monocytes isolated from the bone marrow of CERK null mice and their wild-type littermates were differentiated into BMDMs and treated with LPS concentration (0.5 ng/ml) for 4 h as described under “Experimental Procedures.” Protein homogenates were harvested from these cells, and TACE specific activity (units of emission at 405 nm of cleaved fluorogenic substrate/20 min/10 μg of protein homogenate) was measured as described under “Experimental Procedures.” The data are representative of the mean ± S.E. of an n = 6 repeated on three separate occasions. B, mixture of cell extract (5 μg) combined with cell media (10 μl) (from Fig. 2B, lower panel) were subjected to SDS-PAGE and Western immunoblotting analysis for TACE and β-actins. Note: the depicted β-actin data show an exact match to the β-actin data depicted in Fig. 2B, lower panel, as the same Western immunoblot utilized in this figure was stripped and reprobed for TACE expression. C–J, primary monocytes isolated from the bone marrow of CERK null mice and their wild-type littermates were differentiated into BMDMs. Lipids were extracted from these cells 24 h later, and the lipids species of interest were quantified via HPLC ESI-MS/MS as described under “Experimental Procedures.” C, ceramide 1-phosphate levels are represented in units of picomoles per 1 × 10⁶ cells and are the means of n = 6 of individual experiments ± S.D. Student's t test was used to assess statistical significance (*, p < 0.05; **, p < 0.01). D, ceramides were also measured from the same samples and are similarly represented in units of picomoles per 1 × 10⁶ cells and are the means of n = 6 individual experiments ± S.D. Student's t test was used to assess statistical significance (*, p < 0.05; **, p < 0.01). E, monohexosyl ceramide levels represented as the mean of three experiments ± S.D. and given in units of picomoles per 1 × 10⁶ cells. Student's t test was used to assess statistical significance (*, p < 0.05). F, sphingomyelin levels represented as the mean of three experiments ± S.D. and given in units of picomoles per 1 × 10⁶ cells. Student's t test was used to assess statistical significance (*, p < 0.05). G, sphingosine levels represented as the mean of three experiments ± S.D. and given in units of picomoles per 1 × 10⁶ cells. Student's t test was used to assess statistical significance (*, p < 0.05). H, sphinganine levels represented as the mean of three experiments ± S.D. and given in units of picomoles per 1 × 10⁶ cells. Student's t test was used to assess statistical significance (NS means not significant). I, sphingosine 1-phosphate levels represented as the mean of three experiments ± S.D. and given in units of picomoles per 1 × 10⁶ cells. Student's t test was used to assess statistical significance. J, sphinganine 1-phosphate levels represented as the mean of three experiments ± S.D. and given in units of picomoles per 1 × 10⁶ cells.
Ceramide 1-Phosphate Is a Specific Inhibitor of TACE in Vitro
Previously, our laboratory demonstrated that C1P binds to the C2 domain of group IV phospholipase A2 (cPLA2α) at a cationic patch (Arg57, Lys58, and Arg59) in the β-groove (43, 44, 46, 48). As our data suggested that CERK regulated TACE activity, we examined the primary sequence of TACE for possible C1P interaction sites. Indeed, several potential C1P-binding motifs were identified in TACE (Fig. 4A) suggesting that C1P directly interacts with the enzyme to affect the enzymatic activity.
FIGURE 4.

Ceramide 1-phosphate is a direct and specific inhibitor of TACE. A, TACE demonstrates the presence of highly conserved sequences homologous to the C1P-binding site of cytosolic phospholipase A2. The primary structure of human TACE was scrutinized for a potential C1P-binding site in the form of three to four consecutive basic amino acids. Six such sequences were observed from 53 to 58 (N-terminal prodomain), 210 to 215 (mature TACE), 233 to 237 (mature TACE), 625 to 628 (mature TACE), 640 to 645 (mature TACE), and 753 to 758 (mature TACE). A multiple alignment of the corresponding region revealed several highly conserved motifs. B, effect of phospholipids on in vitro TACE activity. TACE activity was measured in vitro using human recombinant TACE enzyme and fluorogenic substrate as described using a Triton X-100 mixed micelle approach to deliver the individual lipids (26). C18:1/18:1 C1P, dioleoyl PA, S1P, and C18:1/18:1 ceramide was used at the designated mol % in regard to Triton X-100. The data are plotted as the mol % of the specific lipid versus TACE specific activity (picomoles of cleaved fluorogenic substrate/min/μg of recombinant TACE protein). The data are representative of the mean ± S.E. of an n = 7 repeated on three separate occasions. C, acyl chain length requirement of C1P for inhibition of TACE activity. TACE activity was measured in vitro using human recombinant TACE enzyme and fluorogenic substrate as described using a Triton X-100 mixed micelle approach to deliver the individual lipids (26). The fluorescence was monitored over time on a fluorescence plate reader. C18:1/2:0 (C2:0 C1P), C18:1/8:0 (C8:0 C1P), C18:1/12:0 (C12:0 C1P), C18:1/16:0 (C16:0 C1P), C18:1/18:1 (C18:1 C1P), and C18:1/24:0 (C24:0 C1P)C1P was used at 0.6 mol % with respect to Triton X-100. The data are plotted as the treatment of the specific lipid and controls versus TACE specific activity (picomoles of cleaved fluorogenic substrate/min/μg of recombinant TACE protein). The data are representative of the mean ± S.E. of an n = 4 repeated on two separate occasions.
To determine whether C1P directly affects TACE activity, we analyzed the in vitro activity of the enzyme in the presence of C1P (d-e-C18:1/16:0 C1P). Fig. 4B demonstrates that C1P is a potent inhibitor of TACE inducing >90% inhibition at 0.85 mol %. With ∼120 molecules of Triton X-100 per micelle, this equates to an estimated stoichiometry of one C1P molecule/micelle to inactivate TACE. More importantly, this inhibitory effect was highly specific as the closely related lipids such as ceramide and S1P had no effect on TACE activity (Fig. 4B). Furthermore, the more soluble dioeloyl-PA was only a minor inhibitor of the enzyme failing to reach the IC50 value of the enzymatic activity (Fig. 4B). Thus, C1P is a direct, specific, and potent inhibitor of TACE activity.
As mainly the C18:1/16:0 subspecies of C1P was reduced in the CERK−/− BMDMs, we further characterized the chain length specificity of C1P inhibition of TACE activity. Fig. 4C demonstrates that TACE activity is equally inhibited by the C1P subspecies, d-e-C18:1/12:0 C1P, d-e-C18:1/16:0 C1P, d-e-C18:1/18:1 C1P, and d-e-C18:1/24:0 C1P. d-e-C18:1/8:0 C1P significantly inhibited TACE but to a lesser extent than the longer C1P subspecies. d-e-C18:1/2:0 C1P had a minor effect on TACE enzyme activity, which was even less than the effect of PA at the same mol %. These data demonstrate that C1P inhibition of TACE requires an acyl chain of ≥12 carbons for full inhibitory activity. Furthermore, these data also demonstrate that the inhibition of TACE enzyme activity by C1P is irrespective of the saturation state of the acyl chain.
Ceramide 1-Phosphate Specifically and Directly Interacts with TACE
To quantitatively determine the affinity of TACE for liposomes harboring C1P, PA, S1P, and ceramide, we employed a robust analysis by SPR. In these experiments, an active surface was coated with POPC/POPE/X (70:20:10 X = C1P, S1P, PA, or ceramide), whereas a control surface was coated with POPC/POPE (80:20). TACE was injected at 1 μm across the active surfaces to determine the relative binding for each of the lipids. As shown in Fig. 5, A and B, TACE only displayed detectable and significant binding to liposomes containing C1P. As with the effect of C1P subspecies on TACE enzyme activity, the interaction of C1P was irrespective of the saturation state of the acyl chain, and the interaction also required a ≥12 carbon acyl chain for high affinity to be observed (Fig. 5C). Hence, C1P specifically and directly binds to TACE.
FIGURE 5.

Ceramide 1-phosphate directly and specifically interacts with TACE. A, representative sensorgrams for 1 μm WT TACE injected over an active surface of either C18:1/16:0 C1P (C16 C1P), C18:1/2:0 C1P (C2 C1P), dioleoyl-PA (PA), S1P, or C18:1/16:0 ceramide (C16 Cer) subtracting the POPC/POPE control surface. B, data were collected in triplicate and averaged as shown by the bar graphs for C18:1/16:0 C1P (C16 C1P), dioleoyl-PA (PA), S1P, or C18:1/16:0 ceramide (C16 Cer). Error bars represent the standard deviation from each of the independent trials. A Student's t test was employed to assess the statistical significance of the results (*, p < 0.05). ns = not significant. C, chain length specificity of TACE was investigated for C18:1/8:0 (C8), C18:1/16:0 (C16), and C18:1/18:1 (C18:1) C1P using SPR as in A and B.
DISCUSSION
In this report, our laboratory found that CERK and its product C1P play a role in the suppression of TNFα production. Specifically, we found that genetic ablation of CERK led to an increase in the amount of TNFα released, basally in MEFs and in response to LPS in primary macrophages. Indeed, these studies complement the recent report by Nikolova-Karakashian and co-workers (59), which demonstrated that genetic ablation of acid sphingomyelinase (aSMase) gave the same phenotype in primary macrophages as we observed in CERK−/− cells. Hence, the culmination of this report and the studies presented here strongly suggest that CERK utilizes ceramide generated by aSMase in response to LPS.
Our study also suggests that the topography in the cell of C1P is most important for the inhibition of TACE. Specifically, we found that the in vitro inhibition of TACE was irrespective of the acyl chain length and saturation state of long chain C1P subspecies (e.g. d-e-C18:1/16:0 C1P versus d-e-C18:1/24:1 C1P). As our data coupled with the findings of Nikolova-Karakashian and co-workers (59) strongly suggest that CERK utilizes ceramide-derived from aSMase, the subcellular compartment suggested is the lysosomes. Indeed, CERK has a pH optimum below pH 7.0 (61), and thus, it is not heretical that C1P may be generated in a low pH environment preferred by aSMase. Suggesting a separate subcellular compartment are the reports that TACE is localized to the cell surface and endosomes (62) and has a pH optimum of >7.0 for activity (63). CERK and aSMase have been reported to reside in both of these subcellular compartments (50, 64, 65). Thus, two likely scenarios exist as follows: 1) CERK utilizes ceramide derived by aSMase at the plasma membrane to block the activity of TACE, and 2) aSMase-derived ceramide is generated in the endosomes where CERK generates C1P and sequesters TACE to block its “sheddase” activity. Overall, these are intriguing metabolic studies to undertake in the future to delineate this anabolic paradigm.
During the preparation of this manuscript for publication, a research study was reported (60), which suggested a role for ceramide generation as well as CERK in the production of TNFα. Indeed, our genetic ablation findings in Fig. 1A corroborate the siRNA portion of this study, while also greatly extending the mechanism in several ways. First, we show in a physiologically relevant cell model, primary macrophages, that CERK plays a role in TNFα production. Second, we demonstrate that CERK and C1P regulate the shedding of TNFα and not the synthesis of TNFα mRNA. We further extend the mechanism to demonstrate that C1P is a direct and specific inhibitor of TACE/ADAM17. As to the latter, TACE contains conserved motifs for the interaction with C1P, and finally, we show that C1P specifically interacts with TACE with high affinity. This direct interaction of TACE with C1P explains the lack of direct inhibition of TACE by ceramide in the report from Nikolova-Karakashian and co-workers (59) suggesting that the generation of aSMase-derived ceramide is upstream of CERK and C1P generation in this paradigm. Overall, the culmination of this study and as well as relevant studies in the literature (59) suggest a mechanism by which TNFα processing/secretion is suppressed or possibly “shut down” in the basal state by a pathway involving aSMase coupled to CERK generating C1P for the inhibition of TACE/ADAM17.
Physiologically, the findings in this study may explain the anti-inflammatory effects of several C1P analogs. Specifically, two C1P analogs pCERA-1 and ONO-SM-362 inhibit the production of TNFα in cell and animal models (54–56). Therefore, validation of the C1P interaction site is of key importance, and it would allow for the testing of the hypothesis that C1P analogs are blocking TNFα production in cells and in vivo via direct inhibition of TACE enzymatic activity. C1P and its analogs may also have roles in sequestering TACE or blocking its proteolytic maturation as a putative C1P-binding site is also found in the N-terminal prodomain. This interaction may serve to keep the N terminus of the protein bound to the membrane and block the proteolytic removal of the prodomain by the protease furin. This would be a very intriguing and novel mechanism that warrants further exploration, and identification of the exact C1P interaction site by mutagenesis studies will aid in this endeavor.
In conclusion, this study demonstrates a role for CERK and C1P in suppressing TNFα maturation and secretion. Furthermore, this mechanism is linked to the direct and specific inhibition of TACE/ADAM17, which we show by homology contains a putative C1P-binding site. These findings may explain the anti-inflammatory effects mediated by C1P analogs and suggest that the interaction of TACE with C1P is a possible therapeutic target for combating sepsis.
Acknowledgments
We thank Dr. Frederick Bornancin of Novartis Pharma for providing breeding pairs of the CERK−/− mouse along with wild-type counterparts. Virginia Commonwealth University was recipient of National Institutes of Health Grant NH1C06-RR17393 (for renovation).
This work was supported, in whole or in part, by National Institutes of Health Grants HL072925 and CA117950 (to C. E. C.). This work was also supported by a research grant supplied by ONO Pharmaceutical Co., Ltd. (to C. E. C.) and by American Heart Association Grant SDG0735350N (to R. V. S.).
- TACE
- TNFα-converting enzyme
- C1P
- ceramide 1-phosphate
- CERK
- ceramide kinase
- BMDM
- bone marrow-derived macrophage
- MEF
- murine embryonic fibroblasts
- SPR
- surface plasmon resonance
- POPC
- 1-palmitoyl-2-oleoyl-sn-glycero-3-phosphocholine
- POPE
- 1-palmitoyl-2-oleoyl-sn-glycero-3-phosphoethanolamine
- aSMase
- acid sphingomyelinase
- S1P
- sphingosine 1-phosphate
- CMC
- critical micelle concentration
- PA
- phosphatidic acid
- d-e-
- d-erythro-.
REFERENCES
- 1. Watson R. W., Redmond H. P., Bouchier-Hayes D. (1994) J. Leukocyte Biol. 56, 95–103 [DOI] [PubMed] [Google Scholar]
- 2. Raetz C. R., Whitfield C. (2002) Annu. Rev. Biochem. 71, 635–700 [DOI] [PMC free article] [PubMed] [Google Scholar]
- 3. Raetz C. R. (1990) Annu. Rev. Biochem. 59, 129–170 [DOI] [PubMed] [Google Scholar]
- 4. Cohen J. (2002) Nature 420, 885–891 [DOI] [PubMed] [Google Scholar]
- 5. Martin G. S., Mannino D. M., Eaton S., Moss M. (2003) N. Engl. J. Med. 348, 1546–1554 [DOI] [PubMed] [Google Scholar]
- 6. Takeda K., Kaisho T., Akira S. (2003) Annu. Rev. Immunol. 21, 335–376 [DOI] [PubMed] [Google Scholar]
- 7. Lu Y. C., Yeh W. C., Ohashi P. S. (2008) Cytokine 42, 145–151 [DOI] [PubMed] [Google Scholar]
- 8. Akira S. (2000) Biochem. Soc. Trans. 28, 551–556 [DOI] [PubMed] [Google Scholar]
- 9. Lin W. J., Yeh W. C. (2005) Shock 24, 206–209 [DOI] [PubMed] [Google Scholar]
- 10. Ramesh G., Reeves W. B. (2002) J. Clin. Invest. 110, 835–842 [DOI] [PMC free article] [PubMed] [Google Scholar]
- 11. Beutler B., Milsark I. W., Cerami A. C. (1985) Science 229, 869–871 [DOI] [PubMed] [Google Scholar]
- 12. Bhola M., Goto M., Chen H. Y., Myers T. F. (2000) Biol. Neonate 78, 207–211 [DOI] [PubMed] [Google Scholar]
- 13. Hinshaw L. B., Tekamp-Olson P., Chang A. C., Lee P. A., Taylor F. B., Jr., Murray C. K., Peer G. T., Emerson T. E., Jr., Passey R. B., Kuo G. C. (1990) Circ. Shock 30, 279–292 [PubMed] [Google Scholar]
- 14. Tracey K. J., Fong Y., Hesse D. G., Manogue K. R., Lee A. T., Kuo G. C., Lowry S. F., Cerami A. (1987) Nature 330, 662–664 [DOI] [PubMed] [Google Scholar]
- 15. Abraham E., Anzueto A., Gutierrez G., Tessler S., San Pedro G., Wunderink R., Dal Nogare A., Nasraway S., Berman S., Cooney R., Levy H., Baughman R., Rumbak M., Light R. B., Poole L., Allred R., Constant J., Pennington J., Porter S. (1998) Lancet 351, 929–933 [PubMed] [Google Scholar]
- 16. Abraham E., Laterre P. F., Garbino J., Pingleton S., Butler T., Dugernier T., Margolis B., Kudsk K., Zimmerli W., Anderson P., Reynaert M., Lew D., Lesslauer W., Passe S., Cooper P., Burdeska A., Modi M., Leighton A., Salgo M., Van der Auwera P. (2001) Crit. Care Med. 29, 503–510 [DOI] [PubMed] [Google Scholar]
- 17. Panacek E. A., Marshall J. C., Albertson T. E., Johnson D. H., Johnson S., MacArthur R. D., Miller M., Barchuk W. T., Fischkoff S., Kaul M., Teoh L., Van Meter L., Daum L., Lemeshow S., Hicklin G., Doig C. (2004) Crit. Care Med. 32, 2173–2182 [DOI] [PubMed] [Google Scholar]
- 18. Collart M. A., Baeuerle P., Vassalli P. (1990) Mol. Cell. Biol. 10, 1498–1506 [DOI] [PMC free article] [PubMed] [Google Scholar]
- 19. Horiuchi K., Kimura T., Miyamoto T., Takaishi H., Okada Y., Toyama Y., Blobel C. P. (2007) J. Immunol. 179, 2686–2689 [DOI] [PubMed] [Google Scholar]
- 20. Hoareau L., Bencharif K., Rondeau P., Murumalla R., Ravanan P., Tallet F., Delarue P., Cesari M., Roche R., Festy F. (2010) J. Inflamm. 7:1. [DOI] [PMC free article] [PubMed] [Google Scholar]
- 21. Black R. A., Rauch C. T., Kozlosky C. J., Peschon J. J., Slack J. L., Wolfson M. F., Castner B. J., Stocking K. L., Reddy P., Srinivasan S., Nelson N., Boiani N., Schooley K. A., Gerhart M., Davis R., Fitzner J. N., Johnson R. S., Paxton R. J., March C. J., Cerretti D. P. (1997) Nature 385, 729–733 [DOI] [PubMed] [Google Scholar]
- 22. Tellier E., Canault M., Poggi M., Bonardo B., Nicolay A., Alessi M. C., Nalbone G., Peiretti F. (2008) J. Cell. Physiol. 214, 687–693 [DOI] [PubMed] [Google Scholar]
- 23. Wakatsuki S., Kurisaki T., Sehara-Fujisawa A. (2004) J. Neurochem. 89, 119–123 [DOI] [PubMed] [Google Scholar]
- 24. Tellier E., Canault M., Rebsomen L., Bonardo B., Juhan-Vague I., Nalbone G., Peiretti F. (2006) Exp. Cell Res. 312, 3969–3980 [DOI] [PubMed] [Google Scholar]
- 25. DasGupta S., Murumkar P. R., Giridhar R., Yadav M. R. (2009) Bioorg. Med. Chem. 17, 444–459 [DOI] [PubMed] [Google Scholar]
- 26. Newton R. C., Solomon K. A., Covington M. B., Decicco C. P., Haley P. J., Friedman S. M., Vaddi K. (2001) Ann. Rheum. Dis. 60, iii25–iii32 [DOI] [PMC free article] [PubMed] [Google Scholar]
- 27. Le G. T., Abbenante G. (2005) Curr. Med. Chem. 12, 2963–2977 [DOI] [PubMed] [Google Scholar]
- 28. Graf C., Zemann B., Rovina P., Urtz N., Schanzer A., Reuschel R., Mechtcheriakova D., Müller M., Fischer E., Reichel C., Huber S., Dawson J., Meingassner J. G., Billich A., Niwa S., Badegruber R., Van Veldhoven P. P., Kinzel B., Baumruker T., Bornancin F. (2008) J. Immunol. 180, 3457–3466 [DOI] [PubMed] [Google Scholar]
- 29. Eske K., Breitbach K., Köhler J., Wongprompitak P., Steinmetz I. (2009) J. Immunol. Methods 342, 13–19 [DOI] [PubMed] [Google Scholar]
- 30. Wijesinghe D. S., Allegood J. C., Gentile L. B., Fox T. E., Kester M., Chalfant C. E. (2010) J. Lipid Res. 51, 641–651 [DOI] [PMC free article] [PubMed] [Google Scholar]
- 31. vom Brocke J., Schmeiser H. H., Reinbold M., Hollstein M. (2006) Carcinogenesis 27, 2141–2147 [DOI] [PubMed] [Google Scholar]
- 32. Chalfant C. E., Rathman K., Pinkerman R. L., Wood R. E., Obeid L. M., Ogretmen B., Hannun Y. A. (2002) J. Biol. Chem. 277, 12587–12595 [DOI] [PubMed] [Google Scholar]
- 33. Goehe R. W., Shultz J. C., Murudkar C., Usanovic S., Lamour N. F., Massey D. H., Zhang L., Camidge D. R., Shay J. W., Minna J. D., Chalfant C. E. (2010) J. Clin. Invest. 120, 3923–3939 [DOI] [PMC free article] [PubMed] [Google Scholar]
- 34. Massiello A., Chalfant C. E. (2006) J. Lipid Res. 47, 892–897 [DOI] [PubMed] [Google Scholar]
- 35. Massiello A., Roesser J. R., Chalfant C. E. (2006) FASEB J. 20, 1680–1682 [DOI] [PubMed] [Google Scholar]
- 36. Massiello A., Salas A., Pinkerman R. L., Roddy P., Roesser J. R., Chalfant C. E. (2004) J. Biol. Chem. 279, 15799–15804 [DOI] [PubMed] [Google Scholar]
- 37. Shultz J. C., Goehe R. W., Murudkar C. S., Wijesinghe D. S., Mayton E. K., Massiello A., Hawkins A. J., Mukerjee P., Pinkerman R. L., Park M. A., Chalfant C. E. (2011) Mol. Cancer Res. 9, 889–900 [DOI] [PMC free article] [PubMed] [Google Scholar]
- 38. Shultz J. C., Goehe R. W., Wijesinghe D. S., Murudkar C., Hawkins A. J., Shay J. W., Minna J. D., Chalfant C. E. (2010) Cancer Res. 70, 9185–9196 [DOI] [PMC free article] [PubMed] [Google Scholar]
- 39. Wijesinghe D. S., Massiello A., Subramanian P., Szulc Z., Bielawska A., Chalfant C. E. (2005) J. Lipid Res. 46, 2706–2716 [DOI] [PubMed] [Google Scholar]
- 40. Lamour N. F., Subramanian P., Wijesinghe D. S., Stahelin R. V., Bonventre J. V., Chalfant C. E. (2009) J. Biol. Chem. 284, 26897–26907 [DOI] [PMC free article] [PubMed] [Google Scholar]
- 41. Wijesinghe D. S., Subramanian P., Lamour N. F., Gentile L. B., Granado M. H., Bielawska A., Szulc Z., Gomez-Munoz A., Chalfant C. E. (2009) J. Lipid Res. 50, 1986–1995 [DOI] [PMC free article] [PubMed] [Google Scholar]
- 42. Wijesinghe D. S., Lamour N. F., Gomez-Munoz A., Chalfant C. E. (2007) Methods Enzymol. 434, 265–292 [DOI] [PubMed] [Google Scholar]
- 43. Subramanian P., Vora M., Gentile L. B., Stahelin R. V., Chalfant C. E. (2007) J. Lipid Res. 48, 2701–2708 [DOI] [PubMed] [Google Scholar]
- 44. Stahelin R. V., Subramanian P., Vora M., Cho W., Chalfant C. E. (2007) J. Biol. Chem. 282, 20467–20474 [DOI] [PubMed] [Google Scholar]
- 45. Lamour N. F., Stahelin R. V., Wijesinghe D. S., Maceyka M., Wang E., Allegood J. C., Merrill A. H., Jr., Cho W., Chalfant C. E. (2007) J. Lipid Res. 48, 1293–1304 [DOI] [PubMed] [Google Scholar]
- 46. Subramanian P., Stahelin R. V., Szulc Z., Bielawska A., Cho W., Chalfant C. E. (2005) J. Biol. Chem. 280, 17601–17607 [DOI] [PubMed] [Google Scholar]
- 47. Pettus B. J., Bielawska A., Subramanian P., Wijesinghe D. S., Maceyka M., Leslie C. C., Evans J. H., Freiberg J., Roddy P., Hannun Y. A., Chalfant C. E. (2004) J. Biol. Chem. 279, 11320–11326 [DOI] [PubMed] [Google Scholar]
- 48. Pettus B. J., Bielawska A., Spiegel S., Roddy P., Hannun Y. A., Chalfant C. E. (2003) J. Biol. Chem. 278, 38206–38213 [DOI] [PubMed] [Google Scholar]
- 49. Stahelin R. V., Long F., Diraviyam K., Bruzik K. S., Murray D., Cho W. (2002) J. Biol. Chem. 277, 26379–26388 [DOI] [PubMed] [Google Scholar]
- 50. Jenkins R. W., Canals D., Idkowiak-Baldys J., Simbari F., Roddy P., Perry D. M., Kitatani K., Luberto C., Hannun Y. A. (2010) J. Biol. Chem. 285, 35706–35718 [DOI] [PMC free article] [PubMed] [Google Scholar]
- 51. Boath A., Graf C., Lidome E., Ullrich T., Nussbaumer P., Bornancin F. (2008) J. Biol. Chem. 283, 8517–8526 [DOI] [PubMed] [Google Scholar]
- 52. Graf C., Niwa S., Müller M., Kinzel B., Bornancin F. (2008) Biochem. Biophys. Res. Commun. 373, 159–163 [DOI] [PubMed] [Google Scholar]
- 53. Tsuji K., Mitsutake S., Yokose U., Sugiura M., Kohama T., Igarashi Y. (2008) FEBS J. 275, 3815–3826 [DOI] [PubMed] [Google Scholar]
- 54. Avni D., Goldsmith M., Ernst O., Mashiach R., Tuntland T., Meijler M. M., Gray N. S., Rosen H., Zor T. (2009) Immunol. Lett. 123, 1–8 [DOI] [PubMed] [Google Scholar]
- 55. Ogata T., Yamashita K., Horiuchi H., Okuda K., Todo S. (2008) Surgery 143, 545–555 [DOI] [PubMed] [Google Scholar]
- 56. Goldsmith M., Avni D., Levy-Rimler G., Mashiach R., Ernst O., Levi M., Webb B., Meijler M. M., Gray N. S., Rosen H., Zor T. (2009) Immunology 127, 103–115 [DOI] [PMC free article] [PubMed] [Google Scholar]
- 57. Matsui T., Kondo T., Nishita Y., Itadani S., Nakatani S., Omawari N., Sakai M., Nakazawa S., Ogata A., Ohno H., Obata T., Nakai H., Toda M. (2002) Bioorg. Med. Chem. Lett. 12, 903–905 [DOI] [PubMed] [Google Scholar]
- 58. Matsui T., Kondo T., Nishita Y., Itadani S., Tsuruta H., Fujita S., Omawari N., Sakai M., Nakazawa S., Ogata A., Mori H., Ohno H., Obata T., Nakai H., Toda M. (2002) Bioorg. Med. Chem. Lett. 12, 907–910 [DOI] [PubMed] [Google Scholar]
- 59. Rozenova K. A., Deevska G. M., Karakashian A. A., Nikolova-Karakashian M. N. (2010) J. Biol. Chem. 285, 21103–21113 [DOI] [PMC free article] [PubMed] [Google Scholar]
- 60. Józefowski S., Czerkies M., Łukasik A., Bielawska A., Bielawski J., Kwiatkowska K., Sobota A. (2010) J. Immunol. 185, 6960–6973 [DOI] [PubMed] [Google Scholar]
- 61. Sugiura M., Kono K., Liu H., Shimizugawa T., Minekura H., Spiegel S., Kohama T. (2002) J. Biol. Chem. 277, 23294–23300 [DOI] [PubMed] [Google Scholar]
- 62. Doedens J. R., Black R. A. (2000) J. Biol. Chem. 275, 14598–14607 [DOI] [PubMed] [Google Scholar]
- 63. Willems S. H., Tape C. J., Stanley P. L., Taylor N. A., Mills I. G., Neal D. E., McCafferty J., Murphy G. (2010) Biochem. J. 428, 439–450 [DOI] [PubMed] [Google Scholar]
- 64. Baumruker T., Bornancin F., Billich A. (2005) Immunol. Lett. 96, 175–185 [DOI] [PubMed] [Google Scholar]
- 65. Mitsutake S., Kim T. J., Inagaki Y., Kato M., Yamashita T., Igarashi Y. (2004) J. Biol. Chem. 279, 17570–17577 [DOI] [PubMed] [Google Scholar]