Background: Ulvan, an anionic polysaccharide, is the most abundant component of the green algal cell wall.
Results: The isolated ulvan lyases cleave the glycosidic linkage of ulvan between IduA/GlcA and Rha3S. The gene sequence has no homology in databases.
Conclusion: Ulvan lyases are the first members of a new polysaccharide lyase family.
Significance: Characterization of ulvan lyase is a first step toward understanding the degradation of ulvan.
Keywords: Cell Wall, Enzyme Degradation, Enzyme Kinetics, Enzyme Purification, Polysaccharide, Glucuronic Acid, Green Algae, Iduronic Acid, Ulvan, Polysaccharide Lyases
Abstract
Ulvans are complex sulfated polysaccharides found in the cell walls of green algae belonging to the genus Ulva. These polysaccharides are composed of disaccharide repetition moieties made up of sulfated rhamnose linked to either glucuronic acid, iduronic acid, or xylose. Two ulvan lyases of 30 and 46 kDa were purified from the culture supernatant of Persicivirga ulvanivorans. Based on peptide sequencing, the gene encoding the 46-kDa ulvan lyase was cloned. Sequence analysis revealed that the protein is modular and possesses a catalytic module similar to that of the 30-kDa ulvan lyase along with a module of unknown function. The ulvan-degrading function of the gene was confirmed by expression of the catalytic module in a heterologous system. The gene encoding the catalytic module has no sequence homolog in sequence databases and is likely to be the first member of a novel polysaccharide lyase family. Analysis of degradation products showed that both the 30- and 46-kDa ulvan lyases are endolytic and cleave the glycosidic bond between the sulfated rhamnose and a glucuronic or iduronic acid.
Introduction
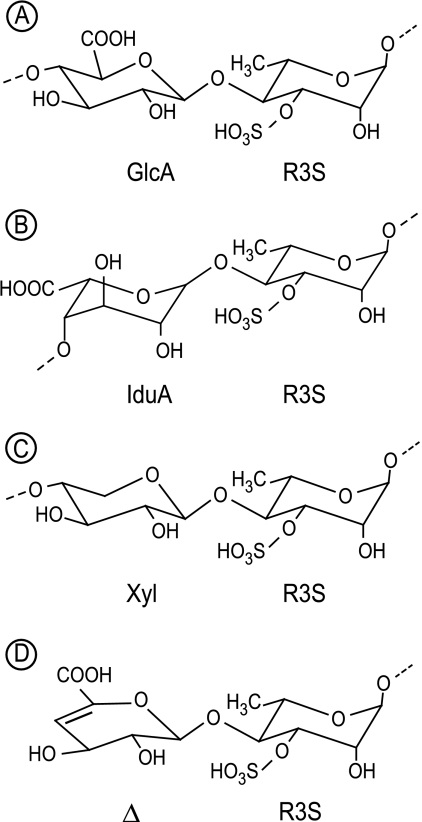
The term “ulvan” refers to the anionic polysaccharides found in the cell wall of green seaweeds belonging to the genus Ulva (Chlorophyta), in which it represents from 8 to 29% of the dry weight. The ulvan backbone is mainly composed of 3-sulfated rhamnose (Rha3S),2 glucuronic acid (GlcA), its C5 epimer, iduronic acid (IduA), and in smaller amounts, xylose (Xyl) (1–3). The repetition moieties of this polysaccharide are disaccharides composed of Rha3S linked with either GlcA, IduA, or Xyl, giving Rha3S-GlcA (ulvanobiouronic acid A), Rha3S-IduA (ulvanobiouronic acid B), and Rha3S-Xyl, respectively (see Fig. 1; 4–6). Occurrence of consecutive glucuronic acid moieties inserted in the ulvan chain has been demonstrated using glucuronic lyase (7). Other modifications, such as the sulfatation of xylose, also have been described (6). Structural analyses of ulvan are based on the characterization of degradation products obtained after mild acid hydrolysis and enzymatic degradation using fractionated bacterial extracts. As in other marine and land polysaccharides, the structural diversity of ulvans reflects the diversity of algal sources, harvesting seasons (8), stabilization treatments (9), and extraction procedures (10).
FIGURE 1.
A–C, chemical structure of three main disaccharide repetition moieties encountered in ulvan. A and B are ulvanobiouronic acid A and B, respectively. D, structure of 4-deoxy-l-threo-hex-4-enopyranosiduronic acid (Δ) linked to the sulfated rhamnose occurring at the non-reducing end after cleavage of the glycosidic linkage by ulvan lyase.
In contrast to polysaccharides from brown algae (e.g. alginate, fucans) or red algae (e.g. agars and carrageenans), green algal cell wall polysaccharides have thus far been investigated less extensively. This can be attributed partly to the low industrial interest in this renewable biomass, despite the fact that it is consumed under the name of “sea lettuce” (Ulva lactuca) in Asian and Mediterranean countries. However, as reviewed recently (6), the unique chemical and physicochemical properties of ulvan have many promising applications in the food, pharmaceutical, and chemical industries as well as for aquaculture and agriculture. In depth understanding of ulvan structure, including both the composition and distribution of ulvan repetition moieties in polysaccharide chains, are thus required for studies on structure-function (i.e. biological, physicochemical) relationships. Green algae also are well known because of their proliferation in eutrophicated coastal waters, also called “green tides.” Green tides occur worldwide, and one of the most spectacular happened along the shores of Qingdao just before the 2008 Olympic Games in Beijing, China (11). Therefore, due to the strong environmental impact of these green seaweeds, a broader knowledge base of this biomass is necessary to better manage and utilize this resource. Studying enzymatic degradation through the analysis of a calibrated series of oligosaccharides can provide insight into ulvan structure. In addition, the development of strategies that lead to the saccharification of ulvan, conversion from polymers into fermentable monosaccharides, requires the discovery of new enzymes because ulvan has no structural homolog in marine or land plants. An extracellular ulvan lyase has been isolated from a marine Gram-negative bacterium isolated from decomposing algae (4). Characterization of the bacteria was not reported, but the fractionated enzyme cleaves the β(1→4) linkage between Rha3S and GlcA leading to the production of unsaturated uronic acid (Δ, 4-deoxy-l-threohex-4-enopyranosiduronic acid, Fig. 1D) at the non-reducing end. Glucuronan lyase from Trichoderma sp. (GL2) has also been reported to partially digest ulvan (7). Due to the lack of data on ulvanolytic bacteria, we screened and isolated bacteria capable of metabolizing ulvans. The most efficient ulvan degrader we have identified is Persicivirga ulvanivorans, isolated from the feces of the gastropod Aplysia punctata fed with Ulva sp. (12). Here, we report the purification, cloning, and overexpression in a heterologous system of the first identified ulvan lyase. This enzyme, which is unrelated to other known lyases, was characterized biochemically.
EXPERIMENTAL PROCEDURES
Extraction of Ulvan
Ulva rotundata was collected on the coast near Pleubian, France (48°51′28”N, 3°04′32” W) in March 2009. After thorough washing with seawater and manual sorting, the seaweeds were wet-ground into pieces of ∼1 mm with an Urschel mill (Comitrol 3600, Urschel International Ltd., Lisses, France). Freshly ground seaweed tissue was soaked for 3 days at room temperature in 78% ethanol and recovered by filtration on a 100-μm sieve. The wet, depigmented cake of ground seaweeds was extracted as described by Robic et al. (9).
Characterization of Ulvan
Dry solid content in the ulvan extract was determined from the loss in weight of samples kept for 24 h at 103 °C in a ventilated furnace. Ash content was quantified gravimetrically after 12 h at 550 °C. Sulfate content was measured according to Tabatabai (13). Protein content was estimated using the Kjelhdahl nitrogen method. Neutral sugar and uronic acid composition was determined after methanolysis in MeOH-HCl and HPLC analysis using an Absorbosphere RP18 column (5 μm, 4 × 250 mm) according to Quemener et al. (14). Molecular weight determinations were performed as described by Robic et al. (10). The final composition of the analyzed ulvan was 1% protein, 15.5% sulfate, 20.5% rhamnose, 13.9% iduronic acid, 11.8% glucuronic acid, 5.1% xylose, and 4.3% glucose. The molecular weight was 1,600,000 g mol−1 equivalent pullulan.
Bacterial Culture
The P. ulvanivorans strain (DSM 22727) was grown in 1 liter of ZoBell medium (15) containing 0.4% (w/v) of ulvan in a 5-liter Erhlenmeyer flask, inoculated with 50 ml of a fresh P. ulvanivorans culture with an optical density of 1 at 600 nm. The culture was incubated at 20 °C for 96 h at 230 rpm, during which the optical density of the culture increased from 0.1 to 4.7. The same conditions were used for culture in a 5-liter fermentor except incubation was conducted at a temperature of 25 °C and pH 7.8 for 48 h.
Protein Purification
The 30- and the 46-kDa ulvan lyases were purified from the supernatants of Erlenmeyer and fermentor culture, respectively. The bacterial cells were removed by centrifugation at 7000 rpm with a JA14 rotor for 30 min at 10 °C, and the supernatant was concentrated by tangential flow filtration on a 10-kDa filter (Prep/Scale TM-TFF Millipore) to a volume of 120–200 ml.
Ammonium sulfate was added, in small quantities, to the medium while stirring on ice to a final concentration of 1 m (NH4)2SO4. The precipitate was discarded after centrifugation at 20,000 × g for 30 min at 10 °C. The supernatant was loaded on a HiTrap phenyl-Sepharose prepacked column (1 ml; GE Healthcare) equilibrated in buffer A (20 mm Tris-HCl, pH 7.5, 1 m (NH4)2SO4) at a flow rate of 1 ml min−1 at room temperature. After elution of the unbound protein with 2 volumes of buffer A, a linearly decreasing gradient from 1 m to 0 m (NH4)2SO4 in buffer A was applied over 20 column volumes to elute the bound proteins. The active fractions eluted between 0.5 and 0.2 m (NH4)2SO4. These fractions (∼15 ml) were pooled and desalted on a HiPrep desalting prepacked column (2.6 × 30 cm; GE Healthcare) equilibrated in buffer B (20 mm Tris-HCl, pH 8.0).
The desalted sample was loaded on a HiTrap Q FF (1 ml; GE Healthcare) equilibrated with buffer B. The gel was washed with 2 column volumes of buffer B prior to elution with a linear gradient of NaCl from 0 m to 1 m in buffer B over 20 column volumes. The active fractions were pooled and loaded on a Superdex 75 HiLoad prepacked column (1.6 × 60 cm; GE Healthcare) equilibrated with buffer B and with 100 mm NaCl. The proteins were eluted by an isocratic gradient with the same buffer at 1 ml min−1.
The active fractions were pooled and dialyzed overnight against buffer C (10 mm phosphate, pH 7.0). The desalted sample was injected on a HiTrap heparin HP prepacked column (1 ml; GE Healthcare) equilibrated with buffer C at 0.5 ml min−1. The gel was washed with 2 column volumes of buffer C before elution with a linear gradient of 0 m to 1 m NaCl in buffer C over 20 column volumes.
During purification, the active fractions were analyzed by SDS-PAGE (16). Protein quantification was performed according to Bradford (17) using the Bio-Rad protein assay with bovine serum albumin as a standard. Ulvan lyase activity was assayed spectrophotometrically using fractionated extract (5–50 μl) as described for the enzyme assays (see below).
Peptide Sequencing
The protein bands cut out of the SDS-PAGE gels were processed for mass spectrometry analyses carried out at the “Biopolymers-Structural Biology” facility located at the INRA Angers-Nantes Center.
Gel bands were washed with 25 mm NH4HCO3, followed by dehydration with 50% (v/v) acetonitrile in 25 mm NH4HCO3. The proteins therein were then reduced with 10 mm DTT and alkylated with 55 mm iodoacetamide. The gel bands were further washed and dehydrated as described above, and proteins were digested overnight at 37 °C by addition of 185 ng of trypsin (Promega, Madison, WI).
Mass spectrometry analyses were conducted on the resulting peptide mixture by LC-MS/MS, through the use of a Switchos-Ultimate II capillary LC system (Dionex, Amsterdam, The Netherlands) coupled to a hybrid quadrupole orthogonal acceleration time-of-flight mass spectrometer (Q-TOF Global, Waters, Manchester, UK). Chromatographic separation was conducted on a reverse-phase capillary column (Pepmap C18, 75 μm × 15 cm, LC Packings) with a linear gradient from 2 to 40% (v/v) acetonitrile in 50 min, followed by an increase to 50% acetonitrile within 10 min, at a flow rate of 200 nl min−1. Mass data acquisitions were piloted by the Mass Lynx software (Waters): the MS data were recorded for 1 s on the mass-to-charge (m/z) range of 400–1500, after which the three most intense ions (doubly, triply, or quadruply charged) were selected and fragmented in the collision cell (MS/MS measurements).
Data Bank Searches Based on LC-MS/MS Data and de Novo Sequencing
MS and MS/MS raw data were processed using the Protein Lynx Global Server software (version 2.1, Waters). Proteins were identified by comparing the collected data against the UniProt database (UniProt release 15.1, April 2009) through the Mascot server program (version 2.2, Matrix Science). An exact mass match was sought between recorded peptides and database entries, with a mass tolerance set at 150 ppm for parent ions (MS mode) and 0.3 Da for fragment ions (MS/MS mode).
All MS/MS spectra were sequenced de novo using the Protein Lynx Global Server software (version 2.1). Briefly, peptide fragmentation in a mass spectrometer produces MS/MS spectra from which the information can be directly related to the amino acid sequence of the peptide, although this information may be incomplete (e.g. some segments of the peptide sequence may be missing if fragmentation did not occur at these positions on the polypeptide backbone). The “de novo” approach consists in using the information from the MS/MS spectrum to produce, independently of any protein sequence database, short segments of consecutive amino acids (called “peptide sequence tags”). All peptide sequence tags were carefully inspected and manually validated so as to keep only high confidence stretches of amino acids.
Gene Cloning
Six degenerate DNA primers, in both directions, were designed from sequences obtained by mass spectrometry (Table 1). PCR amplifications were performed with all possible combinations of primers on 75 ng of genomic DNA from P. ulvanivorans in 25-μl reactions containing 1× GoTaq PCR buffer, 1 mm MgCl2, 0.2 mm each of deoxyribonucleotide triphosphate (dNTP), 2 μm forward and reverse primers, and 1.25 units of GoTaq (Promega). The amplification program was 94 °C for 2 min, 35 cycles at 94 °C for 30 s, 50 °C for 30 s, and at 72 °C for 1 min 30 s, and a final step at 72 °C for 7 min after which the sample was kept at 4 °C until analysis.
TABLE 1.
Peptide sequence tags determined by mass spectrometry after tryptic degradation of the purified 30 and 46 kDa
Data were obtained by de novo sequencing of individual peptides MS/MS spectra. B indicates either an Arg or a Lys. Using this mass spectrometry-based sequencing method, isoleucine (I) and leucine (L) cannot be differentiated. By default, a Leu was indicated in the sequence tags. The first four peptides were observed for both ulvan lyases. Underlined sequences were used as template for the synthesis of degenerated primers, and sequences in boldface type were found in the cloned gene.
| 30 kDa | 46 kDa |
|---|---|
| PNDPNLK | PNDPNLK |
| BLLEVGNTGTFGSTGSA | LLEVGNTGTFGSTGSYLMQAK |
| DLANPDNV | DLANPDNVGTVDDR |
| ALLGGQVFNWNLPES | QEMALLMQEVDWNLPE |
| BEQLNFR | |
| LELLDLELE | VVDNSTLPAADLYR |
| TGVGSYAR | ADLYR |
| BPVYG-NQVQVSFDLWR | YHDTNNMLTHSANLDDR |
| GGGGSNDPALCLYLAR | LYENGELVDEFL |
| ACPSSGVFQ | |
| LLSGWG | |
| BVYDNTLV | |
| FGVTGPPT | |
| DLLGNTLD | |
| BDTDLPNPR | |
| ATGAG | |
| BSCYANYSESSLLGK | |
| BDDPNNPGQTLHYAWK | |
| BFWGLYNLTD |
The thermal asymmetric interlaced PCR method (TAIL-PCR) (18) was employed to obtain the sequence of the extremities of the ulvan lyase gene. Two sets of three nested primers were designed against the sequence obtained using degenerate primers in the forward and reverse directions. Five different arbitrary degenerate primers were chosen from sequences found in the literature (supplemental data; 18, 19). Primary TAIL reactions were performed in 20 μl containing 15 ng of genomic DNA, 1× GoTaq PCR buffer, 1.5 mm MgCl2, 0.2 mm each of deoxyribonucleotide triphosphate (dNTP), 0.2 μm of the first specific primer, and one AD primer (5 μm AD1, 2, 4 μm AD3, 2 μm AD4, or 3 μm AD5), and 1.25 units of GoTaq (Promega). The conditions for the second TAIL reactions were identical to the first, except that 1 μl of a 1:50 dilution of the primary TAIL reaction was used as a template, and the second set of specific primers were used. For the third TAIL reaction, 1 μl of a 1:50 dilution of the secondary TAIL reaction was used as template, and the third set of specific primers was used. The PCR programs were different for the three TAIL reactions (supplemental data) and were based on published programs (19) but adapted to the thermocyclers available in the laboratory.
Enzyme Assays
Characterization of the 30- and 46-kDa ulvan lyases was performed by measuring the formation of double bonds in the assay at 235 nm. The spectrophotometer (U-2401, Shimadzu) was equipped with a temperature-regulated cuvette holder (TCC-controller 240A, Shimadzu) set at 30 °C. The assay solution was composed of 1 g liter−1 ulvan in 100 mm Tris-HCl, pH 8.5, and 200 mm NaCl, in 0.5 ml unless otherwise specified. The enzyme was added directly to the assay mix equilibrated at 30 °C, 15 ng for the 30-kDa enzyme and 12 ng for the 46-kDa enzyme. The increase in absorbance at 235 nm was followed over 5 min.
To identify active fractions, a plate assay was developed in analogy with that described by Gacesa and Wusteman (20) by solidifying the reaction medium described above by adding 1% agarose. Aliquots (2 μl) of the fractions were deposited on the solidified medium and incubated at room temperature overnight. Activity was detected as clear spots on a pink background after development with 0.05% aqueous ruthenium red for 10–30 min.
High Performance Anion-exchange Chromatography (HPAEC)
The purity of the oligosaccharide fractions and the degradation kinetics of pure oligosaccharides were analyzed by HPAEC on a Dionex chromatograph ICS 3000 equipped with a 20-μl injection loop, an AS100XR automated injection system (Thermo Separation Products), and an AS11 anion exchange column (4 × 250 mm, Dionex IonPac) with an AG11 guard column (4 × 50 mm, Dionex IonPac). The system was operated in conductivity mode using an ED40 detector (Dionex) and a Dionex ASRS ultra-4 mm suppressor with a current of 300 mA. Mobile phases were ultrapurified water and 290 mm NaOH. Elution was conducted at a flow rate of 0.5 ml min−1 with a GP40 gradient pump. The gradient used was 0 min, 3% B; 1.5 min, 1% B; 4.1 min, 5% B; 6.5 min, 10% B; 10.0 min, 18% B; 26 min, 22% B; 28 min, 40% B; 30 min, 100% B; 30.1 min, 3% B; and 37 min, 3% B. The Chromeleon-peak Net software (Dionex) program was used for data acquisition and transfer.
Analytical and Semi-preparative Size-exclusion Chromatography
Oligosaccharide formation during ulvan degradation was examined by analytical size-exclusion chromatography on an Ultimate 3000 HPLC system (Dionex) with separation on a Superdex 200 (10/300 GL, GE Healthcare) and a peptide HR (10/300 GL, GE Healthcare) column coupled in series operated at 0.5 ml min−1 with 50 mm (NH4)2CO3 (pH 8) as the eluent and a UV detector (Dionex) operating at 235 nm along with an refractive index detector (Wyatt).
Oligo-ulvan was purified using filtered, degraded ulvan (0.2 μm). The sample was injected on three Pharmacia Superdex 30 columns (2.6 × 60 cm; GE Healthcare) in series with 50 mm (NH4)2CO3 as the eluent at a flow of 1.5 ml min−1. Fractions were collected using a Gilson 215 liquid handler system. The shapes of the analytic and semi-preparative chromatograms were similar. The elution volume was 1000 ml for the semi-preparative size-exclusion chromatography and 40 ml for analytic size-exclusion chromatography. Fractions (10 ml) were collected between 330 and 900 ml of elution volume. The enzyme-resistant fraction eluted between 360 and 390 ml. The fraction containing the tetrasaccharides with uronic acids were collected between 660 and 720 ml. The fractions collected before 700 ml contained 70:30 (mol:mol) GlcA:IduA; the 700–710 ml fraction contained 50:50 (mol:mol) GlcA:IduA, and the 710–720 ml fraction contained 30:70 (mol:mol) GlucA:IduA. The tetrasaccharide containing xylose was obtained from the 720–740-ml fractions. The disaccharide, representing the second largest peak on the chromatogram, eluted between 770 and 800 ml.
NMR Spectroscopy
The structure of the purified oligo-ulvans was determined by 1H NMR spectroscopy. One-dimensional 1H NMR spectra were recorded at 298 K on a Bruker Avance 500 spectrometer equipped with an inverse 5-mm 1H/13C/15N TCI CryoProbe. Prior to analysis, samples were exchanged twice in D2O and redissolved in D2O (99.97 atom % D). Chemical shifts are expressed in ppm in reference to an external standard (trimethylsilylpropionic acid). The HOD signal was not suppressed.
Heterologous Expression of Ulvan Lyase
Primers were designed to amplify the catalytic module of the ulvan lyase gene and to incorporate BglII and EcoRI restriction sites into the 5′ and 3′ ends, respectively. Standard PCR conditions were used with an annealing temperature of 50 °C and 30 cycles. The resulting PCR products were purified, digested with the appropriate restriction enzymes, and subcloned into a pFO4 expression vector, modified from pET15 (Novagen) to be compatible with the BamHI/EcoRI and BglII/MfeI ligation strategies. Recombinant plasmids were used to transform Escherichia coli strain BL21(DE3). Transformed colonies were grown for expression in Graffinity medium for 3 h, a Luria-Bertani (LB) medium containing ampicillin and 0.5% glucose at 37 °C, after which an equivalent volume of cold LB medium containing 0.6% lactose, 20 mm Hepes, pH 7.0, and 1 mm isopropyl 1-thio-β-d-galactopyranoside was added, and the culture was incubated for 18 h at 20 °C. After centrifugation, the bacterial pellet was resuspended in a buffer containing 20 mm Tris-HCl, 500 mm NaCl, and 5 mm imidazole at pH 7.4. The cells were lysed using a French press followed by centrifugation to remove bacterial debris. The resulting supernatant was applied to a nickel-Sepharose column loaded with 100 mm NiSO4 (GE Healthcare). After washing, the bound proteins were eluted with a linear gradient of imidazole ranging from 5 to 500 mm. The active fractions were pooled, desalted on a HiPrep 26/10 desalting column, and equilibrated in 20 mm Tris-HCl, pH 8.0.
RESULTS
Purification of 30- and 46-kDa Extracellular Ulvan Lyases from P. ulvanivorans
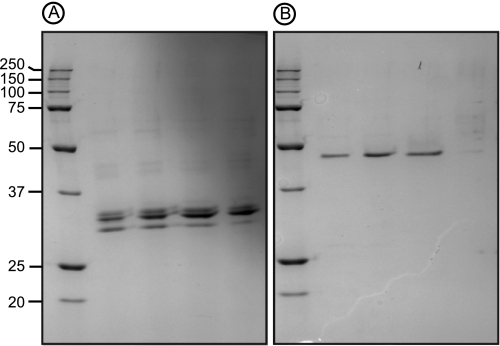
The first attempts to purify ulvan lyase were carried out on the growth medium of P. ulvanivorans grown in an Erlenmeyer flask. The addition of ulvan was required to induce the production of ulvan lyase and its secretion into the extracellular medium, although ulvan lyase also occurred in the bacterial pellet. Maximum ulvan lyase activity was observed during the stationary phase (between 48 and 72 h). The ulvan lyase was purified from concentrated culture medium using ammonium sulfate precipitation followed by several steps of hydrophobic and anion exchange chromatography. The best protocol resulted in purification of 0.25 mg of protein with an activity of 10.4 mm min−1, representing a 2.5-fold purification and a yield of 15%. However, on a SDS-PAGE gel, the protein fraction was not pure, it was composed of one main protein with an apparent molecular mass of ∼30 kDa contaminated by two other less abundant proteins (Fig. 2A). The most abundant protein was excised from the gel and, after in-gel trypsin hydrolysis, internal peptides were measured by mass spectrometry (Table 1). The peptide sequences determined for the 30-kDa protein extract were compared with sequences available in protein databases (UniProt database) using an exact mass matching algorithm (MASCOT). This procedure failed to identify any significant hits, suggesting that these proteins are novel. However, at this stage, because the protein was not highly pure, the peptide sequences could not be unambiguously attributed to ulvan lyase activity. Interestingly, we found that when P. ulvanivorans was grown in a 5-liter fermentor (25 °C, pH 7.4) instead of a 1-liter Erlenmeyer flask, the bacteria produced a different ulvan lyase. A second purification protocol for ulvan lyase was thus designed based on a strategy similar to the one used for the 30-kDa ulvan lyase extract. At the last chromatography step, the enzyme eluted as a single peak, and this protein fraction migrated as a single band in SDS-PAGE analysis, corresponding to an apparent molecular mass of 46 kDa (Fig. 2B). The pure enzyme fractions corresponded to 0.01 mg of protein with an activity of 0.092 mm min−1, representing a 58-fold purification and a yield of 0.66%. Again, the protein band was excised from the gel, and peptides corresponding to the trypsin degradation of the purified protein were sequenced by mass spectrometry. As for the 30-kDa protein, the peptide sequences had no significant homolog in protein databases.
FIGURE 2.
PAGE of ulvan lyases. SDS-PAGE was performed under reducing conditions to analyze the native 30 (A) and 46-kDa (B) ulvan lyases from P. ulvanivorans.
Thus, all recorded MS/MS data were further explored using de novo peptide sequencing implemented in ProteinLynx Global Server software to compare the MS/MS data set obtained from 30-kDa protein with that of the 46-kDa protein. This comparison revealed that some peptides contained identical sequence stretches in both purified protein bands (PNDPNLK, DLANPDNV, LLEVGNTGTFGSTGS) and other peptides displayed strong homology (Table 1). This suggests that, despite their different molecular weights, parts of the two purified proteins were homologous.
Gene Cloning, Sequence Analysis, and Heterologous Expression
All of the peptide sequence tags obtained from mass spectrometry and present in both purified proteins were used as template for the synthesis of degenerate oligonucleotide primers. The longest gene fragment was 720 bp obtained by PCR directly on P. ulvanivorans genomic DNA using degenerate primers corresponding to ANPDNVG (forward) and TLPAADLY (reverse). The complete gene was successfully obtained by using the TAIL-PCR method (19). The full gene sequence of 1536 bp was deposited in GenBankTM (accession no. JN104480).
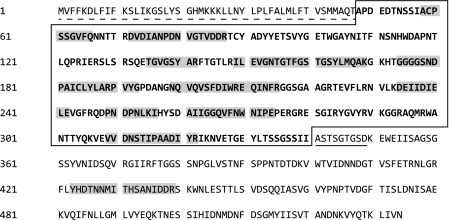
Translation of the ulvan lyase gene yielded a pre-protein of 512 amino acids (Fig. 3) with a theoretical molecular mass of 56.3 kDa. Six of the eight peptide sequence tags determined by mass spectrometry sequencing from the purified 46-kDa protein were confirmed in the gene sequence, and half of the peptides sequenced from the fractioned 30-kDa ulvan lyase were detected and mainly localized in the N-terminal end of the protein (Fig. 3 and Table 1). The programs SignalP and LipoP both predicted a clear signal peptide of 25 amino acids with cleavage between Tyr-25 and Ala-26 giving a protein of 53.4 kDa.
FIGURE 3.
Gene sequence of ulvan lyase. The signal peptide is indicated by a dashed line. The catalytic module is shown in boldface type and boxed. The low complexity region is underlined. Peptides determined from mass spectroscopy and identified in the gene sequence are shaded in gray.
Using the DisEMBL program, a low complexity region was identified in the middle of the protein sequence, between Arg-341 and Asp-349, separating two modules of ∼34 and 19 kDa, respectively. The absence of secondary structure in this region was also confirmed by a hydrophobic cluster analysis. A sequence similarity search using the program BLASTp indicated that there were no proteins in the UniProt database homologous to the full-length or truncated ulvan lyase. The 19-kDa module showed weak homology with a module of unknown function associated with other proteins from Flavobacteria. The catalytic module was attributed to the 34-kDa peptide because it was common to both purified proteins.
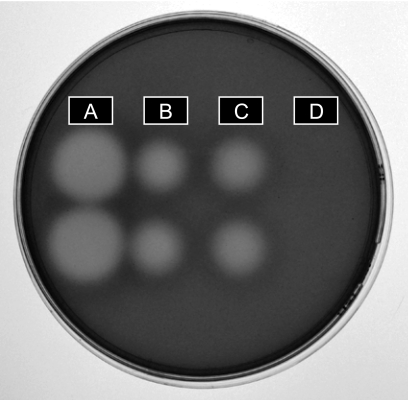
Heterologous expression of the entire protein, the catalytic module, and the module of unknown function were assayed using pFO4 as the expression vector in E. coli BL21 cells. No ulvanolytic activity was detected in the extract of E. coli with the pFO4 vector without the insert (Fig. 4D), with the entire His-tagged protein or with the non-catalytic module. However, the degradation of ulvan was clearly demonstrated with the overexpressed His-tagged catalytic module on an agarose plate containing ulvan (Fig. 4C), confirming the ulvanolytic function of the gene.
FIGURE 4.
Shown is the ulvan-containing agarose plate stained by 0.05% ruthenium red aqueous solution revealing the enzymatic degradation of ulvan by the purified 30- (A) and 46-kDa (B) proteins and the recombinant catalytic module (C). As a control, an extract of E. coli carrying the expression plasmid without the insert was also tested on the agar plate (D).
Biochemical Characterization of Purified Ulvan Lyases
Due to the low level of expression of the recombinant catalytic module of the 46-kDa protein, biochemical characterizations were performed on the purified 30- and 46-kDa ulvan lyases. The pH and temperature optima of the two purified enzymes were very similar. The bell shape of initial velocity as a function of pH was centered on pH 9 with equivalent activity at pH 8.5 and 9.5, and a loss of 50% of the activity was observed at pH 7.5 and 10.5. The temperature optimum of both enzymes was 50 °C, but enzyme activity was rapidly lost (∼75% after 5 min). At 35 °C, no decrease in activity was observed during the 30 min of incubation and at 30 °C for over 2 h. The main difference between the two enzymes seemed to be their dependence on ionic strength. About 75% of the activity of the 30-kDa protein was observed when 20 mm Tris buffer was the only source of ionic strength in the medium, and the maximum rate of degradation occurred with addition of 200 mm NaCl. The 46-kDa ulvan lyase required 300 mm NaCl to obtain its maximum rate of degradation and was practically inactive in 20 mm Tris buffer. Addition of 1 mm EDTA or EGTA, as well as addition of 1 mm CaCl2, MgCl2, LiCl2, or NiCl2 to the reaction mixture had no effect on the activity of both enzymes.
The pure 46-kDa ulvan lyase appeared to follow Michaelis-Menten kinetics for ulvan concentrations of 0.01–0.1 g liter−1, and the Km was calculated at 0.0051 ± 0.0002 g liter−1 with a Vmax of 142 ± 11 mm cut bonds min−1 mg−1. For concentrations greater than 0.1 g liter−1 ulvan, the enzyme did not show typical behavior, probably due to the viscosity of ulvan in solution or some product inhibition, and kinetic parameters could not be determined unambiguously.
Analysis of Cleavage of Glycosidic Bond
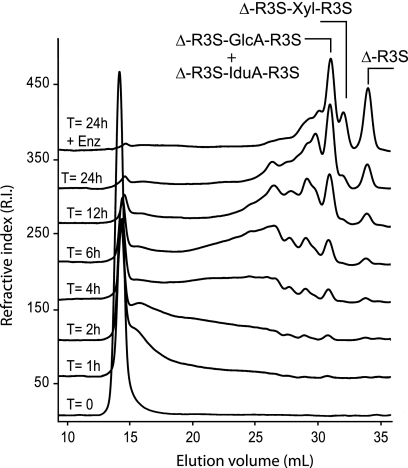
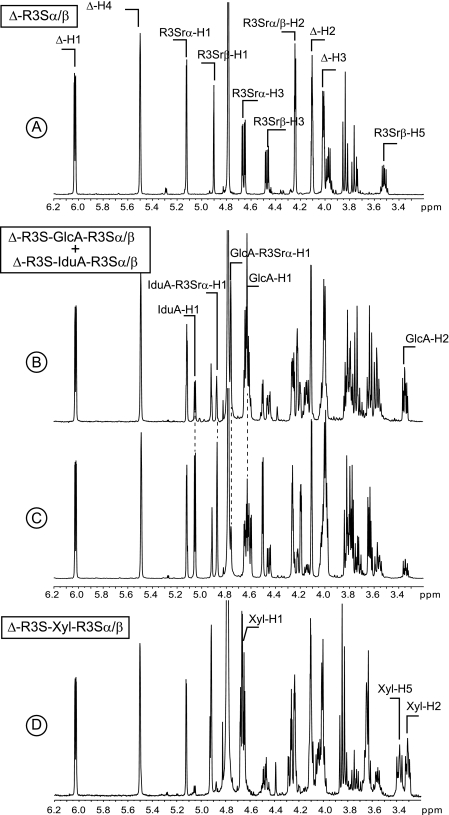
The time course of the depolymerization of ulvan incubated with ulvan lyase was monitored using gel permeation chromatography (Fig. 5). Upon addition of enzyme, the molecular mass of ulvan decreased rapidly, and products of intermediate size appeared between the 15- and 30-ml elution volumes. After 24 h and a second addition of enzyme, ulvan was completely converted into small size oligosaccharides (30–35 ml elution volume). The four most abundant end products were purified and analyzed by 1H NMR (Fig. 6). Based on previous NMR analyses (4), the smallest oligosaccharide (34-ml elution volume, Fig. 6A) was unambiguously attributed to the Δ-R3S disaccharide (4-deoxy-l-threo-hex-4-enopyranosiduronic acid linked to O-4 of l-Rhap 3-sulfate). Signals of the Δ-R3S moiety occurred in the spectra of all the other purified oligosaccharides. In particular, the characteristic peaks of the unsaturated residue occurred at 6.03 ppm (Δ-H1) and 5.5 ppm (Δ-H4), and the α-anomeric proton of the sulfated rhamnose occurred at 5.12 ppm (R3S-H1). This indicates that the end products of the ulvan lyase were all terminated by the Δ-R3S moiety at their non-reducing end.
FIGURE 5.
Degradation kinetics of ulvan incubated with purified ulvan lyase followed by size-exclusion chromatography. After 24 h of degradation, the high molecular weight polysaccharides were converted into oligosaccharides of DP2 (Δ-R3S) and DP4 (Δ-R3S-Glc-R3S, Δ-R3S-Idu-R3S, and Δ-R3S-Xyl-R3S).
FIGURE 6.
1H NMR of the purified end products of ulvan lyase. A, spectrum of the pure DP2. B and C are mixtures of the two ulvanobiuronic acids. The ratio of A:B ulvanobiuronic acid was ∼70:30 in B and 30:70 in A. D, spectra of the pure Δ-R3S-Xyl-R3Sα/β-tetrasaccharide.
The 1H NMR spectra of the oligosaccharide eluting at 32 ml (Fig. 6D) was identical to that of the Δ-R3S-Xyl-R3Sα/β tetrasaccharide reported by Lahaye et al. (4). The signal corresponding to the anomeric proton Xyl-H1 was observed at 4.65 ppm, and the two broad signals at 3.30 and 3.37 ppm were ascribed to Xyl-H2 and Xyl-H5, respectively. The peak eluting at 30 ml was composed of two tetrasaccharides: Δ-R3S-GlcA-R3Sα/β and Δ-R3S-Idu-R3Sα/β (Fig. 6, B and C). The beginning of the peak was strongly enriched in Δ-R3S-GlcA-R3Sα/β (70% mol:mol, Fig. 6B), whereas the end of the peak contained more Δ-R3S-Idu-R3Sα/β (70% mol:mol, Fig. 6C). The signals ascribed to the anomeric proton of the iduronic residue (IduA-H1, 5.05 ppm) and the anomeric proton of the rhamnose linked to the iduronic residues (IduA-R3S-H1a, 4.87 ppm) were identified clearly. The glucuronic residue was distinguished from the iduronic residue primarily by the anomeric proton (GlcA-H1, 4.63 ppm) and the anomeric proton of the linked rhamnose (GlcA-R3S-H1a, 4.75 ppm).
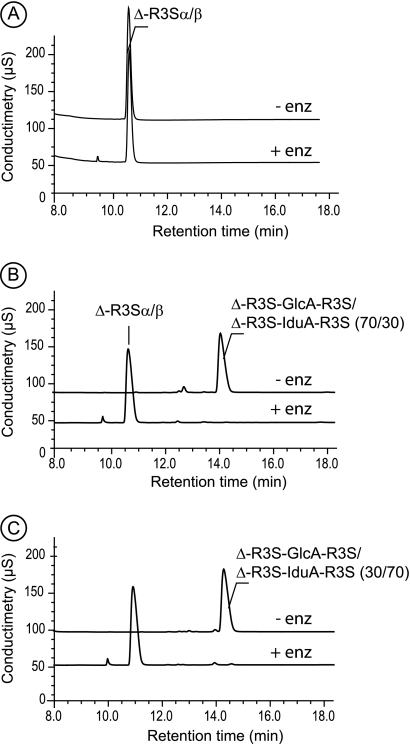
Purified di- and tetrasaccharides were incubated with the two purified ulvan lyases and analyzed by HPAEC. Chromatograms recorded before and after incubation for the Δ-R3S disaccharide (Fig. 7A) and Δ-R3S-Xyl-R3S tetrasaccharides were identical (data not shown), indicating that they remained unmodified by the enzymes. Conversely, the peak observed at 15 min corresponding to the Δ-R3S-GlcA-R3S and Δ-R3S-IduA-R3S tetrasaccharide mixtures (GlcA:IduA ratios of 70:30 and 30:70) (Fig. 6, B and C) disappeared after incubation with ulvan lyases (Fig. 7, B and C). One single peak, eluting at 11 min like the Δ-R3S disaccharide, was detected indicating that ulvan lyase cleaved the glycosidic bond between the sulfated rhamnose and either the glucuronic or the iduronic residues. Degradation kinetics for these mixtures of tetrasaccharides were monitored by HPAEC to detect any possible differences in the recognition of the glucuronic or iduronic residues. However, we observed that the rate of degradation of tetrasaccharide mixtures and the rate of production of the Δ-R3S disaccharide were independent of the GlcA:IduA ratio. Degradation rates of 6.6 ± 0.9 and 1.6 ± 0.2 mm min−1 mg−1 were observed for the 30 and 46-kDa ulvan lyases, respectively. Degradation was carried out using tetrasaccharide concentrations of 1.5 mm in 200 mm ammonium carbonate at 30 °C.
FIGURE 7.
High performance anion-exchange chromatography of purified oligosaccharides. A, Δ-R3S was not degraded by ulvan lyase. B, the tetrasaccharide Δ-R3S-Glc-R3S was converted into only Δ-R3S after incubation with ulvan lyase. C, the tetrasaccharide Δ-R3S-Idu-R3S was converted into only Δ-R3S after incubation with ulvan lyase as also observed for B. − enz, without ulvan-lyase; + enz: with ulvan lyase.
DISCUSSION
Two ulvan lyases of 30 and 46 kDa were purified; the gene encoding the 46-kDa protein was cloned and sequenced. Three lines of evidence indicate that the correct gene was cloned. First, mass spectrometry analysis of peptide sequences revealed that the two purified proteins had sequence homologies despite their different molecular weights and different purification procedures. These sequences were used to clone the gene encoding the 46-kDa ulvan lyase, which included most of the peptide sequence tags determined by mass spectrometry. Second, analysis of the gene revealed the modularity of the 46-kDa ulvan lyase, which is composed of a catalytic module and an additional module of unknown function. The catalytic module had a molecular weight similar to the purified 30-kDa ulvan lyase. Third, the catalytic module was expressed recombinantly in E. coli, and ulvan lyase activity was observed with this recombinant protein.
No proteins similar to ulvan lyase were identified in any protein sequence database nor were any similarities with known families of lyases observed. The degradation products of ulvan lyase were all terminated by the Δ-R3S moiety, which is an unsaturated residue (Δ, 4-deoxy-l-threo-hex-4-enopyranosiduronic acid) that can be obtained indifferently from glucuronic acid or its C5 epimer, iduronic acid. A detailed analysis of the purified oligosaccharides showed that ulvan lyase specifically cleaves the glycosidic bond between the sulfated rhamnose and the glucuronic or iduronic acid residues. Analysis of enzyme kinetics revealed that both ulvan lyases accommodate and degrade the Δ-R3S-GlcA-R3S and Δ-R3S-IduA-R3S tetrasaccharides at the same rate.
The mechanism of β-elimination catalyzed by ulvan lyase suggests that the proton at the C5 position can be abstracted when it is in the syn- (same side) or anti-configuration (opposite side) with the hydroxyl group at C4 (21). Similar observations have been reported for chondroitinase ABC (22) and heparinase (23) with both glucuronic and iduronic residues as substrates. In depth crystallography analysis and mutation experiments have shown that specific amino acids are involved in either the syn- or in the anti-elimination (22, 24). Therefore, it may be possible to suppress syn- or anti-β-elimination through mutagenesis of specific amino acids and thereby modify the specificity of ulvan lyase toward either the glucuronic or iduronic acid residue.
The enzymatic degradation of ulvan leads to a rapid decrease in molecular weight indicating that the enzyme has an endolytic mode of action. At the end of the reaction, mainly small oligosaccharides of DP2 and DP4 were obtained (Fig. 5). The abundance and structure of the produced oligosaccharides reflect the composition and distribution of the parent polysaccharide. However, because we observed that glucuronic and iduronic acid were both cleaved, the distribution of the ulvan disaccharide moieties cannot be deduced from the analysis of the end products. Oligosaccharides of DP6–8 were not very abundant, and no oligosaccharides of longer length were observed by chromatography. This suggests that R3S-Xyl moieties are not contiguous and are most likely randomly distributed along the ulvan chain.
The lack of sequences homologous to ulvan lyase in protein databases may be correlated to the low number of isolated ulvan-degrading bacteria. To our knowledge, ulvan lyases were first fractionated from a marine Gram-negative bacterium isolated from decomposing algae (4) and, more recently and more surprisingly, from the Proteobacteria Ochrobactrum tritici isolated from soil (25). The occurrence of ulvan-degrading bacteria in such different environments suggests that a wide diversity of organisms are able to metabolize ulvans. Green algae including Ulva sp. represent an important fraction of costal biomass along with red and brown algae. Bioconversion of this algal biomass mainly is carried out by microorganisms and numerous bacteria involved in the degradation of cell wall polysaccharides in brown (i.e. alginates, fucans) and red algae (i.e. agars, carrageenans). New polysaccharide-degrading organisms are being discovered continually. Therefore, the number of microorganisms that can degrade green algae and their biological diversity is probably underestimated if not completely unknown.
The culture supernatant of P. ulvanivorans was used to purify ulvan lyase because it was the most abundant and most active enzyme on ulvans. Excretion of the protein in the culture supernatant is consistent with the observation of a signal peptide in the ulvan lyase-encoding gene. This strong activity suggests that it may represent the first step of the complete degradation of ulvan. Considering the complexity of ulvan, saccharification (conversion of the polysaccharide into monosaccharide residues) implies that several other enzymes such as other lyases, 6S-rhamnosidases, xylanases, and sulfatases must be involved. During our preliminary investigations of P. ulvanivorans, we noted that the bacterium was not able to grow when ulvan was the sole source of carbon. Consequently, other ulvanolytic bacteria remain to be discovered to identify the entire enzymatic system that leads to the saccharification of ulvans.
Supplementary Material
Acknowledgments
We thank Stéphanie Deligny-Penninck for excellent technical assistance in mass spectrometry analyses and Stephane Cerantola at the Service Commun de Résonance Magnétique Nucléaire, Université de Bretagne Occidentale, Brest for NMR analyses.
This work was supported by the French National Research Agency (ANR) by Grant ANR-07-RIB-019.

The on-line version of this article (available at http://www.jbc.org) contains supplemental Table 1.
- Rha3S
- 3-sulfated rhamnose
- GlcA
- glucuronic acid
- IduA
- iduronic acid
- Xyl
- xylose
- TAIL-PCR
- thermal asymmetric interlaced PCR
- HPAEC
- high performance anion-exchange chromatography.
REFERENCES
- 1. Percival E., McDowell R. H. (1967) Chemistry and Enzymology of Marine Algal Polysaccharides, pp. 176–188, Academic Press, Inc., London [Google Scholar]
- 2. Ray B., Lahaye M. (1995) Carbohydr. Res. 274, 313–318 [Google Scholar]
- 3. Quemener B., Lahaye M., Bobin-Dubigeon C. (1997) J. Appl. Phycol. 9, 179–188 [Google Scholar]
- 4. Lahaye M., Brunel M., Bonnin E. (1997) Carbohydr. Res. 304, 325–333 [DOI] [PubMed] [Google Scholar]
- 5. Lahaye M., Inizan F., Vigouroux J. (1998) Carbohydr. Polym. 36, 239–249 [Google Scholar]
- 6. Lahaye M., Robic A. (2007) Biomacromolecules 8, 23–32 [DOI] [PubMed] [Google Scholar]
- 7. Delattre C., Michaud P., Keller C., Elboutachfaiti R., Beven L., Courtois B., Courtois J. (2006) Appl. Microbiol. Biotechnol. 70, 437–443 [DOI] [PubMed] [Google Scholar]
- 8. Robic A., Sassi J. F., Dion P., Lerat Y., Lahaye M. (2009) J. Phycol. 45, 962–973 [DOI] [PubMed] [Google Scholar]
- 9. Robic A., Sassi J-F., Lahaye M. (2008) Carbohydr. Polym. 74, 344–352 [Google Scholar]
- 10. Robic A., Rondeau-Mouro C., Sassi J. F., Lerat Y., Lahaye M. (2009) Carbohydr. Polym. 77, 206–216 [Google Scholar]
- 11. Gao S., Chen X., Yi Q., Wang G., Pan G., Lin A., Peng G. (2010) PLOS One 5, 1–7 [DOI] [PMC free article] [PubMed] [Google Scholar]
- 12. Barbeyron T., Lerat Y., Sassi J. F., Le Panse S., Helbert W., Collén P. N. (2011) Int. J. Syst. Evol. Microbiol. 61, 1899–1905 [DOI] [PubMed] [Google Scholar]
- 13. Tabatabai M. A. (1974) Sulphur. Inst. 10, 11–13 [Google Scholar]
- 14. Quemener B., Marot C., Mouillet L., Da Riz V., Diris J. (2000) Food Hydrocoll. 14, 9–17 [Google Scholar]
- 15. ZoBell C. E. (1941) J. Mar. Res. 4, 41–75 [Google Scholar]
- 16. Laemmli U. K., Favre M. (1973) J. Mol. Biol. 80, 575–599 [DOI] [PubMed] [Google Scholar]
- 17. Bradford M. M. (1976) Anal. Biochem. 72, 248–254 [DOI] [PubMed] [Google Scholar]
- 18. Liu Y. G., Whittier R. F. (1995) Genomics 25, 674–681 [DOI] [PubMed] [Google Scholar]
- 19. Liu Y. G., Mitsukawa N., Oosumi T., Whittier R. F. (1995) Plant J. 8, 457–463 [DOI] [PubMed] [Google Scholar]
- 20. Gacesa P., Wusteman F. S. (1990) Appl. Environ. Microbiol. 56, 2265–2267 [DOI] [PMC free article] [PubMed] [Google Scholar]
- 21. Garron M. L., Cygler M. (2010) Glycobiology 20, 1547–1573 [DOI] [PubMed] [Google Scholar]
- 22. Shaya D., Hahn B. S., Bjerkan T. M., Kim W. S., Park N. Y., Sim J. S., Kim Y. S., Cygler M. (2008) Glycobiology 18, 270–277 [DOI] [PubMed] [Google Scholar]
- 23. Shaya D., Tocilj A., Li Y., Myette J., Venkataraman G., Sasisekharan R., Cygler M. (2006) J. Biol. Chem. 281, 15525–15535 [DOI] [PubMed] [Google Scholar]
- 24. Tøndervik A., Klinkenberg G., Aarstad O. A., Drabløs F., Ertesvåg H., Ellingsen T. E., Skjåk-Bræk G., Valla S., Sletta H. (2010) J. Biol. Chem. 285, 35284–35292 [DOI] [PMC free article] [PubMed] [Google Scholar]
- 25. Boutachfaiti R., Pheulpin P., Courtois B., Courtois-Sambourg J. (October 14, 2010) U.S. Patent 261, 894
Associated Data
This section collects any data citations, data availability statements, or supplementary materials included in this article.


