

Background: Fat storage-inducing transmembrane protein 2 (FIT2) is implicated to be important in the formation of triacylglyceride lipid droplets.
Results: Mice with skeletal muscle-specific overexpression of FIT2 had increased muscle triacylglycerides, were completely protected from diet-induced weight gain, and had altered muscle energy metabolism.
Conclusion: FIT2 plays an unexpected function in regulating muscle energy metabolism.
Significance: This is the first study describing a function for FIT2 in energy metabolism.
Keywords: Endoplasmic Reticulum, Evolution, Insulin Resistance, Lipid Droplets, Membrane Proteins, Skeletal Muscle Metabolism
Abstract
Triacylglyceride stored in cytosolic lipid droplets (LDs) constitutes a major energy reservoir in most eukaryotes. The regulated turnover of triacylglyceride in LDs provides fatty acids for mitochondrial β-oxidation and ATP generation in physiological states of high demand for energy. The mechanisms for the formation of LDs in conditions of energy excess are not entirely understood. Fat storage-inducing transmembrane protein 2 (FIT2/FITM2) is the anciently conserved member of the fat storage-inducing transmembrane family of proteins implicated to be important in the formation of LDs, but its role in energy metabolism has not been tested. Here, we report that expression of FIT2 in mouse skeletal muscle had profound effects on muscle energy metabolism. Mice with skeletal muscle-specific overexpression of FIT2 (CKF2) had significantly increased intramyocellular triacylglyceride and complete protection from high fat diet-induced weight gain due to increased energy expenditure. Mass spectrometry-based metabolite profiling suggested that CKF2 skeletal muscle had increased oxidation of branched chain amino acids but decreased oxidation of fatty acids. Glucose was primarily utilized in CKF2 muscle for synthesis of the glycerol backbone of triacylglyceride and not for glycogen production. CKF2 muscle was ATP-deficient and had activated AMP kinase. Together, these studies indicate that FIT2 expression in skeletal muscle plays an unexpected function in regulating muscle energy metabolism and indicates an important role for lipid droplet formation in this process.
Introduction
The maintenance of energy expenditure in mammals involves the dynamic integration of two metabolically opposed states, fasting and feeding. Fasting involves the induction of catabolic, or ATP generating pathways, whereas feeding engages anabolic or ATP-consuming pathways that build carbon skeletons and store energy. The integration of these states is governed by endocrine signals, such as insulin and glucagon, nutrient signals such as long chain fatty acids and branched chain amino acids, adipose and gut-derived polypeptide hormones, such as leptin and Glp-1, and nutrient-sensing kinases, such as AMPK2 and mammalian target of rapamycin. One peripheral tissue that plays an important role in energy metabolism is skeletal muscle, because it comprises a large percentage of the organism's mass and is the major site of glucose disposal and fatty acid and amino acid catabolism. Changes in the efficiency of substrate utilization or in the type of substrate used by skeletal muscle might affect energy balance. For example, enhancing the cataplerosis of the TCA cycle in skeletal muscle by overexpression of cytosolic phosphoenolpyruvate carboxykinase resulted in mice with increased mitochondria activity and leanness (1). Similarly, deficiency of the mitochondrial branched chain amino acid aminotransferase isozyme (BCAT2) resulted in enhanced energy expenditure (2).
An anabolic pathway important for the maintenance of energy balance is the storage of triacylglycerides (TAG) in cells. TAG is the primary energy reservoir in most eukaryotes that is stored in structures called cytosolic lipid droplets (LD) (3). Fatty acids stored as TAG are important for ATP production in many tissues, such as skeletal muscle, during physiological stresses such as exercise (4–7). However, excessive accumulation of TAG-rich lipid droplets in tissues such as adipose, skeletal muscle, liver, and pancreas is associated with insulin resistance and type 2 diabetes (8).
The ability to store energy in the form of TAG-rich lipid droplets is evolutionarily conserved from Saccharomyces cerevisiae to humans (9). TAG-rich LDs are composed of a monolayer of phospholipids surrounding the TAG core and a unique proteome that associates with the surface of LDs (9, 10). A common theme in the turnover of TAG from LD in many mammalian tissues is the regulation of lipase action involving perilipin proteins that is coordinated with the energy demands of the cell (9, 11, 12). The formation of TAG LDs might also be coordinated with the energy demands of the cell. TAG-rich LDs form at the endoplasmic reticulum and require the enzymatic activity of the endoplasmic reticulum-resident membrane proteins diacylglycerol acyltransferase 1 and 2 in mammals (13). The process of LD formation and regulation of LD formation downstream of DGAT activity are poorly understood.
Our laboratory has recently identified a two-gene family of evolutionarily conserved proteins that are important in the partitioning of newly synthesized triacylglyceride into lipid droplets, which we named fat storage-inducing transmembrane protein 1 and 2 (FITM1/FIT1 and FITM2/FIT2) (14). Fat storage-inducing transmembrane proteins have six transmembrane domains and reside exclusively in the endoplasmic reticulum (14, 15). FIT2 is the anciently conserved fat storage-inducing transmembrane family member and is ubiquitously expressed at low levels in mammalian tissues with highest expression in white adipose tissue. This expression profile of FIT2 raises the possibility that FIT2 may play a role in TAG storage in “long term” fat depots like adipose tissue, as opposed to the more rapidly turning over TAG-LDs in muscle (5, 16). Overexpression of FIT2 in mammalian cells in vitro and in vivo resulted in TAG LD accumulation. The process of TAG LD accumulation was found to be through the partitioning of newly synthesized TAG into LD without an increase in TAG biosynthesis. Conversely, knockdown of FIT2 in pre-adipocyte NIH 3T3-L1 cells reduced the size and number of LDs, indicating that FIT2 plays an important role in lipid droplet formation but not TAG biosynthesis. The distinct tissue distribution pattern of FIT1 and FIT2 raises the idea that FIT2, being highly expressed in adipose, is primarily involved in the generation of large lipid droplets for long term storage of triacylglycerides, whereas FIT1 is important for generating small lipid droplets involved in the rapid mobilization of triacylglycerides during increased ATP demand. We took advantage of the unique biochemical function of FIT2 in LD formation to examine the effects of FIT2 expression and TAG-LDs on muscle energy metabolism. Here, we report that muscle-specific overexpression of FIT2 resulted in robust reprogramming of skeletal muscle metabolism whereby reduced metabolic efficiency resulted in increased energy expenditure and decreased energy charge. The data indicate that FIT2 plays an important role in regulating energy expenditure through modulating TAG storage.
MATERIALS AND METHODS
Reagents
The following rabbit polyclonal antibodies were used for these studies: p-AKT, p-AMPK, AMPK, p-glycogen synthase, glycogen synthase, p-GSK3B, GSK3B, p-ACC, ACC, LC3B (Cell Signaling), Glut1 (Abcam), myoglobin (Santa Cruz Biotechnology), OXPAT (Novus Biologicals), anti-calnexin (Sigma), and mouse monoclonal AKT (Cell Signaling).
Animals
Mouse FIT2 cDNA was cloned downstream of the mouse creatine kinase promoter for use in transgenesis. CKF2 mice were backcrossed for 10 generations to C57BL/6J. All experiments were conducted using 2–3-month-old male transgenic and WT littermates.
Animal Studies
Study protocols were approved by the Institute of Animal Studies of the Albert Einstein College of Medicine. Mice were fed a standard chow (LabDiet number 5058) or high fat diet (Research Diets, Inc., number D12492) composed of 60 kcal % fat for the indicated amount of time. Body weight was monitored weekly during the study period. Prior to GTT or ITT, mice were fasted overnight for 12 h with ad libitum access to water and then administered glucose (1 g/kg) or insulin (1 unit/kg) intraperitoneally, respectively. Blood glucose was measured in blood samples collected from tail vain using a glucometer (Accu-Check Compact, Roche Applied Science).
Tissue Culture and Adenoviral Infections
C2C12 myocytes were cultured in DMEM (Invitrogen) supplemented with 10% fetal bovine calf serum and penicillin/streptomycin. For differentiation, C2C12 cell were induced at 80–90% confluency by switching the cell media to DMEM supplemented with 2% horse serum (differentiation media). On day 5 of differentiation, C2C12 were infected for 12 h in differentiation media. All experiments were performed 36 h post-infection.
C2C12 Fatty Acid Oxidation, BCAA Oxidation, and Glucose Transport
C2C12 cells were differentiated in 6-well plates and infected with empty or C-terminal tagged FIT2 (FIT2-V5) adenovirus as described above. For fatty acid oxidation, differentiation media was then replaced with 1 ml of low glucose DMEM (Invitrogen) supplemented with 100 μm [3H]palmitic acid/BSA (0.4 μCi/ml) and 1 μm l-carnitine. After 4 h, media was collected and centrifuged at 16,000 × g for 15 min in a table top centrifuge to remove cellular debris. 100 μl of media was then treated with 900 μl of 20 mm Tris-HCl, 5% w/v activated charcoal (Sigma) for 30 min at room temperature to absorb fatty acids. Samples were then centrifuged at 16,000 × g for 15 min at room temperature. 200 μl of the supernatant was used to determine fatty acid oxidation by measuring tritiated water using a scintillation counter and normalized to total protein.
BCAA oxidation was performed in C2C12 myotubes expressing FIT2-V5 cultured in 6-well plates using a pulse-chase method. C2C12 myotubes were pulsed for 30 min with DMEM 5% horse serum supplemented with [3H]leucine (1 μCi/ml). After 30 min, C2C12 myotubes were extensively washed with Krebs-Henseleit buffer and then chased for 4 h with Krebs-Henseleit buffer supplemented with 5 mm glucose, 10 mm leucine, and 0.2% (w/v) fatty acid-free BSA. After 4 h, media was collected and centrifuged at 16,000 × g for 15 min in a table top centrifuge to remove cellular debris. 500 μl of media was then treated with 500 μl of 6% perchloric acid for 30 min at room temperature to precipitate protein. Samples were then centrifuged at 16,000 × g for 15 min at room temperature. 200 μl of the supernatant was used to determine BCAA oxidation by measuring tritiated water using a scintillation counter and normalized to total protein.
For glucose uptake, C2C12 myotubes were starved in low glucose DMEM for 2 h, then washed twice with KRPH buffer (5 mm NaH2PO4, 20 mm HEPES, 1 mm MgSO4, 1 mm CaCl2, 136 mm NaCl, 4.7 mm KCl), and incubated for 20 min in 2 ml of KRPH buffer supplemented with 5 μm 2-deoxy-d-glucose, 1 mCi/ml 2-[3H]deoxy-d-glucose, plus or minus 100 nm insulin. After 20 min, C2C12 myotubes were washed extensively with PBS buffer and lysed with 1 ml of RIPA buffer supplemented with EDTA-free protease inhibitors (Roche Applied Science) and phosphatase inhibitors (Calbiochem). Glucose uptake was determined by measuring 800 μl of lysate using a scintillation counter and normalized to total protein.
Fluorescence Microscopy
C2C12 myocytes were differentiated in 25-mm glass bottom dishes (Wilco) and infected with empty or C-terminally tagged FIT2 (FIT2-V5) adenovirus as described above. Visualization of LDs in C2C12 cells were performed as described previously using BODIPY 493/503 (15).
Physiological Measurements
Metabolic measurements (oxygen consumption, carbon dioxide production, food intake, and physical activity) were obtained continuously using a CLAMS (Columbus Instruments) open-circuit indirect calorimetry system for 5 consecutive days and normalized to lean body mass. Mice were allowed to acclimate for 2 days in individual chambers prior to data collection.
Mitochondria Isolation and Mitochondrial ATP Production Rate
Mitochondria isolation and mitochondrial ATP production rate were performed as described previously with some modifications (17). Briefly, 50 mg of quadriceps was homogenized in 800 μl of Buffer A (100 mm KCl, 50 mm Tris-HCl, pH 7.4, 5 mm MgCl2, 1.8 mm ATP, and 1 mm EDTA) plus EDTA-free protease inhibitors (Roche Applied Science) and spun down at 1,000 × g for 20 min at 4 °C. The supernatant was then spun down at 10,000 × g for 10 min at 4 °C. The resulting pellet was then washed in 800 μl of Buffer A and spun down at 9,000 × g for 10 min at 4 °C. The resulting pellet was resuspended in 50 μl of Buffer B (180 mm sucrose, 35 mm KH2PO4, 10 mm magnesium acetate, and 5 mm EDTA) plus protease inhibitors. Protein concentration was determined by BCA protein assay (Pierce). Mitochondria lysates were then diluted 1:500 in Buffer B and immediately used to determine maximal mitochondrial ATP production rate using the following substrates for oxidation: 10 mm glutamate plus 1 mm malate and 35 mm ADP (state 3 respiration). ATP production was monitored using the ENLITEN® ATP bioluminescence detection kit (Promega). All reactions were conducted simultaneously at 25 °C for 25 min in a 200-μl reaction volume using 10 μl of diluted mitochondria protein, 100 μl of the luciferase/luciferin reagent, and substrates for oxidation plus or minus ADP (state 2 respiration). Mitochondrial ATP production rate was normalized to total protein.
Blood Metabolites
Blood glucose was measured under fasting conditions in blood samples collected from tail vein using a glucometer (Accu-Check Compact, Roche Applied Science). Plasma insulin levels were measured under fasting conditions and after treating mice with 1 g/kg glucose intraperitoneally using ELISA (Millipore). Total serum ketone bodies and lactate were determined using a colorimetric assay (Stanbio and Bioassays). Total serum triacylglyceride and cholesterol levels were measured using a colorimetric assay (Infinity).
DGAT Activity Assay
DGAT activity was determined using microsomes isolated from quadriceps as described previously (18). TAG was separated by TLC and quantified as described previously (15).
In Vivo [14C]Glucose Partitioning into TAG
Mice were fasted for 4 h and injected intraperitoneally with universally labeled d-[14C]glucose (310 mCi/mmol, PerkinElmer Life Sciences) and insulin at 2,500 μCi/kg and 1 unit/kg, respectively. Quadriceps were collected and freeze-clamped 15 min post-injection, homogenized in 1 ml of PBS, and spun down 16,000 × g at 4 °C. 50 μl of the resulting supernatant was used for scintillation counting to determine total glucose uptake. Protein concentration was determined by BCA protein assay (Pierce). Lipids were then extracted from 1 mg of protein and TAG separated by TLC as described previously (15). Radioactive TAGs were quantified by using PhosphorImager analysis and represented as a rate of d-[14C]glucose incorporated into TAG (arbitrary units obtained from PhosphorImager analysis) per mg of protein normalized to total glucose uptake.
Quantification of Muscle Glycogen Content
Muscle glycogen content was determined in WT and CKF2 quadriceps as described previously (19).
Ex Vivo Glucose Transport
Ex vivo basal and insulin-stimulated glucose transport was performed using extensor digitorum longus (EDL) muscle as described previously (20).
Histology
Quadriceps were elongated, placed on cork, covered with OCT, and frozen in pre-chilled 2-methylbutane. Samples were then sectioned and stained for neutral lipids using Oil Red-O.
Quantification of TAG by Thin Layer Chromatography
Lipids were extracted from 1 mg of protein isolated from WT and CKF2 quadriceps using chloroform/methanol (2:1). The organic phase was transferred to glass bottom tubes and dried down under a stream of nitrogen. Total TAG was then quantified using TLC as described previously (15). TAG was quantified from C2C12 myotubes cultured in 6-well plates as described previously (15).
Gene Expression Analysis
cDNA was synthesized from mouse quadriceps RNA using SuperScript III first strand cDNA synthesis kit and oligo(dT) primers (Invitrogen). Gene expression analysis was assessed by quantitative SYBER Green real time PCR using a 7300 real time PCR system (Applied Biosystems). Primers were obtained from Invitrogen; sequences are available upon request. Relative quantification of each target was normalized to hypoxanthine-guanine phosphoribosyltransferase.
ATP Measurements
HPLC-based nucleotide analysis was performed on freeze-clamped quadriceps as described previously (21).
Metabolite Analysis
Mass spectrometry-based metabolite profiling was performed following a 4-h fast as described previously (22).
Western Blotting
Tissues were homogenized in RIPA buffer plus EDTA-free protease inhibitors (Roche Applied Science). Protein concentration was determined by BCA protein assay (Pierce), and 80 μg of protein were used per sample. Samples were separated by SDS-PAGE on 8, 12, or 15% polyacrylamide gels, transferred to nitrocellulose membranes (Bio-Rad), and incubated with indicated antibodies. Quantification of signals was performed using an Odyssey infrared scanner (Li-Cor).
Statistical Analysis
All quantitative data are represented as mean ± S.E. p values were generated by Student's t test.
RESULTS
FIT2 Expression in Skeletal Muscle Results in Triacylglyceride Accumulation
To examine the effects of FIT2 overexpression in skeletal muscle, we generated muscle-specific FIT2 transgenic mice (CKF2) by using the mouse creatine kinase promoter. We identified two founder lines, 130 and 137, that exhibited similar levels of skeletal muscle-specific expression without enhanced expression in heart or changes in FIT1 expression (Fig. 1A and data not shown). Because both lines exhibited similar phenotypes, we arbitrarily focused on line 137 throughout these studies. CKF2 mice were viable, reproduced normally, did not die prematurely, and had similar food intake as wild-type (WT) mice (see below). We have previously demonstrated that overexpression of FIT2 in mouse liver and in cells in culture resulted in the accumulation of TAG in lipid droplets (14, 15). As expected, overexpression of FIT2 resulted in a significant intramyocellular accumulation of neutral lipid as indicated by Oil-Red O staining of sections of quadriceps (Fig. 1B). To further characterize this phenotype, total lipids were extracted from quadriceps of 12-week-old WT and CKF2 mice fed a standard chow (SC) diet and analyzed using thin layer chromatography. CKF2 mice exhibited a 7-fold increase in total TAG (Fig. 1C). Diacylglycerol acyltransferase activity was unchanged in muscles from CKF2 mice relative to WT muscle (Fig. 1D), supporting previous findings that FIT2 does not mediate triacylglyceride biosynthesis (14).
FIGURE 1.

Skeletal muscle of CKF2 mice has increased expression of FIT2 and increased IMTG. A, FIT2 cDNA was cloned downstream of the mouse creatine kinase promoter, and this resulted in skeletal muscle-specific expression without enhanced expression in heart. FIT1 expression levels were unaltered in muscles of CKF2 mice. B, Oil Red-O staining of WT and CKF2 quadriceps (Quad) indicates increased accumulation of IMTG. Sol, soleus; WAT, white adipose tissue; AU, arbitrary units. (Scale bar, 500 μm.) C, quantification of IMTG in quadriceps by TLC. A representative TLC is shown. Data are represented as mean ± S.E.; n = 5 mice per genotype. D, DGAT activity was unchanged in skeletal muscles from CKF2 mice. DGAT activity assays were performed as described under “Materials and Methods.” Data are represented as mean ± S.E.; n = 4 mice. ***, p < 0.001.
Complete Protection from High Fat Diet-induced Weight Gain
Increased expression of FIT2 in skeletal muscle had a profound effect on body weight. At 6 weeks of age CKF2 exhibited 20% less body weight as compared with their WT littermates (Fig. 2A, time point zero). EchoMRI analysis indicated that the difference in body weight was due to decreased fat mass and lean mass (Fig. 2B). Decreased lean mass was not due to increased activation of atrophy pathways because Murf1 and Atrogin-1/Fbox32 were not increased but were decreased in CKF2 muscle (Fig. 3A). However, CKF2 mice had increased levels of LC3-II compared with WT, potentially indicating an increase in autophagy (Fig. 3B). Increased autophagy may be an indication of decreased energy state in muscle (discussed below). We then challenged CKF2 mice with high fat (HF) diet beginning at 6 weeks of age for 12 weeks. Surprisingly, CKF2 mice were completely protected from HF diet-induced weight gain and maintained a similar body weight and fat mass as CKF2 mice on a SC diet (Fig. 2, A and B). These findings raised the possibility that FIT2 overexpression might be affecting energy expenditure.
FIGURE 2.

CKF2 mice are protected from diet-induced weight gain and increased energy expenditure. A, growth curve of WT and CKF2 mice fed SC or HF diet. Data are represented as mean ± S.E.; n = 7 and n = 6 for each genotype for SC and HFD, respectively. WT SC versus CKF2 SC p < 0.0001; WT HF versus CKF2 HF p < 0.0001; CKF2 SC versus CKF2 HF p < 0.001. B, body composition was determined by EchoMRI analysis and represented as mean ± S.E., n = 4, for each genotype. **, p < 0.001; ***, p < 0.0001.
FIGURE 3.
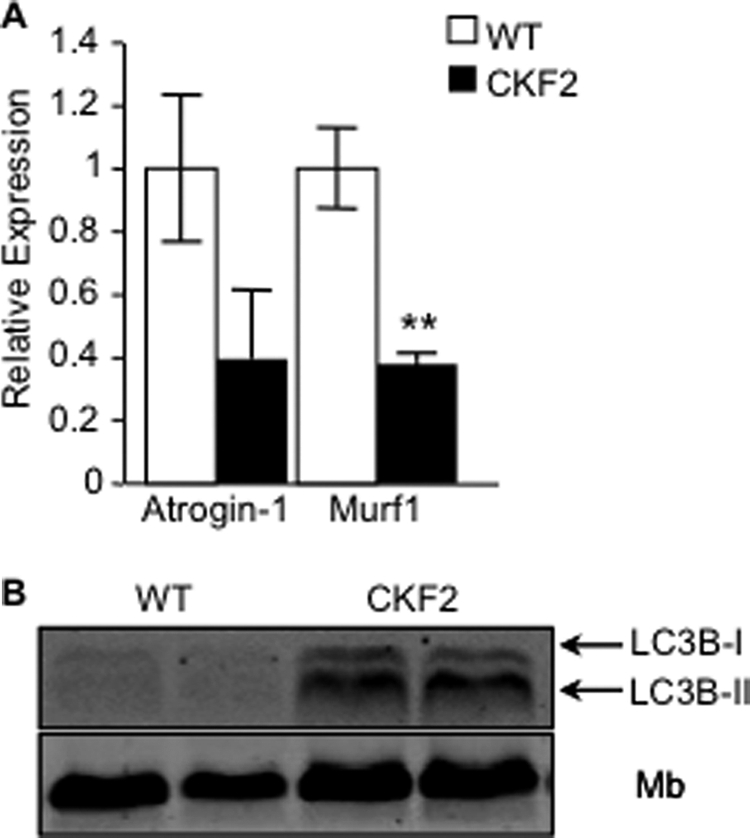
No increase in muscle atrophy markers. A, real time PCR analysis of E3 ligases Atrogin-1 and Murf1 indicated that CKF2 mice did not have increased atrophy in quadriceps. B, CKF2 mice exhibited increased autophagy as indicated by increased levels of LC3B-I and LC3B-II; data are represented as mean ± S.E.; n = 4 mice per genotype; **, p < 0.01. Mb, myoglobin.
FIT2 Expression Increases Energy Expenditure
Several possible mechanisms can contribute to the maintenance of body weight in CKF2 mice on SC and HF diets relative to their respective WT controls, namely decreased food intake, increased voluntary physical activity, and increased thermogenesis. Because CKF2 mice are leaner than WT mice even when fed a SC diet, we focused the remainder of our studies on mice fed a SC diet. CKF2 mice exhibited similar food intake as WT mice and had decreased physical activity compared with WT mice (Fig. 4, A and B). CKF2 mice had decreased body temperature compared with WT littermates that was correlated with significantly decreased UCP-1 protein levels in brown adipose tissue compared with WT mice (Fig. 4, C and D). In addition, UCP-3 expression in skeletal muscle was unchanged (Fig. 4E). An alternative explanation for the leanness of CKF2 mice and protection from HF diet-induced weight gain is that CKF2 mice have enhanced energy expenditure independent of enhanced thermogenesis. To determine the mechanisms by which CKF2 mice are lean and resistant to diet-induced weight gain, we measured energy expenditure using indirect calorimetry of mice fed a SC diet. We chose to examine SC-fed mice because CKF2 mice fed a SC diet were already protected from body weight gain over time (Fig. 2A), and thus we could avoid complicating effects of HF diet on our analysis of metabolism. CKF2 mice had increased oxygen consumption in both the light and dark cycles as compared with WT mice, indicating increased energy expenditure (Fig. 4F). CKF2 mice also exhibited a significant increase in carbon dioxide production compared with WT mice (Fig. 4F). Respiratory quotient (RQ) was calculated to determine whether CKF2 mice have a particular preference for carbohydrate or fatty acids in their substrate utilization (Fig. 4F). RQ in CKF2 and WT mice increased from the light phase to the dark phase indicating that CKF2 mice were similarly metabolically flexible as WT mice. CKF2 mice did show a slight but significant reduction in RQ in the dark phase, which reflects a selective decline in glucose oxidation relative to fatty acid and/or amino acid oxidation. However, given that CKF2 mice had significantly higher plasma ketone bodies (Table 1), oxidation of fatty acids by liver partly explains the small decrease in RQ. We observed a significant increase in serum triacylglyceride and free fatty acids and a small but significant decrease in cholesterol. Levels of serum lactate were unchanged (Table 1).
FIGURE 4.

Food intake, physical activity, or body temperature does not explain leanness of CKF2 mice on chow diet. A, CKF2 mice exhibited similar food intake as WT mice fed SC. B, CKF2 mice have decreased physical activity compared with WT mice. C, CKF2 mice exhibited decreased body temperature compared with WT mice. D, UCP-1 levels in brown adipose tissue were decreased in CKF2 relative to WT mice. E, UCP-3 levels trended lower (but not statistically significant p = 0.055) in skeletal muscle of CKF2 relative to WT mice. Data are represented as mean ± S.E.; n = 4 mice per genotype. F, measurement of metabolic parameters by indirect calorimetry of WT and CKF2 mice fed S.E.; n = 4 for each genotype. *, p < 0.01; **, p < 0.001; ***, p < 0.0001.
TABLE 1.
CKF2 mice serum metabolites
Blood was collected from CKF2 mice after a 6-h fast. Serum metabolites were measured using colorimetric assay. CKF2 exhibited increased serum TAG and free fatty acid (FFA), and this correlated with increased levels of ketone bodies likely indicating increased fatty acid oxidation by liver. Cholesterol levels were significantly elevated. Serum lactate levels were not significantly different. Data are represented as mean ± S.E.; n = 4 mice.
| Metabolite | WT | CKF2 |
|---|---|---|
| Triglyceride (mg/dl) | 65.27 ± 4.60 | 85.76 ± 11.63a |
| Cholesterol (mg/dl) | 82.22 ± 3.01 | 73.11 ± 1.75a |
| FFA (nmol/ml) | 562.52 ± 30.04 | 858.82 ± 66.24b |
| Ketones (nmol/ml) | 314.84 ± 50.14 | 700.21 ± 82.10b |
| Lactate (nmol/ml) | 3.39 ± 0.687 | 2.74 ± 0.306 |
a p < 0.001.
b p < 0.0001.
FIT2 Enhances Basal Glucose Transport
Intramyocellular accumulation of lipids has been correlated with insulin resistance and type II diabetes (8). The increased intramyocellular TAG accumulation in skeletal muscle and decreased RQ prompted us to analyze glucose and insulin tolerance. CKF2 mice fed a SC diet exhibited decreased fasting glucose levels as compared with WT littermates (Fig. 5A). Moreover, CKF2 mice fed HF diet maintained low fasting glucose to a similar level as CKF2 mice fed a SC diet, indicating a major change in glucose metabolism in CKF2 mice compared with WT mice (Fig. 5A). Glucose tolerance test (GTT) experiments in SC-fed animals indicated that CKF2 mice had a more rapid glucose excursion rate than WT mice (Fig. 5B). This enhanced glucose tolerance was not a result of an increased insulin response, as CKF2 mice exhibited similar serum insulin levels as WT mice at the 15-min time point of the GTT (Fig. 5C). In contrast to enhanced glucose tolerance, CKF2 mice exhibited an attenuated response to insulin during insulin tolerance tests (ITT), where insulin did not enhance glucose disposal (Fig. 5D). This decrease in response to insulin in CKF2 mice was correlated with decreased insulin-induced phosphorylation of AKT in skeletal muscle (Fig. 5E). Taken together, the results of the GTT and ITT suggested that CKF2 mice had increased basal glucose transport independent of insulin-stimulated glucose transport mediated by Glut4. This result prompted us to quantify the levels of Glut4 and Glut1 in skeletal muscle of CKF2 mice. Western blot analysis of CKF2 quadriceps indicated that although Glut4 levels were similar between CKF2 and WT mice, in CKF2 mice there was expression of Glut1, a glucose transporter not typically expressed in adult skeletal muscle (Fig. 5F) (23). Because Glut1 has a similar Km value for transport of glucose as Glut4 (24, 25), it is likely that the low glycemia and increased glucose tolerance in CKF2 mice is the result of Glut1 expression. These results are consistent with studies conducted in a transgenic mouse having skeletal muscle-specific overexpression of Glut1 that exhibited low plasma glucose, increased basal glucose transport, and is unresponsive to insulin (26, 27).
FIGURE 5.

CKF2 skeletal muscle has increased glucose transport. A, fasting glucose levels in 18-week-old WT and CKF2 mice fed SC or HFD. CKF2 exhibited decreased fasting glucose independent of diet. B, GTT showed that CKF2 mice fed SC exhibited increased glucose tolerance. C, plasma insulin levels before and after glucose challenge (1 g/kg intraperitoneally) for the times indicated. D, ITT indicated decreased response of CKF2 mice to insulin-fed SC. For GTT, ITT, and insulin measurements, data are represented as mean ± S.E.; n = 5 mice per genotype. E, phospho-AKT levels were quantified by Western blot analysis from isolated EDL muscles treated with or without insulin. Levels of phospho-AKT were normalized to total AKT. Data are represented as mean ± S.E.; n = 4 for each genotype and condition. AU, arbitrary units. F, levels of GLUT4, GLUT1, and PDK1 in quadriceps of WT and CKF2 mice fed SC. Myoglobin (Mb) levels were unchanged and served as a loading control. A representative Western blot and quantification are shown. Data are represented as mean ± S.E.; n = 4 mice per genotype. G, basal and insulin-stimulated glucose transport in isolated EDL muscle. Data are represented as mean ± S.E.; n = 4 mice per genotype per condition. *, p < 0.01; **, p < 0.001; ***, p < 0.0001.
Skeletal muscles from CKF2 mice had significantly increased levels of pyruvate dehydrogenase kinase 1 (PDK1), suggestive of a block in pyruvate oxidation by pyruvate dehydrogenase (Fig. 5F). To determine the degree to which increased glucose disposal in CKF2 mice is due to uptake by skeletal muscle, we quantified both basal and insulin-stimulated glucose transport in skeletal muscle ex vivo. Basal glucose transport in CKF2 EDL mice was significantly elevated relative to WT controls and, remarkably, was not significantly increased by insulin stimulation (Fig. 5G). The data indicate that skeletal muscle of CKF2 mice is maximally permeable to glucose in the basal state, supporting a role for Glut1 expression in mediating glucose transport in skeletal muscle of CKF2 mice.
Utilization of Glucose for Glycerol 3-Phosphate Synthesis
Given the high rate of glucose transport in skeletal muscle of CKF2 mice, we determined the metabolic fate of glucose taken up by skeletal muscle from CKF2 mice. High rates of glucose transport can enhance glycogen synthesis (28). However, glycogen levels in muscles from CKF2 mice were significantly decreased compared with WT muscle, which correlated with increased levels of phosphoglycogen synthase and decreased levels of phospho-Gsk3β, indicating decreased glycogen synthesis in muscles from CKF2 mice (Fig. 6, A and B). The utilization of glucose for pyruvate oxidation in the TCA cycle was also unlikely given the high levels of PDK1 expression (Fig. 5F). Glucose-derived carbons can be used to generate the glycerol backbone for triacylglyceride biosynthesis. Because glycerol kinase activity is minimal in skeletal muscle, the glycerol 3-phosphate substrate required for de novo glycerolipid synthesis originates directly from glycolysis or from glyceroneogenesis, a process that draws on carbons from pyruvate, lactate, alanine, and TCA cycle intermediates such as malate (29, 30). Because CKF2 mice exhibited a 7-fold increase in intramyocellular TAG, we hypothesized that CKF2 mice had a high rate of glycerol 3-phosphate synthesis derived from glucose for the purpose of TAG synthesis. To determine the contribution of glucose to glycerol 3-phosphate synthesis in vivo, we injected WT and CKF2 mice with universally labeled [14C]glucose together with insulin to equalize glucose transport between CKF2 and WT mice and analyzed the amount of label partitioned into triacylglyceride from quadriceps muscle. CKF2 mice exhibited a significant 5-fold increase in [14C]glucose incorporation into TAG (Fig. 6C). Taken together, these results indicated that overexpression of FIT2 in skeletal muscle drives glucose uptake for the purpose of TAG glycerol synthesis and not glycogen synthesis.
FIGURE 6.

CKF2 skeletal muscle has decreased glycogen and increased partitioning of glucose for glycerol 3-phosphate synthesis. A, quantification of total glycogen in quadriceps of WT and CKF2 mice fed SC. Data are represented as mean ± S.E.; n = 5 mice per genotype. B, increased levels of phosphorylated glycogen synthase (p-GS) and decreased levels of phosphorylated GSK3β indicate decreased glycogen synthesis in skeletal muscle of CKF2 mice. A representative blot and quantification are shown. Data are represented as mean ± S.E.; n = 4 mice per genotype. Mb, myoglobin. C, increased conversion of [14C]glucose into glycerol 3-phosphate in quadriceps of CKF2 mice. All mice were given a bolus of insulin to maximize glucose transport. Data are represented as mean ± S.E.; n = 5 mice per genotype. *, p < 0.01; **, p < 0.001; ***, p < 0.0001.
FIT2 Alters Fuel Utilization in Skeletal Muscle
To determine how glucose utilization might relate to enhanced energy expenditure in CKF2 mice, we employed a mass spectrometry-based targeted metabolomics approach to measure a comprehensive panel of muscle metabolites in mice that were fasted for 4 h. CKF2 mice exhibited high muscle lactate and low pyruvate levels compared with WT mice. The rise in the lactate to pyruvate ratio in CKF2 muscle could indicate a highly reduced cytosolic redox state due to enhanced glucose uptake and glycolytic flux, whereas the CKF2-associated decline in pyruvate is consistent with increased glucose utilization for TAG biosynthesis (Fig. 7A). Acylcarnitine metabolites are generated as by-products of incomplete substrate catabolism and can therefore report on shifts in fuel selection and/or flux limitations at specific mitochondrial enzymes (22). Acetylcarnitine (C2) derives from mitochondrial acetyl-CoA, the universal end product of glucose, fatty acid and amino acid catabolism that in turn fuels the TCA cycle (6, 22). C2 was significantly increased in muscles of CKF2 mice, suggesting enhanced degradation of one or more of these substrates and/or impaired TCA cycle flux (Fig. 7B). By contrast, CKF2 mice exhibited a significant decrease in even-numbered medium and long chain acylcarnitine species (C14, C16, and C18) that are generated as by-products of β-oxidation (Fig. 7C), a signature that might reflect diminished rates of fat oxidation (22). Consistent with this prediction, expression of several known PPARα-regulated genes encoding proteins important in the transport (carnitine palmitoyltransferase 1β and carnitine O-acetyltransferase) and oxidation of acylcarnitines (very long chain acyl-CoA dehydrogenase and medium chain acyl-CoA dehydrogenase) were significantly lower in skeletal muscle of CKF2 mice than in muscle from WT mice (Fig. 7D). Moreover, levels of perilipin 5/OXPAT, also a PPARα target and proposed to be important in the regulation of lipolysis in skeletal muscle (31, 32), was significantly reduced in muscles of CKF2 mice (Fig. 7E).
FIGURE 7.

CKF2 mice have altered fuel utilization in skeletal muscle. A, CKF2 mice exhibited increased levels of lactate and decreased levels of pyruvate. The lactate/pyruvate ratio indicated that CKF2 had increased glycolysis. B, we observed a significant increase in C2-carnitine (acetylcarnitine) levels supporting increased glycolysis and oxidation in the TCA cycle. C, medium and long chain acylcarnitine species were decreased in CKF2 mice, indicating decreased fatty acid oxidation. D, muscles of CKF2 mice show significantly decreased expression of genes encoding proteins involved in fatty acid oxidation (carnitine palmitoyltransferase 1β (Cpt1b); very long chain acyl-CoA dehydrogenase (Acadl); medium chain acyl-CoA dehydrogenase (Acadm); carnitine O-acetyltransferase (Crat)). E, Western blot analysis indicates that CKF2 mice have decreased levels of the PPARα target perilipin 5/OXPAT in quadriceps. Data are represented as mean ± S.E.; n = 3 mice per genotype; *, p < 0.01. Mb, myoglobin. F, odd chain acylcarnitine species derived from oxidation of BCAAs were significantly increased in CKF2 mice. G, decreased concentrations of BCAA in skeletal muscles of CKF2 mice. H, increased TCA cycle intermediates in skeletal muscle of CKF2 mice. a-KG, α-ketoglutarate. Data in all panels are represented as mean ± S.E.; n = 5 mice per genotype. *, p < 0.01; **, p < 0.001; ***, p < 0.0001.
Odd chain acylcarnitine species such as C3 and C5:1 are derived from oxidation of the branched chain amino acids valine and isoleucine, whereas C5 acylcarnitine is derived from oxidation of leucine (22). Oxidation of valine also contributes to the C4-acylcarnitine pool (22). We observed a significant increase in odd chain acylcarnitine species (C3 and C5:1) and C4-acylcarnitine, strongly suggesting a large increase in BCAA oxidation in the quadriceps of CKF2 mice (Fig. 7F). Further supportive of an increase in BCAA oxidation, muscle concentrations of valine, leucine, and isoleucine were decreased, and glutamate and aspartate were increased in the CKF2 mice (Fig. 7G). Glutamate and aspartate are products of aminotransferases in amino acid catabolism and accumulate upon increases in BCAA catabolism. During physiological challenges that limit glucose availability, such as starvation or prolonged exercise, muscle catabolism of BCAA provides anaplerotic substrate to support the TCA cycle. Indeed, we found that concentrations of succinate, fumarate, and malate were significantly increased in muscles of CKF2 mice, consistent with the use of BCAA-derived carbons to “fill” the TCA cycle at a site distal to α-ketoglutarate dehydrogenase (Fig. 7H). Based on these results, we surmised that CKF2 muscles rely primarily on amino acids as a principal source of oxidative substrate, whereas glycolytic intermediates and fatty acids appear to be preferentially diverted toward triacylglyceride synthesis.
FIT2 Expression Decreases Energy State in Skeletal Muscle
Because triacylglycerol synthesis is an ATP-consuming process that siphons carbons and reducing equivalents away from catabolic fates, and because amino acids are the least efficient carbon fuel for ATP production, we predicted that oxidation of BCAA would not be sufficient to sustain a normal energy charge in muscle. Indeed, the concentration of ATP as measured by HPLC in skeletal muscle of CKF2 mice was significantly reduced relative to WT mice (Fig. 8A). One consequence of low ATP in CKF2 mice was increased phosphorylated AMPK and phosphorylation of the AMPK substrate ACC (Fig. 8B). Low ATP levels could arise from decreased energy efficiency coupled with the ATP costs of skeletal muscle triacylglycerol synthesis, as described above. Alternatively, we also considered the possibility that FIT2 overexpression results in defective mitochondria and impaired respiratory function. The latter mechanism seemed less likely because a decrease in NADH flow into the electron transport chain would be predicted to inhibit TCA cycle activity at the level of α-ketoglutarate dehydrogenase and malate dehydrogenase (33). The skeletal muscle organic acid profile shown in Fig. 7 argues against this option. To directly evaluate electron transport chain function, we measured mitochondrial ATP production rate during state 2 and state 3 respiration in isolated mitochondria from CKF2 and WT skeletal muscle. The mitochondrial ATP production rate in skeletal muscle of CKF2 mice was found to be similar to WT (Fig. 8C), indicating that decreased energy state in muscles from CKF2 mice was not due to inherent defects in respiratory function and the ability of mitochondria to synthesize ATP.
FIGURE 8.

CKF2 mice have decreased energy state in skeletal muscle. A, ATP levels in quadriceps muscle from WT and CKF2 mice were quantified by HPLC. Data are represented as mean ± S.E.; n = 5 mice per genotype. B, total AMPK, phosphorylated AMPK (p-AMPK), and total (ACC) and phosphorylated ACC (p-ACC) levels were determined by Western blot analysis following a 4-h fast in quadriceps muscle from WT and CKF2 mice. A representative blot and quantification are shown. Data are represented as mean ± S.E.; n = 4 mice per genotype. C, state 2 and state 3 mitochondrial ATP production rates were determined in mitochondria isolated from WT and CKF2 mice. *, p < 0.01; ***, p < 0.0001.
Overexpression of FIT2 Did Not Result in Reprogramming of C2C12 Myotube Metabolism
To determine whether any of the metabolic phenotypes described above in CKF2 mice have cell-autonomous components, we overexpressed FIT2 in a skeletal muscle cell line, C2C12, that can be differentiated into myotubes. Overexpression of FIT2 in C2C12 myotubes resulted in LD accumulation (Fig. 9A) without a significant increase in cellular TAG levels (Fig. 9B). Typically, FIT2 expression in HEK293 cells in culture resulted in a modest 2-fold increase in cellular TAG, without an increase in TAG biosynthesis (14, 15). However, we observed a small but significant increase in fatty acid oxidation in C2C12 myotubes expressing FIT2 (Fig. 9C), likely explaining the lack of a 2-fold increase in cellular TAG. No significant increase in p-AMPK levels was observed (Fig. 9D). Basal and insulin-stimulated glucose transport, p-AKT levels, Glut1 and Glut4 levels, and BCAA oxidation were unchanged in response to FIT2 expression (Fig. 9, D–G). Together, these findings indicate that the metabolic effects of FIT2 overexpression in skeletal muscle could not be recapitulated on a cell-autonomous level in C2C12 cells.
FIGURE 9.

Overexpression of FIT2-V5 in C2C12 myotubes did not result in reprogramming of C2C12 myotube metabolism. A, LD accumulation was visualized in C2C12 myotubes using BODIPY 493/503 shown in green. Cells were stained with Hoechst 33342 to visualize nuclei shown in blue. Scale bar, 10 μm. B, quantification of TAG in C2C12 myotubes infected with empty or FIT2-V5 adenovirus by TLC analysis. Data are represented as mean ± S.D.; n = 3 per condition. AU, arbitrary units. C, C2C12 myotubes infected with FIT2-V5 adenovirus exhibited a small but significant increase in fatty acid oxidation. D, phosphorylated AMPK (p-AMPK), total AMPK, Glut1, Glut4, and FIT2-V5 levels were determined by Western blot analysis. A representative blot and quantification are shown. Data are represented as mean ± S.E.; n = 3 per condition. E, glucose transport and phospho-AKT. F, induction was similar in both the basal and insulin-stimulated state between C2C12 myotubes infected with empty or FIT2-V5 adenovirus. G, C2C12 AdEmpty control and C2C12 myotubes expressing FIT2-V2 exhibited similar levels of BCAA oxidation. Data are represented as mean ± S.D.; n = 3 per condition. *, p < 0.01; **, p < 0.001; ***, p < 0.0001.
DISCUSSION
In this study we showed that overexpression of FIT2 in skeletal muscle resulted in increased concentrations of intramyocellular triacylglyceride (IMTG), increased utilization of BCAA, profoundly decreased cellular ATP levels, and complete protection from high fat diet-induced weight gain. Taken together, these results support the conclusion that FIT2 plays an important role in regulating skeletal muscle metabolism and energy expenditure and indicate a critical role of the lipid droplet in these processes in skeletal muscle.
Overexpression of FIT2 in skeletal muscle had a profound and unexpected effect on muscle energy metabolism. Of major importance is the observation that CKF2 mice were significantly leaner when fed a standard chow diet and completely protected from weight gain when fed a high fat diet that correlated with increased energy expenditure on either a standard chow or high fat diet. These phenotypes were not explained by changes in food intake, physical activity, or thermogenesis. It is important to emphasize that CKF2 mice were not in a negative energy state because they did not lose body weight over time, but rather they maintained a lower body weight and skeletal muscle energy balance. The first law of thermodynamics would dictate that CKF2 mice must have uncoupling of ATP synthesis from ATP consumption. One possibility is that ATP consumed by the processes of glycerol 3-phosphate production and triacylglyceride synthesis outpaced the capacity for ATP production. Because maximal rates of ATP synthesis were found to be normal in isolated mitochondria from CKF2 muscle, we presume that the insufficiency lies in the supply of reducing equivalents in vivo. For example, re-routing of glucose-derived carbons into the triacylglycerol pool might result in diminished flux through pyruvate dehydrogenase and the glycerol-phosphate shuttle, both of which serve as an important source of reducing equivalents (NADH and FADH2) for the mitochondrial electron transport chain. Indeed, increased levels of PDK1 strongly support the idea that pyruvate oxidation in limited in muscles of CKF2 mice (Fig. 5F). Fitting with this possibility, a block in the glycerol-phosphate shuttle might invoke compensatory flux through the aspartate/malate shuttle, as suggested by the increase in muscle concentrations of these metabolites (Fig. 7H).
CKF2 mice have many of the hallmarks of metabolic adaptations to starvation, such as low muscle ATP, high AMPK activity, increased BCAA oxidation, decreased physical activity, and decreased body temperature (34–36). A major point of divergence from a typical starvation phenotype is that CKF2 mice have decreased oxidation of fatty acids in skeletal muscle in the face of massive accumulation of IMTG. This is of interest and indicates a unique aspect of FIT2 expression that is not seen in other mouse models having high IMTG. For example, overexpression of DGAT1 in skeletal muscle resulted in a significant increase in IMTG associated with a significant increase in fatty acid oxidation (37). An opposite finding was obtained with a global deficiency of DGAT1 in mice that exhibited decreased IMTG coupled with decreased PPARα target gene expression (38–40). These findings indicate that skeletal muscle responds to changing levels of lipid droplet TAG with significant metabolic adaptations that affect energy expenditure and PPARα activity. In our studies, quantification of acylcarnitines suggested that fatty acid oxidation was decreased in CKF2 muscle relative to wild-type muscle. This phenotype was coupled with decreased expression of PPARα targets involved in fatty acid oxidation and the regulation of lipolysis in skeletal muscle, including perilipin 5/OXPAT. Perilipin 5/OXPAT is a lipid droplet-associated protein part of the perilipin family that is highly expressed in fatty acid oxidative tissues such as skeletal muscle and is a gene target of PPARα (31, 41). Data are just emerging indicating that perilipin 5/OXPAT might play an important role in regulating lipolysis (31, 32). Decreased TAG hydrolysis in skeletal muscle of CKF2 mice would be expected to decrease ATP production resulting from fatty acid oxidation. Our findings raise the possibility that FIT2-generated lipid droplets in CKF2 mice have a unique protein composition or subcellular localization that limits the hydrolysis of the TAG core and, more generally, that the lipid droplet is a major storage depot for fatty acid activators of PPARα that are released upon TAG hydrolysis. This latter conclusion is supported by recent studies of ATGL/desnutrin-deficient mice (42, 43). ATGL/desnutrin plays an important role in hydrolysis of lipid droplet TAG in skeletal muscle (44). Kratky and co-workers (42) recently demonstrated that ATGL/desnutrin deficiency in macrophages resulted in increased accumulation of TAG in lipid droplets associated with decreased ATP levels. Importantly, ATP deficiency was not ameliorated by supplementing ATGL/desnutrin null macrophage with glucose or fatty acids, indicating that fatty acyl-CoAs are likely first packaged into TAG and stored in lipid droplets before they can be hydrolyzed by ATGL/desnutrin for use in mitochondrial β-oxidation for ATP production. The study of Kratky co-workers (42) further supports the important role that lipid droplets may play in regulating energy production by regulating the amount of fatty acids available for oxidation and mitochondrial ATP synthesis. More recently, Zechner and co-workers (45) demonstrated that a muscle-specific deficiency of ATGL/desnutrin resulted in a significant reduction in PPARα target gene expression in heart, which could be complemented by re-expression of ATGL, and independently by treatment with a PPARα agonist, strongly supporting a role of the lipid droplet as a storage depot for PPARα ligands. Similar conclusions were drawn from the recent work of Sul and co-workers (43) using an adipose-specific deficiency of ATGL/desnutrin in mice.
One striking adaptation in CKF2 mice was increased muscle glucose transport. High levels of insulin-independent glucose transport in CKF2 muscles could be explained by expression of Glut1, a transporter normally not expressed in adult skeletal muscle of mice (23). Overexpression of Glut1 in mouse skeletal muscle resulted in a similar level of insulin-independent glucose transport in which skeletal muscle was maximally permeable to glucose (26, 27). Glut1 expression is a likely adaptation to chronic energy deprivation beginning in late embryogenesis when the muscle creatine kinase promoter is active to drive FIT2 transgene expression (46).
Skeletal muscle should have a finite capacity to store TAG in lipid droplets, which raises the question that if fatty acid oxidation is decreased in muscles of CKF2 mice, by what other mechanisms is the lipid droplet metabolized? One possibility is that autophagy of lipid droplets, also known as lipoautophagy (47) plays an important role in lipid droplet turnover in CKF2 mice that might allow for the disposal of TAG. However, it is not known if lipoautophagy will result in a similar level of fatty acid oxidation as the ATGL-mediated pathway or instead if fatty acids released from lysosomes will be used in re-esterification reactions to generate phospholipids. Nonetheless, CKF2 mice did show increased levels of LC3-II suggestive of increased macroautophagy that would allow protein turnover for increased BCAA oxidation (47).
FIT2 is the anciently conserved member of this family and is ubiquitously expressed in all tissues, with highest expression in adipose depots (14) where it is regulated directly by PPARγ (14, 48). FIT1 is almost exclusively expressed in skeletal muscle of mouse and human and at much higher levels than FIT2 in skeletal muscle (14). The distinct tissue distribution pattern of FIT1 and FIT2 raises the idea that FIT2, being highly expressed in adipose tissue, is primarily involved in the generation of large lipid droplets for long term storage of triacylglycerides, whereas FIT1 is important for generating small lipid droplets involved in the rapid mobilization of triacylglycerides during increased ATP demand. It will be important in future studies to determine whether FIT1 and FIT2 play distinct roles in regulating muscle energy metabolism. In summary, our study indicates that FIT2 expression in skeletal muscle reprograms energy metabolism and supports an important role for the lipid droplet in regulating energy metabolism.
This work was supported, in whole or in part, by National Institutes of Health Grants HL082697 (to D. L. S.), 5F31DK083919 (to D. A. M.), NIHDK020541 (to G. J. S.), and R01-AG028930 (to D. M.). This work was also supported by a grant from the American Diabetes Association (to D. M.) and Grant AG-NS-0548-09 from The Ellison Medical Foundation (to T. K.).
- AMPK
- AMP-activated protein kinase
- LD
- lipid droplet
- BCAA
- branched chain amino acid
- TAG
- triacylglyceride
- ATGL
- adipose triacylglyceride lipase
- PPAR
- peroxisome proliferator-activated receptor
- GTT
- glucose tolerance test
- ITT
- insulin tolerance test
- SC
- standard chow
- EDL
- extensor digitorum longus
- HF
- high fat
- RQ
- respiratory quotient
- IMTG
- intramyocellular triacylglyceride
- DGAT
- acyl-CoA:diacylglycerol acyltransferase
- ACC
- acetyl-CoA carboxylase.
REFERENCES
- 1. Hakimi P., Yang J., Casadesus G., Massillon D., Tolentino-Silva F., Nye C. K., Cabrera M. E., Hagen D. R., Utter C. B., Baghdy Y., Johnson D. H., Wilson D. L., Kirwan J. P., Kalhan S. C., Hanson R. W. (2007) J. Biol. Chem. 282, 32844–32855 [DOI] [PMC free article] [PubMed] [Google Scholar]
- 2. She P., Reid T. M., Bronson S. K., Vary T. C., Hajnal A., Lynch C. J., Hutson S. M. (2007) Cell Metab. 6, 181–194 [DOI] [PMC free article] [PubMed] [Google Scholar]
- 3. Wolins N. E., Brasaemle D. L., Bickel P. E. (2006) FEBS Lett. 580, 5484–5491 [DOI] [PubMed] [Google Scholar]
- 4. Kiens B. (2006) Physiol. Rev. 86, 205–243 [DOI] [PubMed] [Google Scholar]
- 5. van Loon L. J. (2004) J. Appl. Physiol. 97, 1170–1187 [DOI] [PubMed] [Google Scholar]
- 6. Watt M. J., Heigenhauser G. J., Dyck D. J., Spriet L. L. (2002) J. Physiol. 541, 969–978 [DOI] [PMC free article] [PubMed] [Google Scholar]
- 7. Thyfault J. P., Cree M. G., Tapscott E. B., Bell J. A., Koves T. R., Ilkayeva O., Wolfe R. R., Dohm G. L., Muoio D. M. (2010) Am. J. Physiol. Regul. Integr. Comp. Physiol. 299, R926–R934 [DOI] [PMC free article] [PubMed] [Google Scholar]
- 8. Savage D. B., Petersen K. F., Shulman G. I. (2007) Physiol. Rev. 87, 507–520 [DOI] [PMC free article] [PubMed] [Google Scholar]
- 9. Greenberg A. S., Coleman R. A., Kraemer F. B., McManaman J. L., Obin M. S., Puri V., Yan Q. W., Miyoshi H., Mashek D. G. (2011) J. Clin. Invest. 121, 2102–2110 [DOI] [PMC free article] [PubMed] [Google Scholar]
- 10. Brasaemle D. L., Dolios G., Shapiro L., Wang R. (2004) J. Biol. Chem. 279, 46835–46842 [DOI] [PubMed] [Google Scholar]
- 11. Brasaemle D. L. (2007) J. Lipid Res. 48, 2547–2559 [DOI] [PubMed] [Google Scholar]
- 12. Zechner R., Kienesberger P. C., Haemmerle G., Zimmermann R., Lass A. (2009) J. Lipid Res. 50, 3–21 [DOI] [PubMed] [Google Scholar]
- 13. Harris C. A., Haas J. T., Streeper R. S., Stone S. J., Kumari M., Yang K., Han X., Brownell N., Gross R. W., Zechner R., Farese R. V., Jr. (2011) J. Lipid Res. 52, 657–667 [DOI] [PMC free article] [PubMed] [Google Scholar]
- 14. Kadereit B., Kumar P., Wang W. J., Miranda D., Snapp E. L., Severina N., Torregroza I., Evans T., Silver D. L. (2008) Proc. Natl. Acad. Sci. U.S.A. 105, 94–99 [DOI] [PMC free article] [PubMed] [Google Scholar]
- 15. Gross D. A., Snapp E. L., Silver D. L. (2010) PLoS One 5, e10796. [DOI] [PMC free article] [PubMed] [Google Scholar]
- 16. Saddik M., Lopaschuk G. D. (1991) J. Biol. Chem. 266, 8162–8170 [PubMed] [Google Scholar]
- 17. Wibom R., Lundin A., Hultman E. (1990) Scand. J. Clin. Lab. Invest. 50, 143–152 [DOI] [PubMed] [Google Scholar]
- 18. Levin M. C., Monetti M., Watt M. J., Sajan M. P., Stevens R. D., Bain J. R., Newgard C. B., Farese R. V., Sr., Farese R. V., Jr. (2007) Am. J. Physiol. Endocrinol. Metab. 293, E1772–E1781 [DOI] [PubMed] [Google Scholar]
- 19. Vaitheesvaran B., LeRoith D., Kurland I. J. (2010) Diabetologia 53, 2224–2232 [DOI] [PMC free article] [PubMed] [Google Scholar]
- 20. Chadt A., Leicht K., Deshmukh A., Jiang L. Q., Scherneck S., Bernhardt U., Dreja T., Vogel H., Schmolz K., Kluge R., Zierath J. R., Hultschig C., Hoeben R. C., Schürmann A., Joost H. G., Al-Hasani H. (2008) Nat. Genet. 40, 1354–1359 [DOI] [PubMed] [Google Scholar]
- 21. Ellis J. M., Mentock S. M., Depetrillo M. A., Koves T. R., Sen S., Watkins S. M., Muoio D. M., Cline G. W., Taegtmeyer H., Shulman G. I., Willis M. S., Coleman R. A. (2011) Mol. Cell. Biol. 31, 1252–1262 [DOI] [PMC free article] [PubMed] [Google Scholar]
- 22. Koves T. R., Ussher J. R., Noland R. C., Slentz D., Mosedale M., Ilkayeva O., Bain J., Stevens R., Dyck J. R., Newgard C. B., Lopaschuk G. D., Muoio D. M. (2008) Cell Metab. 7, 45–56 [DOI] [PubMed] [Google Scholar]
- 23. Santalucía T., Camps M., Castelló A., Muñoz P., Nuel A., Testar X., Palacin M., Zorzano A. (1992) Endocrinology 130, 837–846 [DOI] [PubMed] [Google Scholar]
- 24. Nishimura H., Pallardo F. V., Seidner G. A., Vannucci S., Simpson I. A., Birnbaum M. J. (1993) J. Biol. Chem. 268, 8514–8520 [PubMed] [Google Scholar]
- 25. Palfreyman R. W., Clark A. E., Denton R. M., Holman G. D., Kozka I. J. (1992) Biochem. J. 284, 275–282 [DOI] [PMC free article] [PubMed] [Google Scholar]
- 26. Marshall B. A., Ren J. M., Johnson D. W., Gibbs E. M., Lillquist J. S., Soeller W. C., Holloszy J. O., Mueckler M. (1993) J. Biol. Chem. 268, 18442–18445 [PubMed] [Google Scholar]
- 27. Ren J. M., Marshall B. A., Gulve E. A., Gao J., Johnson D. W., Holloszy J. O., Mueckler M. (1993) J. Biol. Chem. 268, 16113–16115 [PubMed] [Google Scholar]
- 28. Buse M. G., Robinson K. A., Marshall B. A., Mueckler M. (1996) J. Biol. Chem. 271, 23197–23202 [DOI] [PubMed] [Google Scholar]
- 29. Nye C. K., Hanson R. W., Kalhan S. C. (2008) J. Biol. Chem. 283, 27565–27574 [DOI] [PMC free article] [PubMed] [Google Scholar]
- 30. Hanson R. W., Reshef L. (2003) Biochimie 85, 1199–1205 [DOI] [PubMed] [Google Scholar]
- 31. Wolins N. E., Quaynor B. K., Skinner J. R., Tzekov A., Croce M. A., Gropler M. C., Varma V., Yao-Borengasser A., Rasouli N., Kern P. A., Finck B. N., Bickel P. E. (2006) Diabetes 55, 3418–3428 [DOI] [PubMed] [Google Scholar]
- 32. Wang H., Bell M., Sreenevasan U., Hu H., Liu J., Dalen K., Londos C., Yamaguchi T., Rizzo M. A., Coleman R., Gong D., Brasaemle D., Sztalryd C. (2011) J. Biol. Chem. 286, 15707–15715 [DOI] [PMC free article] [PubMed] [Google Scholar]
- 33. Kornberg H. L. (1970) Biochem. Soc. Symp. 30, 155–171 [PubMed] [Google Scholar]
- 34. Hardie D. G. (2008) Int. J. Obes. 32, Suppl. 4, 7–12 [DOI] [PubMed] [Google Scholar]
- 35. Shimomura Y., Obayashi M., Murakami T., Harris R. A. (2001) Curr. Opin. Clin. Nutr. Metab. Care 4, 419–423 [DOI] [PubMed] [Google Scholar]
- 36. Kozak L. P. (2010) Cell Metab. 11, 263–267 [DOI] [PMC free article] [PubMed] [Google Scholar]
- 37. Liu L., Shi X., Choi C. S., Shulman G. I., Klaus K., Nair K. S., Schwartz G. J., Zhang Y., Goldberg I. J., Yu Y. H. (2009) Diabetes 58, 2516–2524 [DOI] [PMC free article] [PubMed] [Google Scholar]
- 38. Smith S. J., Cases S., Jensen D. R., Chen H. C., Sande E., Tow B., Sanan D. A., Raber J., Eckel R. H., Farese R. V., Jr. (2000) Nat. Genet. 25, 87–90 [DOI] [PubMed] [Google Scholar]
- 39. Streeper R. S., Koliwad S. K., Villanueva C. J., Farese R. V., Jr. (2006) Am. J. Physiol. Endocrinol. Metab. 291, E388–E394 [DOI] [PMC free article] [PubMed] [Google Scholar]
- 40. Liu L., Yu S., Khan R. S., Ables G. P., Bharadwaj K. G., Hu Y., Huggins L. A., Eriksson J. W., Buckett L. K., Turnbull A. V., Ginsberg H. N., Blaner W. S., Huang L. S., Goldberg I. J. (2011) J. Lipid Res. 52, 732–744 [DOI] [PMC free article] [PubMed] [Google Scholar]
- 41. Yamaguchi T., Matsushita S., Motojima K., Hirose F., Osumi T. (2006) J. Biol. Chem. 281, 14232–14240 [DOI] [PubMed] [Google Scholar]
- 42. Chandak P. G., Radovic B., Aflaki E., Kolb D., Buchebner M., Fröhlich E., Magnes C., Sinner F., Haemmerle G., Zechner R., Tabas I., Levak-Frank S., Kratky D. (2010) J. Biol. Chem. 285, 20192–20201 [DOI] [PMC free article] [PubMed] [Google Scholar]
- 43. Ahmadian M., Abbott M. J., Tang T., Hudak C. S., Kim Y., Bruss M., Hellerstein M. K., Lee H. Y., Samuel V. T., Shulman G. I., Wang Y., Duncan R. E., Kang C., Sul H. S. (2011) Cell Metab. 13, 739–748 [DOI] [PMC free article] [PubMed] [Google Scholar]
- 44. Haemmerle G., Lass A., Zimmermann R., Gorkiewicz G., Meyer C., Rozman J., Heldmaier G., Maier R., Theussl C., Eder S., Kratky D., Wagner E. F., Klingenspor M., Hoefler G., Zechner R. (2006) Science 312, 734–737 [DOI] [PubMed] [Google Scholar]
- 45. Haemmerle G., Moustafa T., Woelkart G., Buttner S., Schmidt A., van de Weijer T., Hesselink M., Jaeger D., Kienesberger P. C., Zierler K., Schreiber R., Eichmann T., Kolb D., Kotzbeck P., Schweiger M., Kumari M., Eder S., Schoiswohl G., Wongsiriroj N., Pollak N. M., Radner F. P., Preiss-Landl K., Kolbe T., Rulicke T., Pieske B., Trauner M., Lass A., Zimmermann R., Hoefler G., Cinti S., Kershaw E. E., Schrauwen P., Madeo F., Mayer B., Zechner R. (2011) Nat. Med. 17, 1076–1085 [DOI] [PMC free article] [PubMed] [Google Scholar]
- 46. Biressi S., Molinaro M., Cossu G. (2007) Dev. Biol. 308, 281–293 [DOI] [PubMed] [Google Scholar]
- 47. Singh R., Cuervo A. M. (2011) Cell Metab. 13, 495–504 [DOI] [PMC free article] [PubMed] [Google Scholar]
- 48. Lefterova M. I., Zhang Y., Steger D. J., Schupp M., Schug J., Cristancho A., Feng D., Zhuo D., Stoeckert C. J., Jr., Liu X. S., Lazar M. A. (2008) Genes Dev. 22, 2941–2952 [DOI] [PMC free article] [PubMed] [Google Scholar]