

Background: Catalytic promiscuity is common, but its molecular basis is poorly understood.
Results: Differential scanning calorimetry reveals the local active site conformational landscape of a promiscuous detoxification enzyme, glutathione transferase A1-1, as “smooth” and heterogeneous.
Conclusion: Facile conformational exchange facilitates substrate promiscuity.
Significance: The results provide the first thermodynamic basis for catalytic promiscuity.
Keywords: Calorimetry, Enzyme Catalysis, Enzyme Turnover, Glutathione, Kinetics, Spectroscopy, Conformational Ensemble
Abstract
Enzymological paradigms have shifted recently to acknowledge the biological importance of catalytic promiscuity. However, catalytic promiscuity is a poorly understood property, and no thermodynamic treatment has described the conformational landscape of promiscuous versus substrate-specific enzymes. Here, two structurally similar glutathione transferase (GST, glutathione S-transferase) isoforms with high specificity or high promiscuity are compared. Differential scanning calorimetry (DSC) indicates a reversible low temperature transition for the promiscuous GSTA1-1 that is not observed with substrate-specific GSTA4-4. This transition is assigned to rearrangement of the C terminus at the active site of GSTA1-1 based on the effects of ligands and mutations. Near-UV and far-UV circular dichroism indicate that this transition is due to repacking of tertiary contacts with the remainder of the subunit, rather than “unfolding” of the C terminus per se. Analysis of the DSC data using a modified Landau theory indicates that the local conformational landscape of the active site of GSTA1-1 is smooth, with barrierless transitions between states. The partition function of the C-terminal states is a broad unimodal distribution at all temperatures within this DSC transition. In contrast, the remainder of the GSTA1-1 subunit and the GSTA4-4 protein exhibit folded and unfolded macrostates with a significant energy barrier separating them. Their partition function includes a sharp unimodal distribution of states only at temperatures that yield either folded or unfolded macrostates. At intermediate temperatures the partition function includes a bimodal distribution. The barrierless rearrangement of the GSTA1-1 active site within a local smooth energy landscape suggests a thermodynamic basis for catalytic promiscuity.
Introduction
Functional promiscuity is common among enzymes and proteins (1–4). Recently, there has been increased appreciation for the biological importance of their promiscuity, and this represents a change in a longstanding biological paradigm, wherein “specificity” was considered to be the defining feature of proteins, enzymes, and metabolic pathways (1–6). It is now clear that functionally useful promiscuity plays a role in the immune system (7–10), in signal transduction pathways (11), and in enzymatic detoxification (12–15). In these cases, the promiscuous interaction of a single enzyme or protein with multiple substrates or partners represents an evolutionary end point; the optimal function of the protein includes substrate promiscuity. Promiscuity may also be a useful trait of evolutionary intermediates that facilitates the appearance of new enzymes from an existing pool of scaffolds (3, 15–20). In this case, mutation of substrate-specific enzymes yields promiscuous intermediates, from which new substrate specificity evolves efficiently. However, in contrast to the well established contribution of transition state stabilization to catalysis and specificity, the molecular bases for biological promiscuity are unknown. For a few specific examples, x-ray crystallographic or spectroscopic methods have suggested structural or dynamic mechanisms by which enzymes achieve catalytic promiscuity (4, 12, 13, 21). In general, promiscuity has been correlated with increased structural “flexibility” of enzymes, although there has been no description of the detailed relationship between motion on different time scales and functional promiscuity (3, 12, 19, 22). Furthermore, despite the importance of promiscuity as a critical trait in several biological phenomena and the trend to consider enzymes as conformational ensembles, the thermodynamic basis for the conformational landscapes that foster promiscuity remains unexplored. Hypothetically, there are significant differences in the conformational landscapes of substrate-specific enzymes compared with catalytically promiscuous enzymes.
Two isoforms of human glutathione transferase (GST, glutathione S-transferase) provide an experimental model to understand catalytic promiscuity further. The homodimeric GSTA1-1 is an archetypal detoxification enzyme with extreme catalytic promiscuity (5, 12). As a predominantly hepatic enzyme, it plays a role in chemical detoxification by conjugating glutathione (GSH) to an extraordinary range of electrophilic substrates (12, 23–27). The promiscuity is conferred, in part, by a structurally flexible active site; the C terminus (Fig. 1) of each subunit provides a “lid” over the active site when substrates bind, but the location of the helix changes with different substrates (28–30). The active site can accommodate many substrates due to the plasticity of the C terminus. In contrast, the highly homologous isoform GSTA4-4, which has 68% sequence similarity (53.6% sequence identity) to GSTA1-1, exhibits very high substrate selectivity toward long chain alkenals derived from lipid peroxidation (31, 32). GSTA4-4 has a static C-terminal helix localized along one edge of the active site that does not undergo any rearrangement upon binding substrate (31, 32). The GSTA1-1/GSTA4-4 pair has been a powerful model for engineering substrate specificity and understanding its structural basis in GSTA4-4 (5, 12, 33, 34), but the molecular basis for the contrasting promiscuity of GSTA1-1 is not understood in any thermodynamic context. Therefore, we have performed scanning calorimetry with these GST isoforms and analyzed the results with a modified Landau theory of phase transitions, as described for protein folding (35, 36). The results provide the first thermodynamic comparison of the conformational landscape of promiscuous versus specific enzyme homologs, and they indicate that the GSTA1-1 C terminus behaves as a localized molten globule that undergoes “barrierless” transitions between a wide ensemble of conformations, in a “smooth” local energy landscape. In contrast, the C terminus of GSTA4-4 is part of a well defined macrostate of the entire folded subunit which unfolds cooperatively only by traversing a significant energy barrier. The smooth local landscape around the active site of GSTA1-1 reveals one thermodynamic basis for its extraordinary catalytic promiscuity.
FIGURE 1.

Ribbon diagram overlay of GSTA1-1 and GSTA4-4 homodimers. GSTA1-1 in complex with S-hexyl glutathione (Protein Data Bank code 1K3Y) is shown in cyan and GSTA4-4 in complex with S-(2-iodobenzyl) glutathione (Protein Data Bank code 1GUL) is shown in orange. Views are along the 2-fold axis of symmetry parallel (left) and perpendicular (right) to the page. The C-terminal helices of GSTA1-1 and GSTA4-4 are shown in dark blue and yellow, respectively. S-hexyl glutathione is displayed in magenta. Structural alignment and graphic were completed using PyMOL Molecular Graphics System (52).
EXPERIMENTAL PROCEDURES
Protein Expression, Purification, and Activity
Human GSTA1-1 and GSTA4-4 were expressed in Escherichia coli using the BL21 strain and purified via GSH-agarose and size exclusion chromatography as described previously (37). Construction of the rat GSTA1-1 (rGSTA1-1) Δ209–222 mutant has been described previously, as have the expression and purification (38, 39). Activity of all purified enzymes was determined using the 1-chloro-2,4-dinitrobenzene (CDNB) assay (40). Purity was verified using SDS-PAGE. Protein concentration for all experiments was determined using previously published molar absorptivity coefficients at 280 nm (12, 41), with the exception of rGSTA1-1 Δ209–222 concentrations, which were determined using the Thermo Scientific Pierce BCA Protein Assay kit (Thermo Fisher Scientific).
Differential Scanning Calorimetry (DSC)
Thermal denaturation experiments were conducted on a CAP-DSC2 microcalorimeter (MicroCal, Northampton, MA). In all cases, protein samples were dialyzed against 200× v/v 100 mm potassium phosphate buffer, pH 6.5, at 4 °C, and the dialysate was used for buffer reference scans and loaded into the reference cell for protein scans. Thermograms were collected at scan rates of 0.5 °C/min, 1 °C/min, or 2 °C/min; all data shown were collected at a scan rate of 2 °C/min, as no dependence on scan rate was noted. Unless otherwise noted, DSC scans were run from 10 to 80 °C, with a 10-min equilibration at 10 °C, and reversibility of the thermal transitions was evaluated by scanning to just above the highest thermal transition midpoint, cooling to 10 °C, and rescanning. The data were analyzed using Origin 7.0 software (OriginLab, Northampton, MA). Buffer reference scans were subtracted and the data normalized for protein dimer concentration before further analysis. Base lines were calculated using the cubic option in Origin 7.0, assuming no heat capacity change after unfolding, or extrapolated from the slope of the pretransition base line for variable-barrier analysis.
Circular Dichroism (CD)
Spectra were obtained using a Jasco model 720 CD spectropolarimeter (Easton, MD). The samples used for data collection were dialyzed against 200× v/v 20 mm potassium phosphate at pH 6.5 at 4 °C. The dialysate was used to obtain solvent reference scans. Far-UV CD spectra were obtained using 10 μm protein, and 50 μm protein was used for collection of near-UV CD spectra. 10 mm and 1 mm cuvettes were used for far-UV and near-UV data collection, respectively. Averaged CD signals, corrected for solvent and fast-Fourier transform-smoothed, were converted to mean residue molar ellipticity (Θ) for far-UV spectra.
Variable-barrier Analysis
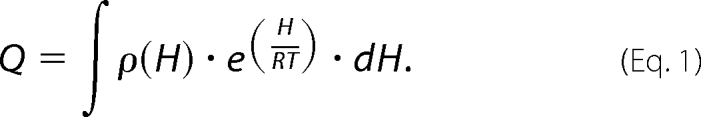
To determine the characteristics of the free energy landscape of the GSTs, a variable-barrier analysis developed by Muñoz and Sanchez-Ruiz was applied to the DSC data (35, 36). DSC allows experimental access to the partition function, which allows a calorimetric transition to be described in terms of a continuous distribution of enthalpic microstates (Equation 1), where Q is the partition function, H is the enthalpy scale, ρ(H) is the density of enthalpy microstates, and R is the gas constant.
 |
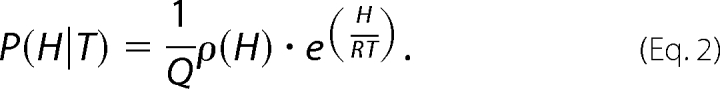
The probability, P(H|T), of finding the protein in a given enthalpic microstate, H, at temperature T, is determined by Equation 2.
 |
The relationship between the probability at temperature T and the “characteristic” temperature, T0, is shown by Equation 3, such that
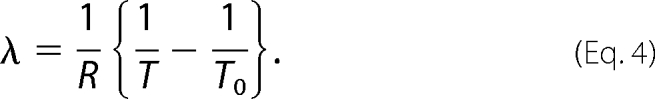
where C is a normalization constant found by setting the integral of P(H|)dH equal to 1 and λ is the reduced temperature (Equation 4):
 |
P(H|T0) is the probability density at T0, as determined by Equation 5
 |
where C′ is a normalization constant similar to C, and the free energy function, G0(H), is based on the Landau theory of critical transitions, as shown by Equation 6,
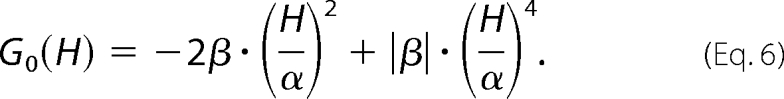 |
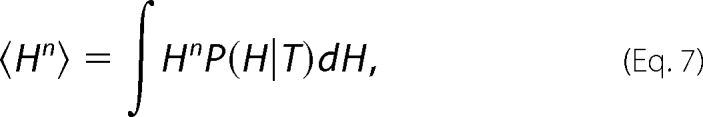
This yields a description of the distribution of states and hence the degree of “roughness” of the landscape, where the parameters α and β are the critical coefficients and enthalpy (H) is the order parameter. β>0 corresponds to the energy barrier separating two enthalpic macrostates, and 2α approximates the enthalpy difference between macrostates. When β is negative, there is a single macrostate in a smooth energy well, and α and β simply describe the shape of the free energy function. At this point the first and second enthalpy moments, H1 and H2, can be calculated by Equation 7
 |
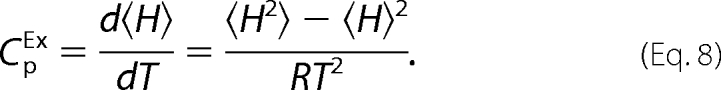
and compared with the DSC data in terms of the excess heat capacity with respect to the native state (CpEX) through Equation 8 in a least squares fitting routine
 |
To account for the asymmetry of protein folding, where the native (low enthalpy macrostate) and unfolded (high enthalpy macrostate) have differing heat capacities, one value of α is used for positive enthalpy values (αN) and one for negative enthalpy values (αP), such that
and
and
where f is the asymmetry factor (0 > f > 1). The DSC data were fit to Equation 8 using a custom Octave script employing a Levenberg-Marquardt minimization algorithm. The least squares fitting parameters were T0, β, Σα, and f. Goodness of fit was determined by R2 values and confidence interval analysis. The native heat capacity base line for all datasets was extrapolated from the slope of the pretransition base line.
RESULTS AND DISCUSSION
Differential Scanning Calorimetry
The DSC thermogram of apo-GSTA1-1 exhibited a significant change in excess Cp at temperatures as low as 30 °C, and much lower than the main unfolding transition, as seen in Fig. 2A. The peak maximum at 58 °C was observed for the main unfolding transition, which lies between the Tm determined from the temperature dependence of catalytic function of 56 °C and the structural unfolding Tm of 62 °C based on CD studies (42). The DSC data collected showed complete reversibility up to nearly 60 °C in repetitive scans, although complete scans up to 80 °C were irreversible. Thus, the thermogram of apo-GSTA1-1 can be described as a combination of a broad, reversible transition, followed by a comparatively sharp higher temperature transition. Because it is nearly impossible to interpret specific enthalpy values from complex or irreversible DSC thermograms, we do not report the parameters from standard deconvolution analysis. Rather, we exploit the DSC data obtained to describe the free energy landscape in subsequent sections.
FIGURE 2.

DSC thermograms of GSTs. A, GSTA1-1 WT. B, GSTA1-1 WT with 2 mm S-hexyl GSH. C, GSTA4-4 WT. D, rGSTA1-1 Δ209–222, with C terminus truncated. Data points are represented as open circles after protein dimer concentration normalization, buffer scan subtraction, and base-line analysis using the cubic option in Origin 7.0.
Similar results demonstrating resolved transitions for separate structural domains have been noted for the thermal unfolding of phenylalanine hydroxylase, which were attributed to the unfolding of the N-terminal regulatory domain, followed by unfolding of the rest of the enzyme (43). The C-terminal helix region of GSTA1-1 is likewise known to behave in an independent manner compared with the remainder of the protein, and it is likely that the low temperature transition in the DSC thermogram of GSTA1-1 corresponds to changes in this element. However, previous studies have shown that the C terminus retains helical structure in this temperature regime (42, 44). These results, in addition to the reversibility of the DSC scan up to 50 °C, suggest that the lower temperature transitions are not due to unfolding per se, but may be due to temperature-dependent sampling of different locations by the C-terminal helix, or restructuring of its tertiary contacts.
To investigate this predenaturation asymmetry further, similar studies were completed with addition of saturating concentrations of the product analog, S-hexyl glutathione, which is known to cause the C terminus to adopt a well defined conformation (45–47). Interestingly, the low temperature asymmetry features of the DSC trace of apo-GSTA1-1 were eliminated when S-hexyl GSH was bound, and the thermogram retained only the main unfolding transition, as observed in the absence of ligand, albeit shifted to a higher temperature. Resistance to temperature-induced unfolding was increased to 66 °C for the transition (Fig. 2B).
GSTA4-4, which has a static immobile C terminus, was also examined by DSC. In marked contrast to apo-GSTA1-1, apo-GSTA4-4 exhibited no low temperature transition, but yielded the sharp denaturation transition of the dimer (Fig. 2C), indicating a much more cooperative unfolding scheme than GSTA1-1. Surprisingly, this isoform is significantly less thermally stable than the GSTA1-1 isoform, with peak maximum of 50 °C. The striking absence of low temperature asymmetry in the GSTA4-4 DSC trace further suggests that the low temperature transition of GSTA1-1 is related to its heterogeneous C terminus. Furthermore, DSC data were collected with a rat GSTA1-1 mutant for which the C-terminal helix has been truncated at residue 209, as shown by Fig. 2D. The low temperature preunfolding enthalpy change that is prominent in the wild-type GSTA1-1 was eliminated in this mutant. Interestingly, the overall stability of the dimeric structure is not decreased by this truncation. Notably, the DSC scans demonstrated a lack of dependence on scan rate, indicating equilibrium conditions at each incremental temperature in the process.
Circular Dichroism
Taken together, the DSC results indicate that the low temperature changes in heat capacity of GSTA1-1 are due to conformational heterogeneity of the C terminus, which are absent in the GSTA4-4. The previous observations of an intact C-terminal helix that occupies different locations in crystal structures of GSTA1-1 with different ligands bound, and denaturant-dependent unfolding studies (29, 42, 48), suggest the possibility that the low temperature DSC transition reflects tertiary repacking of the helix rather than unwinding of its secondary structure. To explore this possibility and to verify that the low temperature transition was due primarily to the C-terminal helix region, CD studies were also completed. Spectra in the far-UV region for both GSTA1-1 and GSTA4-4 revealed ellipticity minima at 208 and 222 nm, indicative of a high degree of α-helix character. When examined as a function of temperature, there is no change in ellipticity before 50 °C for GSTA1-1. These data are presented in Fig. 3 and indicate that the C-terminal helix does not unfold in the temperature range below 50 °C. Far-UV CD results completed in a similar manner for GSTA4-4 demonstrated notable differences as the temperature was increased. The ellipticity in the α-helix region remains nearly constant until 50 °C, at which point a large signal change is noted. This agrees well with the DSC data presented above, indicating a high degree of cooperativity in the unfolding process for GSTA4-4, distinct from GSTA1-1. In addition, far-UV CD spectra demonstrated no change in secondary structure for either GSTA1-1 of GSTA4-4 below ∼50 °C, followed by an obvious and cooperative decrease in helical content at temperatures consistent with unfolding of the dimers. More interesting are the data collected in the near-UV region, shown in Fig. 4. The peak at 292 nm in the near-UV CD spectra of GSTA1-1 is characteristic of the presence of a tryptophan exciton couplet. Several aromatic residues, Phe-197, Tyr-165, and Tyr-166, are located within 6 Å of Trp-21 in the core of GSTA1-1 and are candidate partners for the exciton pair. Spectra from scans taken from 10 to 45 °C show little change in the tertiary packing environment around this residue, and the fine structure displays a similar lack of change at temperatures prior to 50 °C. Apparently, no major unfolding of the GSTA1-1 core has taken place in the temperature regime noted for the low temperature asymmetry in DSC results.
FIGURE 3.

Far-UV CD of GSTs with increasing temperature. A, GSTA1-1 WT. B, GSTA4-4 WT. The spectra are represented in order of increasing temperature from 10 °C (black) to 60 °C (lightest gray) in 5 °C increments. C, ellipticity as a function of temperature for GSTA1-1 (open circles) and GSTA4-4 (filled circles). Scans were taken of ∼10 μm protein in 20 mm potassium phosphate at pH 6.5.
FIGURE 4.

Near-UV of wild-type GSTA1-1 and W21F/F222W GSTA1-1. A, WT GSTA1-1 spectra are in solid lines, and scans from 10 °C (black) to 40 °C in 10 °C increments and 44 °C (lightest gray) are shown. GSTA1-1 W21F:F222W spectra are represented by dashed lines, and spectra from 10 °C (black) to 40 °C in 10 °C and 44 °C (lightest gray) are shown. B, percentage remaining ellipticity is shown at maximum as a function of temperature. GSTA1-1 WT is indicated by triangles, and GSTA1-1 W21F/F222W by squares. Scans were taken of ∼50 μm protein in 20 mm potassium phosphate at pH 6.5.
To determine whether changes in the tertiary packing of the C-terminal helix could be detected by near-UV CD spectra, a mutant of GSTA1-1 was constructed in which the core tryptophan residue at position 21 was replaced with Phe, and the phenylalanine at the end of C terminus was replaced with a Trp residue at position 222. This GSTA1-1 W21F/F222W mutant allows for direct evaluation of the C terminus using spectroscopic methods. CD spectra obtained for the GSTA1-1 W21F/F222W mutant in the far-UV region were similar to those obtained for the wild-type enzyme, although slightly less stable (supplemental Fig. S1). As with wild-type GSTA1-1, GSTA1-1 W21F/F222W demonstrated negligible changes in ellipticity in the 190–250-nm range prior to 50 °C. However, near-UV CD spectra for this mutant exhibit significant differences from wild type. The peak maximum for this mutant was shifted to 285 nm, clearly indicating a more solvent-exposed location. Additionally, signal intensity for this peak decreases drastically starting at 30 °C, well before the main unfolding transition, and in the same temperature range as the early DSC transitions for apo-GSTA1-1. Previous results also suggest that the helix does not “unfold” in this range (29). A DSC scan was also obtained with this mutant and displayed a profile nearly identical to wild-type GSTA1-1, with a significant increase in heat capacity at temperatures well below the main unfolding transition (supplemental Fig. S2). The obvious change in tertiary packing near the Trp-222 for this mutant at low temperature, combined with the lack of change in secondary structure prior to the higher temperature, global, unfolding transition, suggests that the low temperature DSC transitions observed for GSTA1-1 are due to repacking of the C terminus in locations with different solvation, rather than its unfolding in the temperature range below 50 °C.
Variable-barrier Free Energy Analysis
To understand more thoroughly the local conformational heterogeneity of the C terminus we have also examined the DSC data in terms of the variable-barrier model developed by Muñoz and Sanchez-Ruiz (35, 36). This model provides a direct analysis of the free energy barrier, or lack thereof, for equilibrium transitions between states based on the partition function using distributions of enthalpic energy states. As described by Freire (49) and exploited by Muñoz and Sanchez-Ruiz, DSC provides a direct measure of the partition function for states in equilibrium, where the enthalpy can be used as a measure of the extent of reaction between states. In this analysis, plots of G0(H) versus H provide one-dimensional representations of the reaction coordinate for the temperature-dependent transition, where the enthalpy is a surrogate for the extent of reaction. This analysis has been applied to protein folding, and here we extend this to analyze for the first time the local and global conformational transitions in GSTs. In addition, this analysis yields the distribution of enthalpy states at a given temperature through the partition function and thus provides an alternative view of the energy landscape (Fig. 5). To apply this analysis, the apo-GSTA1-1 thermogram was deconvoluted into two transitions, with the fit shown in Fig. 5A, to separate the low temperature region (Fig. 5A, red component) and the high temperature unfolding transition. The barrier analysis, as described under “Experimental Procedures,” was then performed with this two-component deconvolution for GSTA1-1 and compared with a one-component model for GSTA4-4. The low temperature transition of GSTA1-1 proved to be barrierless, as indicated by a single smooth well (Fig. 5B), and the distribution of enthalpic states at each temperature for this transition was unimodal and extremely broad (Fig. 5C). In contrast, the higher temperature transition for global unfolding(Fig. 5D, red) demonstrated a significant free energy barrier of 67.8 kJ/mol (Fig. 5E). The probability density shifts (Fig. 5F) from a single sharp unimodal distribution centered at low enthalpy at 325 K where the protein is completely folded to a bimodal distribution at 335 K, and then to a single broad distribution of enthalpy states at 345 K where the population is entirely unfolded. The comparison of the free energy contours and the probability density of enthalpy states for the low temperature transition and the high temperature transition provides further evidence that the low temperature transition is due to local conformational heterogeneity with barrierless transitions between enthalpy states, whereas the high temperature transition is associated with unfolding of the core of GSTA1-1. When applied to GSTA4-4, the free energy contour (Fig. 5H) is similar in shape to the main high temperature transition for GSTA1-1 except the depth of the free energy wells is lower, reflecting the increased stability of the core subunit scaffold of GSTA1-1 compared with GSTA4-4. The distribution of enthalpic states was significantly narrower (Fig. 5J), and the free energy barrier to unfolding was slightly less, at 39.4 kJ/mol. These results highlight a remarkable difference between the active site C-terminal region and the core subunit scaffold of GSTA1-1, and between the conformational landscape of GSTA1-1 and GSTA4-4. It is interesting that the highly heterogeneous C terminus of GSTA1-1, with a smooth landscape, is tethered to a core that is more stable than the core of GSTA4-4. Speculatively, the increased stability of the core of the promiscuous GSTA1-1 is required to accommodate the local heterogeneity of the C terminus.
FIGURE 5.

DSC deconvolutions (left), free energy profiles (center), and probability distributions of enthalpic states (right) for GSTA1-1 and GSTA4-4. Top row, GSTA1-1 low temperature transition DSC data (A), free energy profile (B), and probability distributions (C). Middle row, GSTA1-1 high temperature transition DSC data (D), free energy profile (E), and probability distributions (F). Bottom row, GSTA4-4 DSC data (G), free energy profile (H), and probability distributions (J). DSC scans (left column, A, D, and G) used to obtain the free energy profiles (center column, B, E, and H) and probability distributions (right column, C, F, and J) are shown. The GSTA1-1 thermogram (A and D) was deconvoluted into a low temperature transition (A, red line) and a high temperature transition (D, red line). Data points are shown as open circles, and the overall fit as black lines. The deconvoluted transitions are shown as gray and red lines. GSTA4-4 DSC data (G) were used without deconvolution. Thermograms are shown after buffer scan subtraction, protein dimer concentration normalization, and native-state base-line analysis. The low temperature region fitted parameters recovered from the free energy profiles were Σα = 3664.7 kJ/mol, T0 = 318.8 K, β = −30 kJ/mol, and f = 1 (R2 = 0.9933). The GSTA1-1 high temperature unfolding transition parameters obtained were Σα = 1042.1 kJ/mol, T0 = 337.4 K, β = 67.8 kJ/mol, and f = 0.28 (R2 = 0.9900), giving a significant free energy barrier for unfolding to occur. The entire data set for GSTA4-4 was fit using the same method, with Σα = 749.6 kJ/mol, T0 = 324.9 K, β = 39.4 kJ/mol, and f = 0.47 (R2 = 0.9287).
CONCLUSION
This work significantly extends the field of promiscuous enzymology. The DSC and CD analyses clearly indicate that the low temperature asymmetry in the DSC scan is due mainly to the dynamic C-terminal helix of GSTA1-1, which becomes localized when ligand is bound. A greater degree of conformational heterogeneity for apo-GSTA1-1, compared with GSTA1-1 when the active-site is occupied, agrees well with previous crystallographic (45, 46, 50, 51), NMR (47), and time-resolved fluorescence studies (12), and the data presented here. More interestingly, the DSC analysis based on modified Landau theory of phase transitions indicates that the low temperature asymmetry seen in the apo-GSTA1-1 DSC data is due to an increase in the number of accessible conformational substates accessible for sampling and that there are barrierless transitions between substates in the ensemble. Similar analyses for protein unfolding have revealed “barrierless unfolders.” Here, this analysis is used to study local conformational changes. There is a wide distribution of local conformational states around the active site that interconvert without significant free energy barriers between them. The local active site energy landscape is smooth. In contrast, at temperatures at which the unfolded and folded states are populated, both GSTA4-4 and the remainder of GSTA1-1 exhibit well defined energy barriers between the populated enthalpic macrostates, which is expected for a rough landscape between these states. Thus, GSTA1-1 represents an enzyme with a “fluid” active site that easily samples many conformations, attached to a subunit scaffold that populates a rigid folded state prior to unfolding at elevated temperature. This behavior is intuitively expected for a catalytically promiscuous enzyme, and these data are the first to establish this behavior in a thermodynamic framework. Although the generality of this behavior remains to be investigated, functional catalytic promiscuity correlates with a thermodynamically smooth active site landscape for GSTA1-1. The results further distinguish “traditional” enzymes from promiscuous enzymes. Whereas both substrate-specific enzymes and promiscuous enzymes lower the chemical transition state barrier enroute to product formation, GSTA1-1 additionally lowers energetic barriers to conformational rearrangement necessary for substrate promiscuity.
Supplementary Material
Acknowledgments
We thank the Center for Intracellular Delivery of Biologics Bioanalytical Core facility at the University of Washington Department of Medicinal Chemistry and Marcus Collins for many helpful discussions.
This work was supported, in whole or in part, by National Institutes of Health Grant GM862284 (to W. M. A.).

The on-line version of this article (available at http://www.jbc.org) contains supplemental Figs. S1 and S2.
- DSC
- differential scanning calorimetry.
REFERENCES
- 1. Copley S. D. (2003) Curr. Opin. Chem. Biol. 7, 265–272 [DOI] [PubMed] [Google Scholar]
- 2. James L. C., Tawfik D. S. (2003) Trends Biochem. Sci. 28, 361–368 [DOI] [PubMed] [Google Scholar]
- 3. Khersonsky O., Tawfik D. S. (2010) Annu. Rev. Biochem. 79, 471–505 [DOI] [PubMed] [Google Scholar]
- 4. Schreiber G., Keating A. E. (2011) Curr. Opin. Struct. Biol. 21, 50–61 [DOI] [PMC free article] [PubMed] [Google Scholar]
- 5. Nath A., Atkins W. M. (2008) Biochemistry 47, 157–166 [DOI] [PubMed] [Google Scholar]
- 6. Benkovic S. J., Hammes-Schiffer S. (2003) Science 301, 1196–1202 [DOI] [PubMed] [Google Scholar]
- 7. Keskin O. (2007) BMC Struct. Biol. 7, 31. [DOI] [PMC free article] [PubMed] [Google Scholar]
- 8. Zimmermann J., Oakman E. L., Thorpe I. F., Shi X., Abbyad P., Brooks C. L., 3rd, Boxer S. G., Romesberg F. E. (2006) Proc. Natl. Acad. Sci. U.S.A. 103, 13722–13727 [DOI] [PMC free article] [PubMed] [Google Scholar]
- 9. James L. C., Roversi P., Tawfik D. S. (2003) Science 299, 1362–1367 [DOI] [PubMed] [Google Scholar]
- 10. Sethi D. K., Agarwal A., Manivel V., Rao K. V., Salunke D. M. (2006) Immunity 24, 429–438 [DOI] [PubMed] [Google Scholar]
- 11. Patil A., Kinoshita K., Nakamura H. (2010) Int. J. Mol. Sci. 11, 1930–1943 [DOI] [PMC free article] [PubMed] [Google Scholar]
- 12. Hou L., Honaker M. T., Shireman L. M., Balogh L. M., Roberts A. G., Ng K. C., Nath A., Atkins W. M. (2007) J. Biol. Chem. 282, 23264–23274 [DOI] [PubMed] [Google Scholar]
- 13. Ekroos M., Sjögren T. (2006) Proc. Natl. Acad. Sci. U.S.A. 103, 13682–13687 [DOI] [PMC free article] [PubMed] [Google Scholar]
- 14. Ekins S. (2004) Drug Discov. Today 9, 276–285 [DOI] [PubMed] [Google Scholar]
- 15. Foti R. S., Honaker M., Nath A., Pearson J. T., Buttrick B., Isoherranen N., Atkins W. M. (2011) Biochemistry 50, 2387–2393 [DOI] [PMC free article] [PubMed] [Google Scholar]
- 16. Mannervik B., Runarsdottir A., Kurtovic S. (2009) Biochem. Soc. Trans. 37, 740–744 [DOI] [PubMed] [Google Scholar]
- 17. O'Brien P. J., Herschlag D. (1999) Chem. Biol. 6, R91–R105 [DOI] [PubMed] [Google Scholar]
- 18. Griswold K. E., Aiyappan N. S., Iverson B. L., Georgiou G. (2006) J. Mol. Biol. 364, 400–410 [DOI] [PMC free article] [PubMed] [Google Scholar]
- 19. Tokuriki N., Tawfik D. S. (2009) Science 324, 203–207 [DOI] [PubMed] [Google Scholar]
- 20. James L. C., Tawfik D. S. (2001) Protein Sci. 10, 2600–2607 [DOI] [PMC free article] [PubMed] [Google Scholar]
- 21. Anzenbacher P., Hudecek J. (2001) J. Inorg. Biochem. 87, 209–213 [DOI] [PubMed] [Google Scholar]
- 22. Meier S., Ozbek S. (2007) Bioessays 29, 1095–1104 [DOI] [PubMed] [Google Scholar]
- 23. Hayes J. D., Flanagan J. U., Jowsey I. R. (2005) Annu. Rev. Pharmacol. Toxicol. 45, 51–88 [DOI] [PubMed] [Google Scholar]
- 24. Seidegård J., Ekström G. (1997) Environ. Health Perspect. 105, 791–799 [DOI] [PMC free article] [PubMed] [Google Scholar]
- 25. Zhang Y., Kolm R. H., Mannervik B., Talalay P. (1995) Biochem. Biophys. Res. Commun. 206, 748–755 [DOI] [PubMed] [Google Scholar]
- 26. Dietze E. C., Grillo M. P., Kalhorn T., Nieslanik B. S., Jochheim C. M., Atkins W. M. (1998) Biochemistry 37, 14948–14957 [DOI] [PubMed] [Google Scholar]
- 27. Meyer D. J., Kramer H., Ketterer B. (1994) FEBS Lett. 351, 427–428 [DOI] [PubMed] [Google Scholar]
- 28. Nieslanik B. S., Atkins W. M. (2000) J. Biol. Chem. 275, 17447–17451 [DOI] [PubMed] [Google Scholar]
- 29. Kuhnert D. C., Sayed Y., Mosebi S., Sayed M., Sewell T., Dirr H. W. (2005) J. Mol. Biol. 349, 825–838 [DOI] [PubMed] [Google Scholar]
- 30. Nieslanik B. S., Ibarra C., Atkins W. M. (2001) Biochemistry 40, 3536–3543 [DOI] [PMC free article] [PubMed] [Google Scholar]
- 31. Bruns C. M., Hubatsch I., Ridderström M., Mannervik B., Tainer J. A. (1999) J. Mol. Biol. 288, 427–439 [DOI] [PubMed] [Google Scholar]
- 32. Hubatsch I., Ridderström M., Mannervik B. (1998) Biochem. J. 330, 175–179 [DOI] [PMC free article] [PubMed] [Google Scholar]
- 33. Blikstad C., Shokeer A., Kurtovic S., Mannervik B. (2008) Biochim. Biophys. Acta 1780, 1458–1463 [DOI] [PubMed] [Google Scholar]
- 34. Nilsson L. O., Gustafsson A., Mannervik B. (2000) Proc. Natl. Acad. Sci. U.S.A. 97, 9408–9412 [DOI] [PMC free article] [PubMed] [Google Scholar]
- 35. Muñoz V., Sanchez-Ruiz J. M. (2004) Proc. Natl. Acad. Sci. U.S.A. 101, 17646–17651 [DOI] [PMC free article] [PubMed] [Google Scholar]
- 36. Naganathan A. N., Sanchez-Ruiz J. M., Muñoz V. (2005) J. Am. Chem. Soc 127, 17970–17971 [DOI] [PubMed] [Google Scholar]
- 37. Ibarra C., Nieslanik B. S., Atkins W. M. (2001) Biochemistry 40, 10614–10624 [DOI] [PMC free article] [PubMed] [Google Scholar]
- 38. Nieslanik B. S., Dabrowski M. J., Lyon R. P., Atkins W. M. (1999) Biochemistry 38, 6971–6980 [DOI] [PubMed] [Google Scholar]
- 39. Dietze E. C., Wang R. W., Lu A. Y., Atkins W. M. (1996) Biochemistry 35, 6745–6753 [DOI] [PubMed] [Google Scholar]
- 40. Habig W. H., Pabst M. J., Jakoby W. B. (1974) J. Biol. Chem. 249, 7130–7139 [PubMed] [Google Scholar]
- 41. Balogh L. M., Roberts A. G., Shireman L. M., Greene R. J., Atkins W. M. (2008) J. Biol. Chem. 283, 16702–16710 [DOI] [PMC free article] [PubMed] [Google Scholar]
- 42. Wallace L. A., Burke J., Dirr H. W. (2000) Biochim. Biophys. Acta 1478, 325–332 [DOI] [PubMed] [Google Scholar]
- 43. Thórólfsson M., Ibarra-Molero B., Fojan P., Petersen S. B., Sanchez-Ruiz J. M., Martínez A. (2002) Biochemistry 41, 7573–7585 [DOI] [PubMed] [Google Scholar]
- 44. Balchin D., Fanucchi S., Achilonu I., Adamson R. J., Burke J., Fernandes M., Gildenhuys S., Dirr H. W. (2010) Biochim. Biophys. Acta 1804, 2228–2233 [DOI] [PubMed] [Google Scholar]
- 45. Adman E. T., Le Trong I., Stenkamp R. E., Nieslanik B. S., Dietze E. C., Tai G., Ibarra C., Atkins W. M. (2001) Proteins 42, 192–200 [DOI] [PubMed] [Google Scholar]
- 46. Cameron A. D., Sinning I., L'Hermite G., Olin B., Board P. G., Mannervik B., Jones T. A. (1995) Structure 3, 717–727 [DOI] [PubMed] [Google Scholar]
- 47. Zhan Y., Rule G. S. (2004) Biochemistry 43, 7244–7254 [DOI] [PubMed] [Google Scholar]
- 48. Dirr H. W., Little T., Kuhnert D. C., Sayed Y. (2005) J. Biol. Chem. 280, 19480–19487 [DOI] [PubMed] [Google Scholar]
- 49. Freire E. (1995) Methods Mol. Biol. 40, 191–218 [DOI] [PubMed] [Google Scholar]
- 50. Grahn E., Novotny M., Jakobsson E., Gustafsson A., Grehn L., Olin B., Madsen D., Wahlberg M., Mannervik B., Kleywegt G. J. (2006) Acta Crystallogr. D Biol. Crystallogr. 62, 197–207 [DOI] [PubMed] [Google Scholar]
- 51. Dirr H., Reinemer P., Huber R. (1994) Eur. J. Biochem. 220, 645–661 [DOI] [PubMed] [Google Scholar]
- 52. DeLano W. L. (2010) The PyMOL Molecular Graphics System, version 1.3r1, Schrödinger, LLC, New York [Google Scholar]
Associated Data
This section collects any data citations, data availability statements, or supplementary materials included in this article.