

Abstract
In complex organisms, different tissues express different genes, which ultimately shape the function and phenotype of each tissue. An important goal of modern biology is to understand how some genes are turned on and off in specific tissues and how the numbers of different gene expression products are determined. These aspects are named ‘expression breadth’ (or ‘tissue specificity’) and ‘expression level’, respectively. Here, we show that we can predict substantial amount of variation in levels and breadths of gene expression using genomic information of each gene. Interestingly, many genomic traits are correlated with both aspects of gene expression in similar directions, suggesting shared molecular pathways. However, to elucidate distinctive molecular mechanisms governing gene expression levels and breadths, we need to identify the relative significance of each genomic trait on these two aspects of gene expression. To this end, we developed a novel multivariate multiple regression method. Using this new method, we show that gene compactness (in particular, the mean size of exons), codon usage bias and non-synonymous rates have a stronger influence on expression levels compared with their effects on expression breadths. In contrast, the propensity of promoter DNA methylation is a stronger indicator of expression breadths than of expression levels. Interestingly, intron DNA methylation exhibits an opposite pattern to the promoter DNA methylation in the human genome, suggesting that DNA methylation may play multiple roles depending upon its genomic targets. Furthermore, synonymous rates have stronger associations with expression breadths than with expression levels in the human genome. These findings provide clues toward distinctive molecular mechanisms regulating different aspects of gene expression.
INTRODUCTION
Gene expression is of critical importance to many fundamental biological processes, including species divergence (1), protein evolution (2) and adaptation to microenvironment (3). In multicellular organisms, complexity of gene expression is often summarized by two measures: first, how many transcripts are generated per locus (referred to as ‘gene expression level’) and second, how broadly each transcript is found in different tissues (referred to as ‘gene expression breadth’). Together, levels and breadths of gene expression shape the diversity of organismal transcriptomes and eventually facilitate the development and the maintenance of complex biological systems.
What factors determine the levels and breadths of gene expression? While the importance of locus-specific motifs in the regulation of gene expression is highly recognized, it is becoming clear that some features of gene sequences themselves (referred to as ‘genomic traits’ henceforth) are associated with the levels and breadths of gene expression. For example, the relationship between gene compactness and gene expression has been explored by several groups (4–6). Some studies proposed positive correlations between G+C contents and expression levels and breadths (7). Gene expression is also correlated with evolutionary rates. Highly expressed genes are associated with slower evolutionary rates in yeast and mammals (2,8–10). Evolutionary rates are also negatively associated with gene expression breadths (11–13).
However, it is important to take into account the fact that many of the genomic traits discussed above are correlated with each other. For example, G+C contents are correlated with several other genomic features in some taxa (14). The observed correlations between G+C contents and the measures of gene expression could have been confounded by the relations between G+C contents and other genomic traits such as gene compactness. One of the goals of this work is to generate a statistical framework in which we can jointly evaluate the effect of each genomic trait while controlling for the effects of other, often highly correlated, genomic traits.
Another complicating issue is the fact that the expression level and the expression breath are highly correlated with each other (discussed subsequently). This makes it especially difficult to test whether a specific genomic trait influences one aspect of gene expression more strongly than the other. In this paper, we overcome this difficulty by developing a method to utilize this correlation. We provide a novel statistical technique to quantitatively compare an individual genomic trait's influence on the gene expression level with that on the gene expression breadth (see Materials and Methods for more details).
Using this new approach, we identify which genomic traits are significant determinants of gene expression levels and breadths. Our statistical models, using information on genomic traits alone, can predict substantial amount of variation found in the levels and breadths of gene expression in the human and mouse genomes. Furthermore, we identify genomic traits that are more strongly associated with one aspect of gene expression than with the other. We also show that some genomic features exhibit species-specific patterns of associations with gene expression traits. Our study provides valuable insights into the molecular mechanisms underlying the regulation of gene expression. In addition, our method is highly applicable to many other questions in biology, to disentangle effects of different factors on biologically correlated traits.
RESULTS
Strong correlations between expression levels and breadths
We chose to analyze the Novartis Gene Atlas expression data from human and mouse transcriptomes (15) because these data represent comprehensive information on genome-wide gene expression from the largest number of tissues currently available. Importantly, because they are obtained from human and mouse in a similar manner, we can compare results from these two taxa and infer potentially lineage-specific biological differences.
We will refer to the number of tissues in which a gene is expressed as the ‘expression breadth’. The expression levels of each gene averaged over all tissues are referred to as the ‘expression level’. In both human and mouse, expression breadths are extremely strongly correlated with expression levels [Pearson's correlation r =0.81 and 0.82 for human and mouse, respectively, P< 2.2 × 10⁻¹⁶ for both comparisons (16,17)]. An alternative measure of tissue specific patterns of gene expression is the ‘tissue specificity index’ (18), which incorporates information on the maximum expression level in different tissues (see Materials and Methods). The tissue specificity index, while negatively correlated with the expression breadth (Pearson's correlation r=−0.39 and −0.40, for human and mouse, P< 2.2 × 10⁻¹⁶ for both comparisons), behaves differently from the expression breadth: for example, the tissue specificity index exhibits low correlation with the expression level (r= −0.03, P= 0.003 and r= −0.13, P< 2.2 × 10⁻¹⁶ for human and mouse, respectively). However, it is strongly correlated with the maximum expression level of a gene among the tissues examined (r= 0.53 and 0.61 for human and mouse, respectively, P< 2.2 × 10⁻¹⁶ for both comparisons). In Supplementary Material, Table S1, we provide results of the same analyses using the tissue specificity index and the maximum level of gene expression. The major findings are highly similar to those presented in the main text.
Relationship between genomic factors and expression traits: construction of multivariate multiple regression models
To infer the underlying molecular mechanisms governing gene expression levels and gene expression breadths, we constructed multivariate multiple regression models in which levels and breadths of gene expression constituted response variables and genomic traits constituted independent variables. We further considered multi-collinearity by examining variance inflation factors (VIFs). By removing variables exhibiting high multi-collinearity, we can assess individual contributions of each genomic trait (19) (see Materials and Methods).
We initially considered the following seven measures of gene compactness: the number of exons (‘exon number’), lengths of coding exons and introns (‘CDS length’ and ‘intron length’), lengths of untranslated regions (UTRs) (‘5′-UTR’ and ‘3′-UTR’) and mean sizes of exons and introns (‘exon size’ and ‘intron size’). Most of these variables exhibit highly significant negative correlations with expression levels (Table 1). They also tend to be negatively correlated with expression breadths (Table 1). In order to avoid a multi-collinearity problem, we excluded exon number and CDS length from the multivariate model because they exhibited large VIF with exon size. Intron size is also excluded from the multivariate model because it exhibits high VIF with intron length.
Table 1.
Correlations between genomic traits and expression traits
| Human |
Mouse |
|||||||
|---|---|---|---|---|---|---|---|---|
| Expression level | Expression breadth | Expression level | Expression breadth | |||||
| Correlationa | P-valueb | Correlationa | P-valueb | Correlationa | P-valueb | Correlationa | P-valueb | |
| Exon number | −4.9 | ** | 1.6 | NS | −0.7 | NS | 4.2 | ** |
| CDS length | −18.2 | **** | −6.3 | *** | −12.1 | **** | −3.6 | * |
| 5′-UTR | −3.8 | ** | 0.2 | NS | −2.9 | * | 0.4 | NS |
| 3′-UTR | −6.3 | *** | 3.5 | ** | 4.2 | ** | 8.6 | *** |
| Intron length | −13.4 | **** | −2.1 | * | −7.6 | ** | −2.7 | * |
| Exon size | −19.2 | **** | −11.3 | **** | −17.7 | **** | −11.9 | **** |
| Intron size | −13.7 | **** | −4.0 | ** | −8.7 | *** | −6.1 | ** |
| GC3 | 3.7 | ** | −2.2 | * | 5.5 | ** | 5.0 | ** |
| GCi | 5.5 | ** | −1.9 | NS | 4.8 | ** | 6.0 | ** |
| GCp | 5.3 | ** | 6.4 | *** | 9.6 | *** | 12.2 | **** |
| CAI | 6.8 | *** | −1.0 | NS | 7.6 | ** | 4.2 | ** |
| CpGO/E promoter | 11.5 | **** | 18.0 | *, **** | 20.2 | **** | 27.3 | **** |
| CpGO/E intron | 14.9 | **** | 7.5 | *** | 5.8 | ** | 4.7 | ** |
| dN | −16.3 | **** | −15.8 | **** | −26.1 | **** | −26.1 | **** |
| dS | −3.7 | * | −8.8 | *** | −3.5 | * | −5.5 | ** |
| dN/dS | −16.7 | **** | −12.7 | **** | −25.5 | **** | −23.9 | **** |
| dI | −0.6 | NS | −4.3 | ** | 3.1 | * | 2.8 | NS |
Each variable has been transformed to improve normality. Pearson's correlation coefficients and P-values are shown.
aCorrelation coefficients (×100).bNS, P> 0.05.
*10−3< P≤ 0.05.
**10−8< P≤ 10−3.
***10−15< P≤ 10−8.
****P≤ 10−15.
Recently, it has been shown that gene compactness measures have non-linear associations with expression levels (20), which is also the pattern we observe (Fig. 1). Therefore, we examined whether the inclusion of polynomial terms better fits our data, using the Akaike information criterion (AIC) [(21), see Materials and Methods]. We found that including quadratic terms of the UTR length in our model produced better fits to the data (see Materials and Methods). The quadratic terms of UTRs also exhibited low VIF with other variables. Thus, the quadratic terms of UTRs are included in the multivariate multiple regression models.
Figure 1.

Relationship between gene compactness traits and expression levels. (A–D) Human genes are divided into eight bins according to their mean expression levels. Expression levels increase with the X-axis. The relationships between expression levels and (A) lengths of 5′-UTRs, (B) lengths of 3′-UTRs, (C) exon size and (D) lengths of introns are shown. In the lower panel, the relationships between expression levels of mouse genes and (E) lengths of 5′-UTRs, (F) lengths of 3′-UTRs, (G) exon size and (H) lengths of introns are shown.
We consider three G+C content variables: G+C content of the third codon positions (‘GC3’), intron G+C contents (‘GCi’) and promoter G+C contents (‘GCp’). Even though these variables are correlated with each other (data not shown), none of these variables has VIFs greater than 10 (19), allowing themselves to be included in our model as independent variables. We include the codon adaptation index (CAI) (22) to account for the effect of codon usage bias. CAI is positively correlated with expression levels, whereas weakly or not significantly related to expression breadths (Table 1).
We also include two factors related to the levels of DNA methylation. The first is the normalized CpG content of promoters (‘CpGO/E promoter’). Because DNA methylation targets CpG dinucleotides and depletes them, CpGO/E is an indicator of DNA methylation on an evolutionary time scale (23). It is shown to correspond well to the actual level of DNA methylation in the human genome (24). In particular, CpGO/E of promoters has been implicated with gene expression breaths (25). In addition to CpGO/E of promoters, we included CpGO/E of introns (‘CpGO/E intron’) as a measure of DNA methylation in transcription units [also referred to as ‘gene bodies’, e.g. (26)]. Briefly, methylation of DNA in gene bodies is considered as the ancestral pattern in animal genomes and may be implicated in different functions than promoter methylation (26–28). Thus, we investigated effects of CpGO/E promoter and CpGO/E intron on levels and breadths of gene expression separately. Both of these traits are significantly positively correlated with both expression traits (Table 1).
We also investigated the relationship between evolutionary rates of protein sequences and measures of gene expression. To evaluate potentially lineage-specific patterns, we obtained evolutionary rates separately from primates and rodents. Specifically, we used human–macaque and mouse–rat comparisons to estimate primate- and rodent-specific evolutionary rates, respectively. The rates of non-synonymous substitution (dN) are strongly negatively correlated with both aspects of gene expression (Table 1). A similar pattern is observed for the rates of synonymous substitution (dS). Interestingly, the correlation coefficients (and significance) between dS and expression breadths are greater than those between dS and expression levels. dN/dS and dI are removed from the multivariate models due to large VIFs with other evolutionary rate variables. Visual inspection of the relationship between expression traits and genomic factors is agreed with the direction and the strength of correlations (Figs 1 and 2 and Supplementary Material, Figs S1–S4).
Figure 2.

Relationship between gene compactness traits and expression breadths. (A–D) Human genes are divided into eight bins according to their mean expression breadths. Expression levels increase with the X-axis. The relationships between expression levels and (A) lengths of 5′-UTRs, (B) lengths of 3′-UTRs, (C) exon size and (D) lengths of introns are shown. In the lower panel, the relationships between expression levels of mouse genes and (E) lengths of 5′-UTRs, (F) lengths of 3′-UTRs, (G) exon size and (H) lengths of introns are shown.
Multivariate models reveal relative effects of genomic traits on gene expression
In our multivariate multiple regression models, levels and breadths of expression together constitute dependent variables. These are then explained by combined effects of different genomic traits, which are included as independent variables in the models. Tables 2 and 3 list the coefficients of the multivariate regression models obtained from the data of human and mouse, respectively. Statistical significance of each predictor is assessed by the Bonferroni multiplicity correction to account for the effect of multiple testing.
Table 2.
Regression coefficients in multiple regression models of human expression data
| Predictors | Expression level |
Expression breadth |
Ratio of coefficients (95% CI)a | ||
|---|---|---|---|---|---|
| Coefficient | Significance | Coefficient | Significance | ||
| Gene compactness variables | |||||
| 5′-UTR | 0.14 | NS | 0.09 | NS | 1.58 (0.81, 3.08) |
| 5′-UTR (quadratic term) | −0.18 | <10−3 | −0.11 | NS | 1.72 (0.98, 3.04) |
| 3′-UTR | −0.07 | <10−8 | 0.01 | NS | — |
| 3′-UTR (quadratic term) | −0.06 | <10−7 | −0.06 | <10−6 | 1.07 (0.85, 1.34) |
| Exon size | −0.19 | <10−58 | −0.11 | <10−20 | 1.70 (1.49, 1.93)* |
| Intron length | −0.15 | <10−27 | −0.09 | <10−8 | 1.82 (1.47, 2.24)* |
| Codon usage bias variable | |||||
| CAI | 0.22 | <10−18 | 0.10 | <10−3 | 2.29 (1.61, 3.27)* |
| G+C content variables | |||||
| GC3 | −0.08 | NS | −0.04 | NS | — |
| GCp | −0.04 | NS | −0.03 | NS | — |
| GCi | −0.11 | <10−4 | −0.02 | NS | 5.49 (0.59, 50.86) |
| DNA methylation-related variables | |||||
| CpGO/E promoter | 0.11 | <10−13 | 0.18 | <10−31 | 0.63 (0.54, 0.73)* |
| CpGO/E intron | 0.10 | <10−12 | 0.02 | NS | 5.38 (1.53, 18.96)* |
| Evolutionary rate variables | |||||
| dN | −0.12 | <10−24 | −0.10 | <10−13 | 1.32 (1.13, 1.53)* |
| dS | −0.04 | NS | −0.06 | <10−4 | 0.63 (0.40, 0.99)* |
| R2 (adjusted R2) | 0.12 (0.12) | 0.07 (0.07) | |||
aEstimated for variables that are significant for at least one expression trait and not zero.
*Ratios significantly different from 1.
Table 3.
Regression coefficients and their significance in multiple regression models of mouse expression data
| Predictors | Expression level |
Expression breadth |
Ratio of coefficients (95% CI)a | ||
|---|---|---|---|---|---|
| Coefficient | Significance | Coefficient | Significance | ||
| Gene compactness variables | |||||
| 5′-UTR | −0.07 | <10−5 | −0.03 | NS | 2.29 (1.16, 4.54)* |
| 5′-UTR (quadratic term) | 0.03 | NS | 0.03 | NS | — |
| 3′-UTR | 0.02 | NS | 0.05 | 0.002 | 0.49 (0.20, 1.20) |
| 3′-UTR (quadratic term) | −0.08 | <10−6 | −0.06 | <10−4 | 1.31 (0.97, 1.77) |
| Exon size | −0.14 | <10−20 | −0.08 | <10−7 | 1.75 (1.34, 2.08)* |
| Intron length | −0.11 | <10−11 | −0.06 | <10−3 | 1.97 (1.36, 2.84)* |
| Codon usage bias variable | |||||
| CAI | 0.15 | <10−8 | 0.06 | NS | 2.45 (1.35, 4.46)* |
| G+C content variables | |||||
| GC3 | −0.10 | <10−3 | −0.06 | NS | 1.78 (0.93, 3.42) |
| GCp | −0.05 | NS | −0.09 | <10−6 | 0.55 (0.34, 0.88)* |
| GCi | −0.00 | NS | 0.10 | <10−4 | — |
| DNA methylation-related variables | |||||
| CpGO/E promoter | 0.20 | <10−24 | 0.29 | <10−51 | 0.68 (0.61, 0.77)* |
| CpGO/E intron | 0.03 | NS | 0.00 | NS | — |
| Evolutionary rate variables | |||||
| dN | −0.21 | <10−34 | −0.17 | <10−24 | 1.19 (1.06, 1.33)* |
| dS | 0.02 | NS | −0.01 | NS | — |
| R2 (adjusted R2) | 0.14 (0.13) | 0.14 (0.14) | |||
aEstimated for variables that are significant for at least one expression trait and not zero.
*Ratios significantly different from 1.
Our multivariate models explain between 7 and 14% of total variation in levels and breadths of gene expression (Tables 2 and 3). Thus, using information from genomic sequence data alone, we can explain substantial amounts of variation observed in gene expression levels and breadths. Note that because the expression breadth and the expression level are so strongly correlated with each other, if we were given information on either of those two variables, we can predict the other variable with high confidence. For example, if we were to generate a multiple linear regression model to explain the variation in the expression breadth and to include the expression level as an explanatory variable, the resulting model has an extremely high R2 value of 0.72. However, our goal here is to evaluate the effects of information we can gather from sequence data alone and to model variability in expression levels and breadths separately.
Because we model the expression level and the expression breadth simultaneously as response variables, our method has a novel advantage over other models that employ a single response variable. Specifically, we can estimate relative effects of independent variables (different genomic traits) on each dependent variable (the expression level or the expression breadth). In particular, because we have standardized each dependent variable (mean 0 and variance 1), we can directly compare the coefficients of each genomic factor on expression levels and breadths. Thus, the ratio of coefficients represents the ‘relative’ effect size of each genomic trait on the two distinctive aspects of gene expression. We then derived the 95% confidence interval (CI) of the ratio for each independent variable from the variance and covariance matrices of the two regression coefficients (see Materials and Methods). These CIs provide information on whether a genomic trait influences the gene expression level and the gene expression breadth significantly differently. These ratios and their 95% CIs are also presented in Tables 2 and 3.
For example, in Table 2, we show that the regression coefficient of the exon size for the expression level is greater than the regression coefficient of the exon size for the expression breadth. The ratio of these regression coefficients is 1.7 (estimated by 0.19/0.11 = 1.7). Ninety-five per cent CI does not include 1, indicating that the exon size has significantly stronger effect on the expression level than on the expression breath. In the mouse data (Table 3), this ratio is 1.75, highly similar to the value in the human data. In other words, in both species, the exon size has approximately 1.7 times stronger relations with the gene expression level than with the gene expression breadth. We observe a highly similar pattern for the intron length. From the ratios of coefficients (Tables 2 and 3), we can conclude that the intron length has approximately 1.8–2.0 times stronger relations with the gene expression level than with the gene expression breadth.
UTR lengths have weak relations when viewed in the context of all other genomic traits, although the quadratic term of 3′-UTR length is significantly negatively associated with both expression traits. This is in accord with the observation that the relationships between 3′-UTR lengths and gene expression levels (Fig. 1) and breadths (Fig. 2) appear non-linear in both species.
The measure of codon usage bias, CAI, is a significant predictor of expression levels for both species. However, its influence on expression breadths is much weaker than that on expression levels in both comparisons. This can be quantified using the ratios of coefficients. In the human data, the level/breadth ratio is 2.29, which is significantly greater than 1 (Table 2). In other words, the effect of CAI on expression level is approximately 2-fold greater than its effect on expression breadth. In the mouse data, this ratio is 2.45, highly similar to that from the human data (Table 3).
G+C contents of genes and other regions have been previously considered as a potential predictor of patterns of gene expression (7). However, our analyses show that the effects of G+C contents on expression traits are relatively weak compared with those of other genomic features (Tables 2 and 3). Interestingly, intron G+C contents (‘GCi’) and promoter G+C contents (‘GCp’) have a stronger influence on the expression breadth in the mouse data, but stronger on the expression level in the human data.
By far, the most significant contributor to expression breadths in both species is the CpGO/E of promoters. Even though the CpGO/E of promoter is also a major predictor of the expression level, its effect size is much greater for the expression breadth than for the expression level. The level/breadth ratio is 0.6 and 0.7 for the human and mouse data, respectively. Interestingly, CpGO/E of intron, however, has a stronger influence on expression levels than on breadths, even though this predictor is significant only in the human data.
In terms of evolutionary rates, the relationship between non-synonymous rates and expression levels is highly negative in both species. According to our analyses, the effect size of non-synonymous rates on expression levels is slightly greater than that on expression breadths. The level/breadth ratios of coefficients are 1.32 and 1.19 for the human and mouse data, respectively. Interestingly, synonymous rates exhibit a stronger relationship with expression breadths than with levels in human data (Table 2). This relationship appears to be lineage-specific; in the mouse data, there was no significant relationship between synonymous rates and expression breadths (Table 3).
Figure 3 summarizes genomic traits that exhibit significantly different effects on the two expression traits. In other words, the ratios of coefficients are significantly different from 1 for these genomic traits (CIs of the ratios are also presented). For both species, seven genomic traits exhibit significantly different effects on the expression traits. Among these, five genomic traits are common in both species. While exon size, intron length, CAI and dN are stronger determinants of expression levels, CpGO/E of promoter is a better indicator of expression breadths.
Figure 3.

Genomic traits that affect one aspect of gene expression more strongly than the other in (A) human and (B) mouse. The Y-axis intersects with statistically identical ratios of coefficients for levels and breadths of gene expression. The X-axis represents the ratios of regression coefficients on expression levels divided by that on expression breadths. CIs are also shown. Genomic traits on the left side of the panel are those that have significantly stronger effect on gene expression levels than on gene expression breadths. Traits on the right side of the panel are stronger predictors of gene expression breadths than of levels. Traits that are common in human and mouse are shown in dark grey, and those that show different significance are shown in light grey.
Modeling gene expression levels using RNA-seq data
Inference of gene expression derived from the microarrays versus RNA-seq experiments can be different (29). Thus, we analyzed two RNA-seq data sets and compared the results with those from the microarray data. We used two RNA-seq data sets: GSE12946 (30) and GSE13652 (31). We processed the raw data and mapped back to coding exons and generated reads per kilobase of exon model per million mapped reads [RPKM, (32)] values per each locus (see Materials and Methods). The RPKM values are analogous to the gene expression level (32).
The RPKM values generated from RNA-seq experiments are highly positively correlated with the measure of gene expression level we used, derived from microarrays (Pearson's r= 0.44 and 0.45 for GSE13652 and GSE12946, respectively, P< 10−16 for both), as shown previously (32–34). We first examined the correlations between different genomic traits and RPKM values. The results are shown in Supplementary Material, Table S2. The relations between different genomic traits and the RPKM values are quite similar to what we have observed using the microarray data. In fact, most of the correlation coefficients themselves are highly similar to those presented in Table 1, indicating that both the microarray data and RPKM data exhibit similar relations to the gene expression levels.
However, important exceptions to this similarity occur for G+C content variables. Most G+C content variables show much stronger correlations with the RPKM values than are with the expression levels estimated from the microarray data. For example, the correlation coefficient between GC3 and expression level increases from 0.037 in microarray data (Table 1) to 0.177 in RPKM data (Supplementary Material, Table S2). This observation is in line with recent studies, indicating that RNA-seq experiments tend to amplify sequences biased toward high G+C contents (35,36). In addition, both dS and dI are positively correlated with the RPKM values (Supplementary Material, Table S2), which is likely to be caused by the positive correlation between G+C contents and dS and dI (37–40). The bias toward G+C-rich sequences is also seen in the results of the multiple linear regression models (Supplementary Material, Table S3). The relations between dS and RPKM, however, disappear after controlling for G+C contents by the multiple linear regression method (Supplementary Material, Table S3). Models using the microarray data or the RPKM data identify the same genomic traits as significant determinants of gene expression levels, except for the effect of GCi variable, which is likely to be caused by the known bias in the RNA-seq data. Developing efficient means to detect and correct for inherent biases in RNA-seq data is a topic of intense current interest (36,41).
DISCUSSION
In this paper, we have demonstrated the use of a novel multivariate multiple linear regression method, to determine relative contributions of various genomic traits explaining different aspects of gene expression. This method can be used in answering many other biological questions where we need to evaluate relative roles of different factors on multiple, related variables. Our results reveal that some genomic traits are significant predictors of both levels and breadths of gene expression, whereas others only affect one aspect of gene expression (Tables 2 and 3). For most genomic traits, the statistical significance was highly similar in the human and mouse data.
When we examine the ratios of regression coefficients across different predictors, an interesting pattern emerges. In most cases, these ratios are greater than 1. In other words, for each genomic trait, the absolute value of the regression coefficient tends to be greater for the expression level than for the expression breadth. This indicates that most genomic traits have stronger relations with expression levels than with expression breadths (however see below for important exceptions). Secondly, in all significant predictors, the signs of coefficients are the same for both levels and breadths of gene expression. In other words, all genomic traits considered here influence expression levels and breadths in similar directions, perhaps due to shared molecular pathways.
Strong effects of exon size on expression traits
We observe a generally non-linear relationship between gene compactness measures and gene expression levels (Fig. 1), as reported previously (20,42). Carmel and Koonin (20) examined the relationship between levels of gene expression and gene compactness measures and concluded that this relationship is ‘universally non-monotonic’, where genes with intermediate expression levels tended to be the least compact in four distantly related species (human, Drosophila melanogaster, Arabidopsis thaliana and Caenorhabditis elegans). Our results are qualitatively similar, although we show that even between humans and mice, subtle differences exist (Fig. 1). Indeed, our multivariate analyses show that quadratic terms of UTR lengths may have different statistical significance between human and mouse (Tables 2 and 3).
What causes such non-linear relationships between gene compactness variables and gene expression measures? It is hypothesized that highly expressed genes may experience strong selective forces toward gene compactness, due to the energetic costs associated with transcription processes (4,5). In contrast, genes that exhibit intermediate levels of expression breadths may require the most complex signals for regulation and become the longest (42). The observed non-linear trend could be explained by a combination of both selective forces toward efficient cellular processes and the need for more regulatory sequences necessary for complex gene regulation (20).
Interestingly, our study identifies the exon size as a major determinant of both expression traits. Moreover, the exon size tends to linearly decrease with the increase in the levels and breadths of gene expression [Figs 1 and 2; but see (20)]. Molecular mechanisms causing this relation remain unknown. Some studies suggest that the exon size may influence efficiency of splicing (43). Alternatively, it is proposed that the relationship between the exon size and the expression level simply reflects confounding effects of the relationships between the exon size, the intron density and the propensity of evolutionary conservation (20). The intron density increases with the expression level, which is hypothesized to reflect the fact that evolutionarily conserved genes exhibit bias toward the intron gain and tend to be highly expressed (44). This hypothesis fits the observation that the relationship between the exon size and the expression level is reversed in C. elegans compared with other species because C. elegans exhibits a particularly high rate of intron loss (44). However, our results indicate that the relationship between the exon size and the expression level cannot be completely attributed to the confounding relationships between the exon size, the intron density and the propensity of evolutionary conservation. According to the results of multivariate analyses, the exon size remains as a significant predictor of the expression level even after adjusting for the effects of evolutionary rates (Tables 2 and 3).
Multiple effects of DNA methylation on gene expression
The degree of CpG depletion in promoters (CpGO/E promoter) emerges as a major predictor of both expression traits. It has been observed previously that promoters that are rich in CpG dinucleotides (also often referred to as ‘CpG island promoters’) tend to occur near broadly expressed genes (25,45,46). Here we have demonstrated that CpG island promoter genes also tend to be highly expressed. It is hypothesized that CpG-rich promoters may facilitate broad expression of genes because they provide permissive chromatin states that allow congregation of regulatory machineries, such as transcription factor binding sites (47). In particular, CpG-rich promoters generally avoid DNA methylation, which is a main epigenetic mechanism for transcription repression. High expression of genes harboring CpG-rich promoters may share similar molecular mechanisms. However, it is of great interest that the CpGO/E of promoter has a stronger effect on expression breadths than on expression levels. CpG islands in promoters themselves directly encode Pol2a binding sites and specific transcription start sites (48). We hypothesize that CpG-rich promoters are enriched in regulatory motifs that are used in many different tissues toward efficient expression.
In contrast to CpGO/E of promoters, CpGO/E of introns has a significantly stronger effect on expression levels than on expression breadths in humans (Table 2). This parameter is an indicator of intragenic DNA methylation, which is considered as the ancestral pattern of DNA methylation in animal genomes [see (26,49) and (28,50)]. Recent genomic studies began to illuminate distinctive roles for intragenic DNA methylation in comparison to that of promoter methylation. Intragenic DNA methylation is hypothesized to suppress spurious transcription of highly expressed genes (51,52) and/or to facilitate alternative transcription of genes (28). Our statistical analyses, indeed, indicate that the CpGO/E of promoters and CpGO/E of introns influence different aspects of expression, supporting the idea that promoter DNA methylation and intragenic DNA methylation have different primary roles in the human genome.
Lineage-specific trends
Our results demonstrate that the statistical significance of several key genomic traits on the measures of gene expression varies between primates and rodents. Some of the factors exhibit a strong influence in primates, but have little effect in rodents or vice versa. This indicates that such associations may be weak and indirect, mediated by other unidentified factors. Alternatively, these relationships may reflect true lineage-specific biological aspects.
One interesting species-specific difference is the relationship between gene expression breadths and synonymous evolutionary rates. While non-synonymous evolutionary rates are significantly related to both expression traits, synonymous rates exhibit a lineage-specific pattern. In rodents, expression traits have little relationship with synonymous rates. In comparison, in primates, expression breadths and synonymous rates exhibit significant relations. In fact, in primates, the association between the expression breadth and dS is stronger than that between the expression level and dS (Table 2). In rodents, however, dS is not significantly associated with either expression trait (Table 3).
This may reflect underlying differences in the effective population sizes of primates and rodents. It has been hypothesized that synonymous rates may increase in tissue-specific genes because of reduced selection pressure (12). This effect may be stronger in primates, whose effective population sizes tend to be smaller than those of rodents (53). To test this idea, we examined dS/dI as a measure of selective constraint on synonymous sites. We found that on average dS/dI is greater than 1 in primates [mean dS/dI = 1.38 (SE = 0.04) in human–macaque comparison], but less than 1 in rodents [mean dS/dI = 0.90 (SE = 0.01) in mouse–rat comparison]. This discrepancy is in accord with the increased fixation of slightly deleterious mutations in primates (due to small effective population size), compared with efficient purifying selection on rodents (facilitated by large effective population size) (53,54). Therefore, lineage-specific patterns of molecular evolution may be more prevalent. Consequently, we need to be cautious in the choice of outgroups when inferring patterns of molecular evolution in mammals.
Conclusions and future directions
Our study presents a novel statistical method to analyze effects of different genomic traits on two distinct aspects of gene expression. We identified several key genomic traits whose relative effects on levels and breadths of gene expression are quantified. This information is useful in decoding regulatory principles of transcription.
Although the current study analyzed only levels and spatial distribution of gene expression, our approach provides a flexible statistical tool to evaluate the roles of additional genomic traits on the regulation of gene expression. In particular, with the improved power for dissecting complex transcriptomes, information on temporal variation of gene expression is soon to accumulate (55,56). Moreover, data on genomic traits that may be intimately related to regulation of gene expression, such as epigenetic changes, will soon become available. Our statistical framework can be easily expanded to incorporate additional data.
MATERIALS AND METHODS
Gene expression data
Gene expression data of human and mouse were downloaded from Gene AtlasV2 data set. In this data set, the expression level (signal intensity) is standardized by MAS5.0 algorithm (15). Gene expression levels are available in 79 tissues in human and 61 tissues in mouse. We excluded cancerous tissues from our analyses. Signals representing the same tissue were averaged. A gene is considered expressed in a tissue if the corresponding signal intensity is above 200. The mean value of the expression levels in all tissues is defined as a measure of expression level. Gene expression breadth is defined as the number of tissues in which a gene is expressed.
We also analyzed the ‘tissue specificity index’ as a measure of expression pattern, which is defined as:
where n is the number of tissues analyzed, Ej the expression level of the gene in the jth tissue and Emax the maximum expression level of the gene across the n tissues (13,18). The higher the tissue specificity index of a gene, the more the tissue-specific. The results using this measure are shown in Supplementary Material, Table S1.
Sequence characteristics
We obtained exon number, gene length traits and UTR lengths from the UCSC genome browser. CAI was calculated using EMBOSS tools (http://emboss.sourceforge.net/apps/). Repetitive sequences, annotated using the Repeat Masker program, were removed from the analyses. G+C content and CpGO/E (observed CpG sites number divided by expected CpG sites number) were calculated using custom codes.
CpGO/E is defined as  , where PCpG, Pc and PG are the frequencies of CpG dinucleotides, C nucleotides and G nucleotides, respectively.
To estimate evolutionary rates, we used macaque and rat sequences as outgroups to human and mouse data, respectively. We did this for two reasons: first, by choosing outgroup species that are more closely related, we can estimate evolutionary rates with higher confidence (because we avoid the issue of saturation). Secondly, by estimating evolutionary rates from the primate and rodent pairs separately, we generate estimates of evolutionary rates from primate and rodent lineages. The codeml module of the PAML program (57) was used to estimate non-synonymous and synonymous rates between the primate pair (human–macaque) and the rodent pair (mouse–rat).
Data transformation and standardization
Expression level, exon size, intron length, dN and dS were log-transformed to improve normality. All variables (including dependent and independent variables) were standardized as follows:
where x represents the raw variable. After standardization, the standardized variable, X, has mean zero and variance one.
Multivariate multiple regression
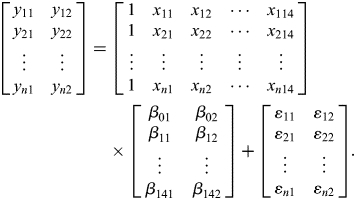
The multivariate multiple regression model is defined as
where Y is a response vector (with n × m variables), which is explained by p predictor variables (X), n the number of sample sizes, m the number of response variables and E(ɛ) = 0. Specifically, in the current analysis, expression levels and breadth are treated as response variables (m = 2), and the genomic factors (sequence-based information and evolutionary information of each gene) are defined as predictor variables (P = 14). n corresponds to the number of genes in our analyses (n = 7827 and 4444 in human and mouse comparisons, respectively). It follows that
 |
The relationship between the response variables and predictor variables can be determined by regression coefficients β, which can be interpreted as the expected change in response variable for a one-unit change in predictor variable when the other covariates are held fixed.
When a large number of predictor variables are included in the regression model, multi-collinearity, which represents the linearity relationship among the predictor variables, may exist. We used the VIFs that are commonly used to diagnose multi-collinearity. High values [greater than 10; (19)] of VIF indicate that the accuracy of the regression coefficient estimates is eroded by collinearity.
Because some variables related to gene compactness (in particular, UTR length terms) exhibit non-linear characteristics against the expression level and expression breadth, we used polynomial regression models. When we examine the AIC (21) and the significance of the high-order terms in the polynomial models, models including the second-order polynomial terms fit the human data better than the models including the first- and third-order polynomials. Specifically, in the human data, the AICs of models including first-, second- and third-order polynomial terms are 34461.8, 34435.6 and 34420.2, respectively. The difference in AICs between models including second- and third-order polynomial terms is much smaller than the decrease of AIC between those including the first- and second-order polynomial terms. Furthermore, the third polynomial predictor itself is not significant in the third model. In the mouse data, AIC of the second-order model is the smallest among the three polynomial models (19642.2, 19641.7 and 19658.3, respectively), and the third polynomial predictor itself is not significant in the third model. Thus we include the quadratic term of UTR lengths as predictor variables in the model.
Ratios of coefficients and CIs
Because we are interested in relative effects of each predictor on the two expression traits, we examined the relative ratios of regression coefficients of each variable on the two response variables, namely β1/β2. The CI of this ratio is highly informative. If the CI does not include 1, it means that the predictor has non-equal effects on the two response variables. The CIs are estimated by deriving the variance of log (β1/β2) using the Delta method (58). Specifically, the CI of β1/β2 is obtained as:
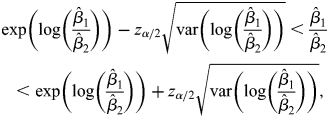 |
where z stands for the z-statistic and α indicates specific significance cutoff values (59).
Curating RNA-seq data
We downloaded human tissue mRNA-seq data from GEO (GSE12946 and GSE13652). We then mapped the raw reads to the human genome hg18. We further curated the data to choose only unique hits and removed hits exhibiting identical 5′ and 3′ ends. We then counted reads that map to the exons of each gene. Reads that fell onto exons were summed up for each gene and normalized by the exon length into the expanded exonic read density (reads per kilobase per million reads: RPKM) (32) using the following formula:
where C is the number of reads that fell onto the gene's exons, N the total number of mappable reads in the experiment and L the sum of the exons in base pairs.
Multiple-comparison correction
We used the Bonferroni correction (60,61) for the multiple-testing problem of our regression analysis.
All statistical analyses were performed using the R package (62) and the SAS software (63).
SUPPLEMENTARY MATERIAL
Supplementary Material is available at HMG online.
Conflict of Interest statement. None declared.
FUNDING
This study was supported by NSF grants (MCB-0950896 and BCS-0751481) to S.V.Y. and by the National Research Foundation grants (M10500000126 and KRF-2008-313-C00086) to T.P. Funding to pay the Open Access publication charges for this article was provided by Georgia Institute of Technology and from the National Research Foundation Grants.
Supplementary Material
ACKNOWLEDGEMENTS
We thank Brendan Hunt for comments on an earlier version of the manuscript.
REFERENCES
- 1.King M.-C., Wilson A.C. Evolution at two levels in humans and chimpanzees. Science. 1975;188:107–116. doi: 10.1126/science.1090005. [DOI] [PubMed] [Google Scholar]
- 2.Drummond D.A., Raval A., Wilke C.O. A single determinant dominates the rate of yeast protein evolution. Mol. Biol. Evol. 2006;23:327–337. doi: 10.1093/molbev/msj038. [DOI] [PubMed] [Google Scholar]
- 3.Lopez-Maury L., Marguerat S., Bahler J. Tuning gene expression to changing environments: from rapid responses to evolutionary adaptation. Nat. Rev. Genet. 2008;9:583–593. doi: 10.1038/nrg2398. [DOI] [PubMed] [Google Scholar]
- 4.Eisenberg E., Levanon E. Human housekeeping genes are compact. Trends Genet. 2003;19:362–365. doi: 10.1016/S0168-9525(03)00140-9. [DOI] [PubMed] [Google Scholar]
- 5.Urrutia A.O., Hurst L.D. The signature of selection mediated by expression on human genes. Genome Res. 2003;13:2260–2264. doi: 10.1101/gr.641103. [DOI] [PMC free article] [PubMed] [Google Scholar]
- 6.Comeron J.M. Selective and mutational patterns associated with gene expression in humans. Genetics. 2004;167:1293–1304. doi: 10.1534/genetics.104.026351. [DOI] [PMC free article] [PubMed] [Google Scholar]
- 7.Konu Ö., Li M.D. Correlations between mRNA expression levels and GC contents of coding and untranslated regions of genes in rodents. J. Mol. Evol. 2002;54:35–41. doi: 10.1007/s00239-001-0015-z. [DOI] [PubMed] [Google Scholar]
- 8.Kim S.-H., Yi S. Correlated asymmetry between sequence and functional divergence of duplicate proteins in Saccharomyces cerevisiae. Mol. Biol. Evol. 2006;23:1068–1075. doi: 10.1093/molbev/msj115. [DOI] [PubMed] [Google Scholar]
- 9.Kim S.-H., Yi S. Understanding relationship between sequence and functional evolution in yeast proteins. Genetica. 2007;131:151–156. doi: 10.1007/s10709-006-9125-2. [DOI] [PubMed] [Google Scholar]
- 10.Subramanian S., Kumar S. Gene expression intensity shapes evolutionary rates of the proteins encoded by the vertebrate genome. Genetics. 2004;168:373–381. doi: 10.1534/genetics.104.028944. [DOI] [PMC free article] [PubMed] [Google Scholar]
- 11.Duret L., Mouchiroud D. Determinants of substitution rates in mammalian genes: expression pattern affects selection intensity but not mutation rate. Mol. Biol. Evol. 2000;17:68–74. doi: 10.1093/oxfordjournals.molbev.a026239. [DOI] [PubMed] [Google Scholar]
- 12.Zhang L., Li W.-H. Mammalian housekeeping genes evolve more slowly than tissue-specific genes. Mol. Biol. Evol. 2004;21:236–239. doi: 10.1093/molbev/msh010. [DOI] [PubMed] [Google Scholar]
- 13.Liao B.-Y., Scott N.M., Zhang J. Impacts of gene essentiality, expression pattern, and gene compactness on the evolutionary rate of mammalian proteins. Mol. Biol. Evol. 2006;23:2072–2080. doi: 10.1093/molbev/msl076. [DOI] [PubMed] [Google Scholar]
- 14.International Human Genome Sequencing Consortium. Initial sequencing and analysis of the human genome. Nature. 2001;409:860–921. doi: 10.1038/35057062. [DOI] [PubMed] [Google Scholar]
- 15.Su A.I., Wiltshire T., Batalov S., Lapp H., Ching K.A., Block D., Zhang J., Soden R., Hayakawa M., Kreiman G., et al. A gene atlas of the mouse and human protein-encoding transcriptomes. Proc. Natl Acad. Sci. USA. 2004;101:6062–6067. doi: 10.1073/pnas.0400782101. [DOI] [PMC free article] [PubMed] [Google Scholar]
- 16.Vinogradov A.E. Dualism of gene GC content and CpG pattern in regard to expression in the human genome: magnitude versus breadth. Trends Genet. 2005;21:639–643. doi: 10.1016/j.tig.2005.09.002. [DOI] [PubMed] [Google Scholar]
- 17.Park S., Choi S. Expression breadth and expression abundance behave differently in correlations with evolutionary rates. BMC Evol. Biol. 2010;10:241. doi: 10.1186/1471-2148-10-241. [DOI] [PMC free article] [PubMed] [Google Scholar]
- 18.Yanai I., Benjamin H., Shmoish M., Chalifa-Caspi V., Shklar M., Ophir R., Bar-Even A., Horn-Saban S., Safran M., Domany E., et al. Genome-wide midrange transcription profiles reveal expression level relationships in human tissue specification. Bioinformatics. 2005;21:650–659. doi: 10.1093/bioinformatics/bti042. [DOI] [PubMed] [Google Scholar]
- 19.Montgomery D.C., Peck E.A., Vining G.G. Introduction to Linear Regression Analysis. 4th edn. Hoboken, NJ: John Wiley and Sons, Inc.; 2006. [Google Scholar]
- 20.Carmel L., Koonin E.V. A universal nonmonotonic relationship between gene compactness and expression levels in multicellular eukaryotes. Genome Biol. Evol. 2009;1:382–390. doi: 10.1093/gbe/evp038. [DOI] [PMC free article] [PubMed] [Google Scholar]
- 21.Akaike H. A new look at the statistical model identification. Automat. Control. 1974;19:716–723. [Google Scholar]
- 22.Sharp P.M., Li W.-H. The codon adaptation index—a measure of directional synonymous codon usage bias, and its potential applications. Nucleic Acids Res. 1987;15:1281–1295. doi: 10.1093/nar/15.3.1281. [DOI] [PMC free article] [PubMed] [Google Scholar]
- 23.Bird A. DNA methylation and the frequency of CpG in animal DNA. Nucleic Acids Res. 1980;8:1499–1504. doi: 10.1093/nar/8.7.1499. [DOI] [PMC free article] [PubMed] [Google Scholar]
- 24.Weber M., Hellmann I., Stadler M.B., Ramos L., Pääbo S., Rebhan M., Schübeler D. Distribution, silencing potential and evolutionary impact of promoter DNA methylation in the human genome. Nat. Genet. 2007;39:457–466. doi: 10.1038/ng1990. [DOI] [PubMed] [Google Scholar]
- 25.Elango N., Yi S.V. DNA methylation and structural and functional bimodality of vertebrate promoters. Mol. Biol. Evol. 2008;25:1602–1608. doi: 10.1093/molbev/msn110. [DOI] [PubMed] [Google Scholar]
- 26.Zemach A., McDaniel I.E., Silva P., Zilberman D. Genome-wide evolutionary analysis of eukaryotic DNA methylation. Science. 2010;328:916–919. doi: 10.1126/science.1186366. [DOI] [PubMed] [Google Scholar]
- 27.Feng S., Cokus S.J., Zhang X., Chen P.-Y., Bostick M., Goll M.G., Hetzel J., Jain J., Strauss S.H., Halpern M.E., et al. Conservation and divergence of methylation patterning in plants and animals. Proc. Natl Acad. Sci. USA. 2010;107:8689–8694. doi: 10.1073/pnas.1002720107. [DOI] [PMC free article] [PubMed] [Google Scholar]
- 28.Maunakea A.K., Nagarajan R.P., Bilenky M., Ballinger T.J., D'Souza C., Fouse S.D., Johnson B.E., Hong C., Nielsen C., Zhao Y., et al. Conserved role of intragenic DNA methylation in regulating alternative promoters. Nature. 2010;466:253–257. doi: 10.1038/nature09165. [DOI] [PMC free article] [PubMed] [Google Scholar]
- 29.Xiong Y., Chen X., Chen Z., Wang X., Shi S., Wang X., Zhang J., He X. RNA sequencing shows no dosage compensation of the active X-chromosome. Nat. Genet. 2010;42:1043–1047. doi: 10.1038/ng.711. [DOI] [PubMed] [Google Scholar]
- 30.Wang E.T., Sandberg R., Luo S., Khrebtukova I., Zhang L., Mayr C., Kingsmore S.F., Schroth G.P., Burge C.B. Alternative isoform regulation in human tissue transcriptomes. Nature. 2008;456:470–476. doi: 10.1038/nature07509. [DOI] [PMC free article] [PubMed] [Google Scholar]
- 31.Pan Q., Shai O., Lee L.J., Frey B.J., Blencowe B.J. Deep surveying of alternative splicing complexity in the human transcriptome by high-throughput sequencing. Nat. Genet. 2008;40:1413–1415. doi: 10.1038/ng.259. [DOI] [PubMed] [Google Scholar]
- 32.Mortazavi A., Williams B.A., McCue K., Schaeffer L., Wold B. Mapping and quantifying mammalian transcriptomes by RNA-Seq. Nat. Meth. 2008;5:621–628. doi: 10.1038/nmeth.1226. [DOI] [PubMed] [Google Scholar]
- 33.Fu X., Fu N., Guo S., Yan Z., Xu Y., Hu H., Menzel C., Chen W., Li Y., Zeng R., et al. Estimating accuracy of RNA-Seq and microarrays with proteomics. BMC Genomics. 2009;10:161. doi: 10.1186/1471-2164-10-161. [DOI] [PMC free article] [PubMed] [Google Scholar]
- 34.Wang Z., Gerstein M., Snyder M. RNA-Seq: a revolutionary tool for transcriptomics. Nat. Rev. Genet. 2009;10:57–63. doi: 10.1038/nrg2484. [DOI] [PMC free article] [PubMed] [Google Scholar]
- 35.Dohm J.C., Lottaz C., Borodina T., Himmelbauer H. Substantial biases in ultra-short read data sets from high-throughput DNA sequencing. Nucleic Acids Res. 2008;36:e105. doi: 10.1093/nar/gkn425. [DOI] [PMC free article] [PubMed] [Google Scholar]
- 36.Zheng W., Chung L.M., Zhao H. Bias detection and correction in RNA-sequencing data. BMC Bioinform. 2011;12:290. doi: 10.1186/1471-2105-12-290. [DOI] [PMC free article] [PubMed] [Google Scholar]
- 37.Ellegren H., Smith N.G., Webster M.T. Mutation rate variation in the mammalian genome. Curr. Opin. Genet. Dev. 2003;13:562–568. doi: 10.1016/j.gde.2003.10.008. [DOI] [PubMed] [Google Scholar]
- 38.Hurst L.D., Williams E.J. Covariation of GC content and the silent site substitution rate in rodents: implications for methodology and for the evolution of isochores. Gene. 2000;261:107–114. doi: 10.1016/s0378-1119(00)00489-3. [DOI] [PubMed] [Google Scholar]
- 39.Smith N., Webster M., Ellegren H. Deterministic mutation rate variation in the human genome. Genome Res. 2002;12:1350–1356. doi: 10.1101/gr.220502. [DOI] [PMC free article] [PubMed] [Google Scholar]
- 40.Yi S., Ellsworth D.L., Li W.H. Slow molecular clocks in Old World monkeys, apes, and humans. Mol. Biol. Evol. 2002;19:2191–2198. doi: 10.1093/oxfordjournals.molbev.a004043. [DOI] [PubMed] [Google Scholar]
- 41.Roberts A., Trapnell C., Donaghey J., Rinn J., Pachter L. Improving RNA-Seq expression estimates by correcting for fragment bias. Genome Biol. 2011;12:R22. doi: 10.1186/gb-2011-12-3-r22. [DOI] [PMC free article] [PubMed] [Google Scholar]
- 42.Vinogradov A.E. ‘Genome design’ model and multicellular complexity: golden middle. Nucleic Acids Res. 2006;34:5906–5914. doi: 10.1093/nar/gkl773. [DOI] [PMC free article] [PubMed] [Google Scholar]
- 43.Peterson M.K., Bryman M.B., Peiter M., Cowan C. Exon size affects competition between splicing and cleavage-polyadenylation in the immunoglobulin mu gene. Mol. Cell. Biol. 1994;14:77–86. doi: 10.1128/mcb.14.1.77. [DOI] [PMC free article] [PubMed] [Google Scholar]
- 44.Carmel L., Rogozin I.B., Wolf Y.I., Koonin E.V. Evolutionarily conserved genes preferentially accumulate introns. Genome Res. 2007;17:1045–1050. doi: 10.1101/gr.5978207. [DOI] [PMC free article] [PubMed] [Google Scholar]
- 45.Antequera F. Structure, function and evolution of CpG island promoters. CMLS Cell Mol. Life Sci. 2003;60:1647–1658. doi: 10.1007/s00018-003-3088-6. [DOI] [PMC free article] [PubMed] [Google Scholar]
- 46.Saxonov S., Berg P., Brutlag D.L. A genome-wide analysis of CpG dinucleotides in the human genome distinguishes two distinct classes of promoters. Proc. Natl Acad. Sci. USA. 2006;103:1412–1417. doi: 10.1073/pnas.0510310103. [DOI] [PMC free article] [PubMed] [Google Scholar]
- 47.Illingworth R.S., Bird A.P. CpG islands—‘a rough guide’. FEBS Lett. 2009;583:1713–1720. doi: 10.1016/j.febslet.2009.04.012. [DOI] [PubMed] [Google Scholar]
- 48.Elango N., Yi S.V. Functional relevance of CpG island length for regulation of gene expression. Genetics. 2011;187:1077–1083. doi: 10.1534/genetics.110.126094. [DOI] [PMC free article] [PubMed] [Google Scholar]
- 49.Elango N., Hunt B.H., Goodisman M.A.D., Yi S.V. DNA methylation is widespread and associated with differential gene expression in castes of the honeybee, Apis mellifera. Proc. Natl Acad. Sci. USA. 2009;106:11206–11211. doi: 10.1073/pnas.0900301106. [DOI] [PMC free article] [PubMed] [Google Scholar]
- 50.Hunt B.G., Brisson J.A., Yi S.V., Goodisman M.A.D. Functional conservation of DNA methylation in the pea aphid and the honeybee. Genome Biol. Evol. 2010;2:719–728. doi: 10.1093/gbe/evq057. [DOI] [PMC free article] [PubMed] [Google Scholar]
- 51.Bird A. Gene number, noise reduction and biological complexity. Trends Genet. 1995;11:94–100. doi: 10.1016/S0168-9525(00)89009-5. [DOI] [PubMed] [Google Scholar]
- 52.Suzuki M.M., Kerr A.R.W., De Sousa D., Bird A. CpG methylation is targeted to transcription units in an invertebrate genome. Genome Res. 2007;17:625–631. doi: 10.1101/gr.6163007. [DOI] [PMC free article] [PubMed] [Google Scholar]
- 53.Keightley P.D., Lercher M.J., Eyre-Walker A. Evidence for widespread degradation of gene control regions in hominoid genomes. PLoS Biol. 2005;3:e42. doi: 10.1371/journal.pbio.0030042. [DOI] [PMC free article] [PubMed] [Google Scholar]
- 54.Kim S.-H., Yi S.V. Mammalian nonsynonymous sites are not overdispersed: comparative genomic analysis of index of dispersion of mammalian proteins. Mol. Biol. Evol. 2008;25:634–642. doi: 10.1093/molbev/msm281. [DOI] [PubMed] [Google Scholar]
- 55.Domazet-Loso T., Tautz D. A phylogenetically based transcriptome age index mirrors ontogenetic divergence patterns. Nature. 2010;468:815–818. doi: 10.1038/nature09632. [DOI] [PubMed] [Google Scholar]
- 56.Kalinka A.T., Varga K.M., Gerrard D.T., Preibisch S., Corcoran D.L., Jarrells J., Ohler U., Bergman C.M., Tomancak P. Gene expression divergence recapitulates the developmental hourglass model. Nature. 2010;468:811–814. doi: 10.1038/nature09634. [DOI] [PubMed] [Google Scholar]
- 57.Yang Z. PAML: a program package for phylogenetic analysis by maximum likelihood. Comp. Appl. Biosci. 1997;13:555–556. doi: 10.1093/bioinformatics/13.5.555. [DOI] [PubMed] [Google Scholar]
- 58.Oehlert G.W. A note on the Delta method. Am. Stat. 1992;46:27–29. [Google Scholar]
- 59.Hogg R.V., McKean J.W., Craig A.T. Introduction to Mathematical Statistics. Upper Saddle River, NJ: Pearson Prentice Hall; 2005. [Google Scholar]
- 60.Dunnett C.W. A multiple comparisons procedure for comparing several treatments with a control. J. Am. Stat. Assoc. 1955;50:1096–1121. [Google Scholar]
- 61.Abdi H. The Bonferonni and Sidak Corrections for Multiple Comparisons. In: Salkind N.J., editor. Encyclopedia of Measurement and Statistics. Thousand Oaks, CA: Sage; 2007. pp. 103–107. [Google Scholar]
- 62.R core team. 2011. R: a language and environment for statistical computing. R Foundation for Statistical Computing, Vienna, Austria. ISBN 3-900051-07-0, URL http://www.R-project.org . [Google Scholar]
- 63.SAS Institute. SAS, Statistical Analysis System. SAS Institute Inc., Cary, NC: 1971. [Google Scholar]
Associated Data
This section collects any data citations, data availability statements, or supplementary materials included in this article.