

Abstract
Background
Acetaldehyde is produced during ethanol metabolism predominantly in the liver by alcohol dehydrogenase, and rapidly eliminated by oxidation to acetate via aldehyde dehydrogenase. Assessment of circulating acetaldehyde levels in biological matrices is performed by headspace gas chromatography and reverse phase high-performance liquid chromatography (RP-HPLC).
Methods
We have developed an optimized method for the measurement of acetaldehyde by RP-HPLC in hepatoma cell culture medium, blood and plasma. After sample deproteinization, acetaldehyde was derivatized with 2,4-dinitrophenylhydrazine (DNPH). The reaction was optimized for pH, amount of derivatization reagent,, time and temperature. Extraction methods of the acetaldehyde-hydrazone (AcH-DPN) stable derivative and product stability studies were carried out. Acetaldehyde was identified by its retention time in comparison to AcH-DPN standard, using a new chromatography gradient program, and quantitated based on external reference standards and standard addition calibration curves in the presence and absence of ethanol.
Results
Derivatization of acetaldehyde was performed at pH 4.0 with a 80-fold molar excess of DNPH. The reaction was completed in 40 min at ambient temperature, and the product was stable for 2 days. A clear separation of AcH-DNP from DNPH was obtained with a new 11-min chromatography program. Acetaldehyde detection was linear up to 80 μM. The recovery of acetaldehyde was >88% in culture media, and >78% in plasma. We quantitatively determined the ethanol-derived acetaldehyde in hepatoma cells, rat blood and plasma with a detection limit around 3 μM. The accuracy of the method was <9% for intraday and <15% for interday measurements, in small volume (70 μl) plasma sampling.
Conclusions
An optimized method for the quantitative determination of acetaldehyde in biological systems was developed using derivatization with DNPH, followed by a short RP-HPLC separation of AcH-DNP. The method has an extended linear range, is reproducible and applicable to small volume sampling of culture media and biological fluids.
Keywords: Ethanol, Acetaldehyde, Hydrazine, Hepatoma cells, Rat blood, plasma
THE LEVEL OF circulating acetaldehyde (AcH) after ethanol ingestion depends on the rate of its formation and elimination (Deitrich et al., 2007). Acetaldehyde is derived from the oxidation of ethanol by alcohol dehydrogenase, with lesser contributions from the microsomal ethanol oxidizing system and catalase. It is metabolized mainly by aldehyde dehydrogenase (ALDH) to acetate. The liver mitochondrial ALDH2 isozyme is responsible for almost all elimination of acetaldehyde in humans and rats. Low micromolar levels of acetaldehyde are detectable in tissues and biological fluids after ethanol consumption (Eriksson, 2007). There is great interest in measuring elevated acetaldehyde levels after ethanol consumption in: (i) Heavy drinkers (Eriksson, 1980; Lindros et al., 1980, Matthewson et al., 1986); (ii) Heterozygotes and homozygotes for the ALDH2*2 allele among Southeast Asians carrying a point mutation (G1510A) that causes a Glu487Lys substitution, with consequent decreased affinity for NAD+ and decreased activity of the liver enzyme (Yoshida et al., 1998), compared to ALDH2*1 carriers (Chen et al., 2009); (iii) Alcoholics treated with disulfiram (Antabuse) in aversive therapy for alcoholism (Barth and Malcolm, 2010) after ethanol consumption. Disulfiram is an FDA-approved small molecule that inhibits ALDH2 by irreversible binding of its metabolites to sulfhydryl groups in the active site of the enzyme (Lipsky et al., 2001); (iv) Screening for new drugs to provide aversion therapy treatment of alcoholics (for examples see Arolfo et al., 2009; Garver et al., 2001; Igoucheva et al., 2008); (v) Human alcohol-related diseases and experimental models in which acetaldehyde has been proposed as an etiologic agent (Quertemont and Didone, 2006; Preedy et al., 2007; Ren, 2007; Salaspuro, 2007; Seitz and Stickel, 2010).
Several methods have been developed for the determination of acetaldehyde levels in biological samples. Measurement in this complex matrix is prone to errors introduced by the high volatility of acetaldehyde (boiling point 20°C), inherently low amounts (micromolar), residual amounts in common reagents and solvents (acetic acid, water, etc) and plastics that raise the background level, condensation reactions with all classes of macromolecules, and the presence of interfering substances (ethanol, proteins). Headspace gas chromatography (HS-GC) and reverse phase high-performance liquid chromatography (RP-HPLC) are the two main methods used for measurement of acetaldehyde.
The HPLC method entails labeling with a derivatization reagent for stabilization and selective determination of acetaldehyde. Most derivatization protocols for acetaldehyde are based on reaction with hydrazines (Vogel et al., 2000). These reagents readily react with carbonyls in acidic media to form the respective hydrazones, which are typically separated by RP-HPLC and detected photometrically or fluorometrically. The eluting compounds are characterized by comparison of their retention time with those of internal and external standards and their spectra. The molecular weight and structure of the products can be further elucidated by mass spectrometry (Kempter et al., 1999; Peters et al., 2004; van Leeuwen et al., 2004; You et al., 2009). The most popular hydrazine for the derivatization of acetaldehyde has been 2,4-dinitrophenylhydrazine (DNPH) (Brady and Elsmie, 1926; references cited in Table 2).
Table 2.
Comparison of retention times of AcH-DNP and DNPH, separation interval between the two peaks, and length of different chromatographic methods.
| Retention time (tR) | Δ tR | Duration | References | |
|---|---|---|---|---|
| DNPH | AcH-DNP | |||
| 7.04 | 13.67 | 6.63 | 30 | Lynch et al., 1983 |
| 1.00 | 2.31 | 1.31 | 4.0 | Di Padova et al., 1986 |
| nd | 11.25 | nd | 20 | Lucas et al., 1986 |
| 3.50 | 8.44* | 4.94 | 25 | Bicking et al., 1988 |
| 5.87 | 9.13 | 3.26 | 15 | Cotsaris and Nicholson, 1993 |
| 7.90 | 15.0 | 7.10 | 40 | Environmental Protection Agency, 1996 |
| 4.71 | 8.88 | 4.17 | 17 | Pötter and Karst, 1996 |
| 1.32 | 2.51 | 1.19 | 3.0 | Kozutsumi et al., 2002 |
| 4.89 | 12.41 | 7.52 | 60 | Uchiyama et al., 2003 |
| 5.20 | 10.30 | 5.10 | 16 | Van Leeuwen et al., 2004 |
| 4.00 | 6.00 | 2.00 | 12.5 | Saczk et al., 2005 |
| 2.75 | 9.00 | 6.25 | 35 | Zhang et al., 2006 |
| 2.33 | 3.69 | 1.36 | 11 | Guan et al., 2009 |
| 2.75 | 7.81 | 5.06 | 11 | Guan et al., this work** |
All values are expressed in min; nd, not determined
The 8.44 min tR represents the syn-isomer of the derivative
Average tR in 40% acetonitrile with improved HPLC gradient and resolution
In this work, an optimized method for the determination of acetaldehyde in biological samples has been developed. Acetaldehyde in deproteinized samples was quantitatively derivatized with DNPH, and AcH-DNP was extracted. The separation of acetaldehyde was carried out using a RP C18 column. A new gradient system provided for increased HPLC resolving power, thus avoiding interferences from coelution with DNPH. The acetaldehyde peak was identified by its retention time against authentic AcH-DNP, and the concentration of acetaldehyde was calculated based on calibration curves. We have investigated the stability of derivatized acetaldehyde and the contribution of ethanol in the acetaldehyde measurements, and validated this method in hepatoma cell cultures capable of ethanol metabolism, and in rat blood and plasma samples.
MATERIALS AND METHODS
Reagents
Acetaldehyde, DNPH, and sodium acetate were purchased from Sigma (St. Louis, MO). External reference standard AcH-DNP (1 mg/ml) from Supelco (Bellefonte, PA) was diluted with acetonitrile (AcN). HPLC-grade acetonitrile, trifluoroacetic acid (TFA) and water, and ACS grade Hcl, perchloric acid and isooctane were obtained from Fisher Scientific (Fair Lawn, NJ). Dulbecco’s Modified Eagle Medium (DMEM), phenol red-free DMEM, fetal bovine serum (FBS), horse serum and 0.25% trypsin-EDTA were purchased from Invitrogen (Carlsbad, CA).
Derivatization of acetaldehyde and extraction of AcH-DNP
Samples (70 μl) were first deproteinized with two volumes of 3 M perchloric acid. The pH of the solution was adjusted immediately to 4.0 with two volumes 3 M sodium acetate buffer, pH 9.0. After centrifugation (1,500 × g for 10 min at 4°C), the supernatant was transferred into an ice-cold tube. Acetaldehyde in the sample was derivatized with 80-fold molar excess DNPH for 1 hr at 22 °C with shaking. DNPH (2 mg/mL) was dissolved in 6 N Hcl immediately prior to derivatization. The derivatization reaction was stopped with three volumes 3 M sodium acetate buffer, pH 9.0. The efficiency of the derivatization of acetaldehyde was measured as a function of pH (0.5–7.4), temperature (4, 22 °C), time (5–960 min) and molar ratio DNPH:AcH (5–1,000).
The AcH-DNP condensate was extracted from the reaction mixture either by solid-phase or liquid-liquid extraction. A Sep-Pak C18 cartridge (55–105 μm particle size, 125 Å pore size, 360 mg capacity) (Waters, Milford, MA) was used for solid-phase extraction. The cartridge was conditioned with methanol and water according to manufacturer’s instructions. The reaction mixture (1 ml) was applied to the conditioned cartridge, and unreacted DNPH was washed off with water (1 ml), followed by 30–70% methanol (1 ml); AcH-DNP was eluted with 100% methanol (2 ml). The methanolic extract was dried overnight using a Labconco centrifugal vacuum concentrator equipped with a cold trap (Kansas City, MI), reconstituted in 40–65% acetonitrile and either measured immediately or stored at −20°C before HPLC analysis. For liquid-phase extraction, two volumes of organic solvent (isooctane or acetonitrile) were added to the reaction mixture. AcH-DNP and excess DNPH were extracted into organic phase with shaking for 1 hour at 4°C or 30 min at room temperature. The organic phase containing AcH-DNP and residual DNPH was separated by centrifugation (10,000 × g for 5 min at 4°C), and the solvent was evaporated overnight under vacuum.
HPLC system
The HPLC system was equipped with two Beckman Gold system programmable solvent Module 125 pumps and a diode array Module168 detector (Fullerton, CA), as previously described (Anni and Israel, 1999; Anni et al., 2003). A Beckman Ultrasphere RP C18 column (25 cm × 4.6 mm i.d., 5 μm) coupled with an ODS guard column (4.5 cm × 4.6 mm i.d.) was employed for sample analysis.
Derivatized samples were dissolved in 40–65% acetonitrile and injected into a 20 μl sample loop. The flow-rate was 1 ml/min, and detection of AcH-DNP and DNPH was performed at 360 nm. The 215 nm peptide bond was also monitored to confirm sample deproteinization. The AcH-DNP peak was eluted with an 11-min program using mobile phase with solvents A, 0.1% TFA/water (v/v), and B, 0.1% TFA/AcN (v/v). The column was equilibrated with 40% B/60% A for 2 min. Elution was performed with a linear gradient to 75% B/25%A in 5 min, followed by a gradient to 100% B in 2 min. The column was re-equilibrated to 40% B/60% A in 2 min (see gradient in Fig. 1A). The retention times (tR) of AcH-DNP and DNPH were confirmed by comparison with standards. The values of the area under the curve (AUC) of the peaks were determined with a Beckman Coulter - 32 Karat software program.
Fig. 1.
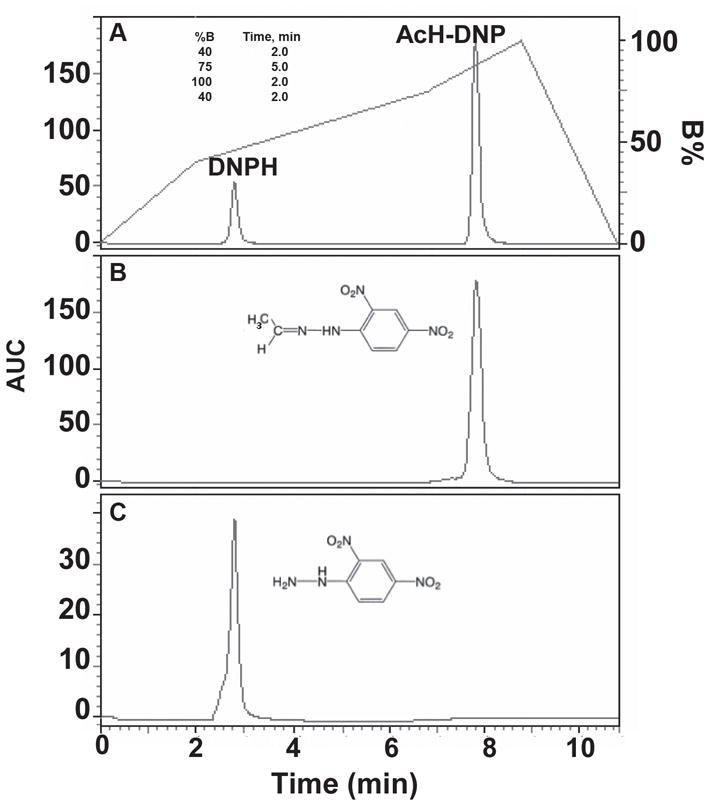
RP-HPLC separation of AcH-DNP and DNPH authentic reference standards dissolved in 40% acetonitrile. (A) AcH-DNP (22.3 μM) and DNPH (50.5 μM) in a mixture were identified as two distinct peaks with retention time of 7.833 min and 2.833 min, respectively using the HPLC gradient program shown in the inset Table. (B) AcH-DNP eluted at 7.950 min, (C) DNPH eluted at 2.783 min. Area under the curve (AUC) in Y-axis is expressed as mAU×10−6.
An external calibration curve of acetaldehyde up to 300 μM, was established using AcH-DNP reference standard dissolved in 40% acetonitrile.
A standard addition calibration curve of acetaldehyde was constructed by spiking acetaldehyde (1.5 mM stock solution) in cell culture medium (phenol red-free DMEM). Different acetaldehyde amounts (up to 80 μM) in DMEM were incubated in tightly-closed flasks for 2 hours at 37°C in the absence or presence of 3 mM ethanol. The samples were deproteinizated, derivatized overnight at 4°C, and AcH-DNP was extracted into acetonitrile for 30 min at room temperature. The dried sample was reconstituted in 40% acetonitrile and stored at −20°C until HPLC analysis.
Hepatoma cells
Human hepatoma cell line VA-13 was derived from HepG2 cells by stable transduction with murine alcohol dehydrogenase (Adh-1), and was a kind gift of Dr. Dahn Clemens, Veterans Administration Medical Center, Omaha, NE. Cells (1×10⁶) were cultured in DMEM medium containing 10% FBS in 5% CO2 at 37°C, as previously described (Clemens et al., 2002). Ethanol (25, 50 mM) was added to attached cells, and incubated for 24 hrs at 37°C in tightly capped T25 flasks. Cell confluence was approximately 50% at the time of acetaldehyde measurement. At the end of the incubation period, the flasks were moved to 4°C for 30 min to ensure transfer of acetaldehyde from the gas to the liquid phase. The culture medium was then transferred to a cold tube, deproteinized, derivatized and further processed as described above.
Alcohol dehydrogenase (ADH) activity in VA13 cells was determined by a modification of the procedure described by Clemens et al. (1995). ADH activity was expressed as nmol of NADH generated/hr/mg total cellular protein. Protein concentration was determined using the BCA (bicinchoninic acid) assay kit obtained from Pierce (Rockford, IL).
Rat blood and plasma
Male Sprague-Dawley rats were purchased from Harlan (Indianapolis, IN). and fed ad libitum chow diet. Animals (434 ± 38 g body weight) were anesthetized and blood was collected by cardiac puncture in cold heparinized vacutainer tubes (Becton Dickinson, Franklin Lakes, NJ). Plasma was quickly separated by centrifugation (2,000 × g, 15 min, 4°C).
Whole blood and plasma were spiked with 50 μM acetaldehyde in the presence or absence of 20 mM ethanol. Samples were deproteinized with the addition of 3 M perchloric acid and centrifugation (3,000 × g for 10 min at 4°C), and then derivatized at pH 4.0 for 1 hour with 80-fold excess DNPH. The reaction was quenched at pH 9.0; the mixture was extracted into acetonitrile and lyophilized overnight. Dried samples were resuspended in 65% acetonitrile and measured immediately by HPLC. All experimental procedures were approved by the Animal Care and Use Committee of Thomas Jefferson University, and performed according to the criteria outlined by the National Research Council.
Statistics
Values shown are means of triplicate measurements with standard deviation of the mean (SD), if not otherwise indicated, and coefficient of variance (CV). Differences between means were compared using the Student’s t test.
RESULTS
Determination of acetaldehyde as a derivatized stable adduct with hydrazine involves the following steps: acetaldehyde pre-concentration by cryogenic sampling, sample deproteinization, acetaldehyde derivatization, extraction of adduct into organic phase, sample concentration by evaporation to dryness, residue dissolution in acetonitrile, aliquot injection onto the column, measurement of hydrazone by RP-HPLC with visible/UV detection, and identification and quantification using external derivatized acetaldehyde (AcH-DNP) authentic reference standard and standard addition of acetaldehyde in matrices of interest to construct appropriate calibration curves. We systematically studied the different steps in this process to optimize the yield of the final product, avoiding loss or artefactual formation of acetaldehyde. We also developed a new chromatography program to clearly separate AcH-DNP from the unreacted derivatization agent, DNPH.
Method optimization
Chromatographic separation of AcH-DNP
A single AcH-DNP peak was resolved with an 11-min chromatographic run (Fig. 1A). The distinct peak of AcH-DNP eluted 5 min later than DNPH, ensuring that the presence of residual amounts of DNPH does not interfere with the quantitation of AcH-DNP. The retention time of AcH-DNP and DNPH are identical to those of authentic reference standards (Fig. 1B, C), within 1.47% and 1.79%, respectively. Moreover, acetonitrile and blank sample did not show the presence of acetyl-hydrazone or other peaks, indicating lack of contaminating impurities (data not shown).
Yield of AcH-DNP
The derivatization of acetaldehyde is based on the reaction of its carbonyl group with the hydrazine group of DNPH, and formation of acetyl-hydrazone after elimination of water. The rate-limiting step is the condensation of the hydrazine group (NH2-NH-) of DNPH to the protonated carbonyl moiety (+HC=O) of acetaldehyde. At different pH there are competing effects between the acetaldehyde and DNPH reactive states, and the availability of DNPH dominates the optimum pH (Bicking et al., 1988). The formation of AcH-DNP as a function of pH is shown in Fig. 2A. The maximum yield of AcH-DNP was obtained at pH 4.0, whereas lower values were observed at more acidic or neutral pH. At the optimum pH 4.0, the AcH-DNP level reached a plateau within 40 min of incubation at room temperature or 16 hours incubation at 4°C (Fig. 2 inset).
Fig. 2.
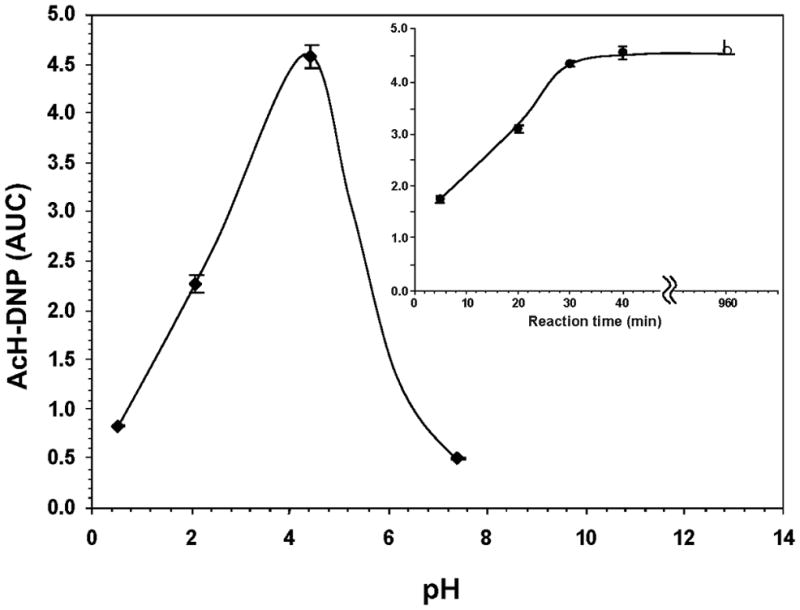

Derivatization of acetaldehyde with DNPH as a function of pH, reaction time and DNPH concentration. (A) The yield of AcH-DNP was determined in the range pH1.0–8.0 by incubation of acetaldehyde (45 μM) with 80-fold molar excess of DNPH at ambient temperature for 40 min. Inset, Dependence of the yield of AcH-DNP on the reaction time (pH 4.0; ambient temperature); open circle indicates overnight incubation at 4°C. (B) The yield of AcH-DNP as a function of molar excess of DNPH was measured with acetaldehyde (35 μM) incubated at pH 4.0 and ambient temperature for 40 min. AUC is expressed as mAU×10−6.
The efficiency of the derivatization reaction depends also on the molar excess of DNPH over acetaldehyde. The yield of AcH-DNP employing 5 to 100-fold molar excess of DNPH is presented in Fig. 2B. Data showed that an 80–100 fold excess of DNPH ensured complete conversion of acetaldehyde into AcH-DNP.
Liquid/solid phase extraction into organic phase
We initially used a Sep-Pak C18 cartridge as described in Materials and Methods to selectively extract AcH-DNP into organic phase,. While most DNPH was removed from the cartridge with 1.5 ml of 70% methanol, AcH-DNP co-eluted in this washing step (data not shown),. This carryover effect resulted in either low efficiency of extraction or contamination with DNPH, as observed by other investigators (Kozutsumi et al., 2002; Ma and Klemm, 1997). Alternatively,, both AcH-DNP and DNPH were extracted by liquid-liquid extraction into an organic solvent (acetonitrile or isooctane) with negligible amounts remaining in the aqueous phase (data not shown). Acetonitrile, rather than isooctane, was selected as extraction solvent, because of its higher miscibility with water. The excellent chromatographic separation of AcH-DNP and residual DNPH afforded co-extraction of both compounds.
Stability of AcH-DNP
Storage of AcH-DNP reconstituted in 40–65% acetonitrile for different periods of time (1–4 days) at −20°C showed that 91% of AcH-DNP was recovered after 2 days of storage at −20°C, but longer periods of storage resulted in acetaldehyde losses (Fig. 3).
Fig. 3.

Stability of AcH-DNP. Acetaldehyde was derivatized with 80-fold excess of DNPH at the optimum pH 4.0. The sample was extracted in 40% acetonitrile, dried, reconstituted in 40% acetonitrile and stored for different periods of time at −20°C. AUC is expressed as mAU×10−6.
Chromatographic measurements
Calibration curves
The AcH-DNP reference standard calibration curve showed excellent linear response up to 200 μM (Fig. 4). A calibration curve was also constructed by addition of known amounts of acetaldehyde to hepatocyte culture medium (in the absence of cells and FBS) and incubation for 2 hours at 37°C followed by in-house derivatization, as described in Materials and Methods. In the range of biological significance, there was a linear relationship between measured AcH-DNP values and the concentration of added acetaldehyde up to 80 μM (Fig. 4 inset). The background acetaldehyde value was negligible (0.31 ± 0.05 μM). Standard addition values represented 96% of those of the AcH-DNP reference standard. The decreased slope of the standard addition curve versus the AcH-DNP standard curve reflects the contribution of sample deproteinization, derivatization and extraction processes to acetaldehyde recovery. In the presence of 3 mM ethanol during sample incubation, the acetaldehyde yield was decreased by 8%.
Fig. 4.

Calibration curve of external reference standard AcH-DNP in 40% acetonitrile (n=6). Inset, Standard addition calibration curve with known acetaldehyde amounts added to culture medium, and in the presence of 3 mM ethanol (dotted line) (n=4). AUC is expressed as mAU×10−6.
Hepatoma cells
Ethanol-derived acetaldehyde was measured in culture medium of VA13 hepatoma cells incubated with different concentrations of ethanol (25, 50 mM) for 24 hrs. The acetaldehyde level increased as a function of ethanol concentration (Fig. 5), while the background acetaldehyde value (in the presence of cells and FBS) was 2.60 ± 0.51μM (p = 0.06).
Fig. 5.

Dose-dependent accumulation of acetaldehyde in the cell culture medium after incubation of VA13 hepatoma cells with 25 or 50 mM ethanol for 24 hrs. Samples were 4-fold diluted for the measured values to be within the linear range of the calibration curve.
Rat blood and plasma
Derivatized acetaldehyde in rat blood and plasma samples was eluted with a retention time of 7.025 ± 0.195 min, and a separation by 4.488 ± 0.164 min from DNPH. The values are in close agreement in comparison to the corresponding AcH-DNP reference standard in 65% acetonitrile (tR AcH-DNP = 7.044 ± 0.168 min; ΔtR (DNPH - AcH-DNP) = 4.540 ± 0.166 min.
Four types of measurements were performed to address the loss or potential artifactual generation of acetaldehyde in blood and plasma samples: i) Blood was spiked with 50 μM acetaldehyde, and the level of acetaldehyde recovered after deproteinization, serial dilution and derivatization was measured. The obtained values were compared to authentic AcH-DNP standards, and the yield and net effect of the deproteinization and derivatization processes was estimated. ii) Blood was spiked with acetaldehyde in the presence of 20 mM ethanol to account for ethanol-related artifacts, and serial dilution samples were similarly prepared. iii–iv) Plasma was spiked with acetaldehyde in the presence or absence of ethanol, deproteinized and derivatized as blood samples above. The obtained values were compared with samples i–ii and the loss due to binding of acetaldehyde to proteins and red blood cells, and the effect of ethanol were evaluated. The plasma acetaldehyde values (after normalization for recovery) were 54.27 ± 3.24 μM in the absence of ethanol, and 55.11 ± 2.86 μM in the presence of ethanol (p = 0.17). The background plasma acetaldehyde concentration was 2.64 ± 0.37 μM in the absence of ethanol, and 3.40 ± 0.84 μM in the presence of 20 mM ethanol (p = 0.25). The calculated acetaldehyde level after background subtraction was 51.03 μM in the absence of ethanol, and 51.71 μM in the presence of ethanol. These acetaldehyde values correspond to 102.6% and 103.42 % of the spiked 50 μM amount, in the absence and presence of ethanol, respectively. The plasma acetaldehyde recovery in the presence of 20 mM ethanol was 73.05 ± 3.68 %, compared to 78.47 ± 1.73 % in the absence of ethanol (6.9% decrease, p = 0.04). Approximately 10% less recovery of acetaldehyde was obtained from blood, while the background acetaldehyde level was 2.76 ± 0.79 μM vs. 3.64 ± 1.38 μM, in the absence and presence of ethanol, respectively (p = 0.34).
Intraday (within assay) technical and interday (between assay) biological variation of measurements in plasma are presented in Table 1. Interday acetaldehyde values showed CV < ±14% and accuracy < ±15%, while intraday measurements had CV <±9% and accuracy < ±18. Data showed that the detection limit of acetaldehyde was > 3 μM (S/N>2).
Table 1.
Interday and intraday variation of measurements of plasma spiked with acetaldehyde.
| Spiked | Measured* | SD | Accuracy % | CV % |
|---|---|---|---|---|
| AcH (μM) | ||||
| Interday variation (n=4) | ||||
| 3.1 | 3.6 | 0.51 | 115 | 14.2 |
| 6.3 | 6.6 | 0.39 | 106 | 5.9 |
| 25.0 | 25.4 | 2.81 | 102 | 11.1 |
| 50.0 | 57.0 | 3.36 | 114 | 5.9 |
| Intraday variation (n=3) | ||||
| 3.1 | 3.3 | 0.61 | 107 | 18.3 |
| 6.3 | 5.8 | 0.49 | 92 | 8.6 |
| 25.0 | 23.8 | 3.23 | 95 | 13.6 |
| 50.0 | 54.3 | 5.10 | 109 | 9.4 |
Values were corrected for recovery based on corresponding calibration curves.
DISCUSSION
The accurate measurement of acetaldehyde level in biological samples is important because the first metabolite of ethanol has been suggested to play a role in a number of alcohol-related disorders, such as cancer (for reviews see Salaspuro, 2007; Seitz and Stickel 2010), cardiomyopathy (Ren et al., 2007), myopathy (Preedy et al., 2007) and addiction (Deng and Deitrich, 2008; Quertemont and Didone, 2006). Importantly, the levels of circulating acetaldehyde after ethanol ingestion are elevated in Asians who carry the inactive ALDH2*2 allele (Crabb et al., 1993). In addition, a number of drugs, e.g., disulfiram, used to inhibit ALDH2 and thereby create an aversion to alcohol consumption, increase acetaldehyde levels (Barth and Malcolm, 2010). Finally, the development of new pharmacologic agents targeting ALDH2 for aversive therapy in alcoholics (Arolfo, et al., 2009; Garver et al., 2001, Igoucheva et al., 2008) requires as a readout acetaldehyde quantitation.
The determination of ethanol-derived acetaldehyde in biological samples is performed with HS-GC (Eriksson 1983; Portari et al., 2008). In addition, RP-HPLC methodology has been developed and employed for evaluation of acetaldehyde content in biological fluids of experimental animals and human subjects (e.g., Akubue et al., 1994; Arolfo et al., 2009; Garver et al., 2000; 2001; Hamby-Mason et al., 1997; Nagy et al., 2004; Rouach et al., 2005; Di Padova et al., 1986; Kozutsumi et al., 2002; Lucas et al., 1986; Lynch et al., 1983; Zhang et al., 2006). The RP-HPLC method is based on selective labeling of acetaldehyde with DNPH, which produces a stable product, with visible/UV absorbance.
Cryogenic sampling was used to avoid loss of acetaldehyde from samples by evaporation before derivatization, and binding of acetaldehyde to macromolecules during deproteinization. We found that the addition reaction of acetaldehyde with DNPH was pH dependent (see Fig. 2A). The rate of AcH-DNP formation was greatest at acidic pH, and dropped at higher and lower pH. The acid-catalyzed reaction had an optimum pH 4.0, since the rate-limiting step is the protonation of carbonyl oxygen, followed by the loss of water to form hydrazone. An optimum pH of 4.0 for the derivatization reaction was also found by Kozutsumi et al. (2002), though stronger acidic conditions have been also reported (Bicking et al., 1988; Cotsaris and Nicholson, 1993). The reaction at the optimum pH was completed within 40 min at ambient temperature or with longer incubation at 4°C (see Fig. 2A inset). For quantitative derivatization of acetaldehyde an 80–100 fold molar excess of DNPH was consumed (see Fig. 2B). It is important to note that initial derivatization with different amounts of DNPH (80, 800, 8000 μM) are required to determine accurately the range of acetaldehyde present. The stability of derivatized acetaldehyde deteriorated with time (see Fig. 3), as observed earlier with other derivatization agents (Bajpai et al., 2007), and therefore reconstituted samples were measured within 2 days of storage at −20°C.
Using a RP C18 column, and a gradient elution system with acetonitrile and trifluoroacetic acid, AcH-DNP was detected as a single peak in a short 11-min chromatographic run (see Fig. 1). Acetonitrile was selected as a solvent based on its chemical and physical properties, and their effects on the chromatographic separation, detection limits, and analytical reproducibility. It is a polar solvent miscible with water, but has also hydrophobic properties forming binary acetonitrile-water mixtures, to elute substances from a non-polar RP chromatography column. This allows for a simple prediction of retention based on the acetonitrile concentration. Additionally, acetonitrile has a very low absorbance (<0.05 AU) at wavelengths as low as 200 nm, which permits analysis of the 215 nm peptidic bond to reconfirm sample deproteinization. The AcH-DNP peak represented both E and Z isomers (Uchiyama et al., 2003), and therefore it accounted for all acetaldehyde present. Hydrazone products of ketones and carboxylic acids were not detected. The retention time of AcH-DNP in 40% acetonitrile was 7.81 ± 0.08 min in the standard addition samples (n = 177 HPLC runs, CV = 1.02%). Residual DNPH had a retention time of 2.75 ± 0.07 min, and separated by 5 min from the distinct AcH-DNP peak. Therefore, our method provides excellent resolution of the acetaldehyde peak, even at higher concentrations, without interference from residual DNPH, using a short chromatographic run (see comparison in Table 2).
Our chromatographic measurements showed a linear relationship (R2 = 0.9989) between the peak area and the concentration of AcH-DNP up to 200 μM, which was described by the linear regression equation: y = 0.1024x + 0.1754 (see Fig. 4). Similarly, a linear response up to 80 μM acetaldehyde was obtained with the standard addition method (y = 0.09837x + 0.02544). Substances, such as ethanol, have been reported to interfere with acetaldehyde measurements, for example, by forming nonenzymatically acetaldehyde during protein precipitation under acidic conditions (Fukunaga et al., 1993). The presence of 3 mM ethanol in culture medium samples spiked with acetaldehyde reduced the recovery of acetaldehyde to 88% (see Fig. 4 inset).
We validated our method by determining the level of acetaldehyde produced by human hepatoma cells capable of alcohol metabolism, after treatment for 24 hrs with different concentrations of ethanol (see Fig. 5). The acetaldehyde values obtained by RP-HPLC were comparable to those measured earlier by HS-GC, under the same experimental conditions (Clemens et al., 1995; 2002; Wu et al., 2006). Incubation of cells (at 50% cell confluency) for 24 hrs with 25 mM ethanol resulted in accumulation of 253.4 ± 5.9 μM acetaldehyde; background acetaldehyde value was in the range of 2.17–3.0 μM. The alcohol dehydrogenase activity of VA-13 cells was 610 ± 42.1 nmol NADH/hr/mg protein, in close agreement with the reported value of 649.2 ± 69.3 (Clemens et al., 2002). However, because the ALDH2 activity is lower in cells undergoing division (Moncada et al., 2003), the acetaldehyde concentration is half of that in confluent cells, 506 ± 128.5μM (Clemens et al., 2002).
We obtained a higher recovery of acetaldehyde in plasma compared to blood in the absence of binding of acetaldehyde to hemoglobin. The background acetaldehyde levels in plasma were in the range 2.64–3.40 μM (in the absence and presence of ethanol, respectively), and corresponding values in blood were similarly in the 2.76–3.64 μM range. The reproducibility of our measurements was shown by intraday and interday variation of the plasma acetaldehyde values (see Table 1). Noticeably, the intraday CV% of acetaldehyde values in the range 3–50 μM was comparable to that obtained in small volumes of blood (100 μL) by RP-HPLC (Kozutsumi et al., 2002).
In conclusion, we have developed an optimized RP-HPLC method for the measurement of increased acetaldehyde levels associated with alcohol consumption as a stable AcH-DNP derivative. The AcH-DNP was prepared quantitatively after sample deproteinization by using 80-fold molar excess of derivatization agent, DNPH, at optimum pH 4.0. The AcH-DNP and residual DNPH peaks were well separated in a short chromatographic run. Data show linearity up to 80 μM acetaldehyde observed under physiological conditions and a detection limit of >3 μM (S/N>3). The method is applicable to evaluating acetaldehyde levels in small volumes (70 μl) of culture media and biological fluids (blood, plasma), and useful for laboratories which do not have access to HS-GC.
Acknowledgments
This work was supported by the National Institute of Alcohol Abuse and Alcoholism (RO1 AA015421, RO1 AA16210, T32 AA007563) and the Graham Fund. We thank Dr. Rodica Niculescu for preliminary data and Dr. Weidong Liu for assistance with VA13 cell culture. Part of this work was presented at the 2009 annual meeting of the Research Society on Alcoholism, San Diego, CA.
References
- Akubue PI, Bagchi D, Ihm WJ, Stohs SJ. Excretion of malondialdehyde, formaldehyde, acetaldehyde, acetone and methyl ethyl ketone in the urine of rats given an acute dose of malondialdehyde. Arch Toxicol. 1994;68(5):338–341. doi: 10.1007/s002040050079. [DOI] [PubMed] [Google Scholar]
- Anni H, Israel Y. Characterization of adducts of ethanol metabolites with cytochrome c. Alcohol Clin Exp Res. 1999;23(1):26–37. [PubMed] [Google Scholar]
- Anni H, Pristatsky P, Israel Y. Binding of acetaldehyde to a glutathione metabolite: mass spectrometric characterization of an acetaldehyde-cysteinylglycine conjugate. Alcohol Clin Exp Res. 2003;27(10):1613–1621. doi: 10.1097/01.ALC.0000089958.65095.84. [DOI] [PubMed] [Google Scholar]
- Arolfo MP, Overstreet DH, Yao L, Fan P, Lawrence AJ, Tao G, Keung WM, Vallee BL, Olive MF, Gass JT, Rubin E, Anni H, Hodge CW, Besheer J, Zablocki J, Leung K, Blackburn BK, Lange LG, Diamond I. Suppression of heavy drinking and alcohol seeking by a selective ALDH-2 inhibitor. Alcohol Clin Exp Res. 2009;33(11):1935–1944. doi: 10.1111/j.1530-0277.2009.01031.x. [DOI] [PMC free article] [PubMed] [Google Scholar]
- Bajpai L, Soohoo D, Chu N, Mollova N, Zablocki J, Leung K. LC-MS/MS method for measuring exogenous acetaldehyde in rat blood using 13C-ethanol. AAPS J. 2007;9(S2):91, 1775. [Google Scholar]
- Barth KS, Malcolm RJ. Disulfiram: an old therapeutic with new applications. CNS Neurol Disord Drug Targets. 2010;9(1):5–12. doi: 10.2174/187152710790966678. [DOI] [PubMed] [Google Scholar]
- Bicking MKL, Cooke WM, Kawahara FK, Longbottom JE. Effect of pH on the reaction of 2,4-dinitrophenylhydrazine with formaldehyde and acetaldehyde. J Chromatogr. 1988;455:310–315. [Google Scholar]
- Brady OL, Elsmie GV. The use of 2:4-dinitrophenylhydrazine as a reagent for aldehydes and ketones. Analyst. 1926;51:77–78. [Google Scholar]
- Chen YC, Peng GS, Wang MF, Tsao TP, Yin SJ. Polymorphism of ethanol-metabolism genes and alcoholism: correlation of allelic variations with the pharmacokinetic and pharmacodynamic consequences. Chem Biol Interact. 2009;178(1–3):2–7. doi: 10.1016/j.cbi.2008.10.029. [DOI] [PubMed] [Google Scholar]
- Clemens DL, Forman A, Jerrells TR, Sorrell MF, Tuma DJ. Relationship between acetaldehyde levels and cell survival in ethanol-metabolizing hepatoma cells. Hepatology. 2002;35(5):1196–1204. doi: 10.1053/jhep.2002.32668. [DOI] [PubMed] [Google Scholar]
- Clemens DL, Halgard CM, Miles RR, Sorrell MF, Tuma DJ. Establishment of a recombinant hepatic cell line stably expressing alcohol dehydrogenase. Arch Biochem Biophys. 1995;321(2):311–318. doi: 10.1006/abbi.1995.1400. [DOI] [PubMed] [Google Scholar]
- Cotsaris E, Nicholson BC. Low level determination of formaldehyde in water by high-performance liquid chromatography. Analyst. 1993;118:265–268. [Google Scholar]
- Crabb DW, Dipple KM, Thomasson HR. Alcohol sensitivity, alcohol metabolism, risk of alcoholism, and the role of alcohol and aldehyde dehydrogenase genotypes. J Lab Clin Med. 1993;122(3):234–240. [PubMed] [Google Scholar]
- Deitrich RA, Petersen D, Vasiliou V. Removal of acetaldehyde from the body. Novartis Found Symp. 2007;285:23–40. doi: 10.1002/9780470511848.ch3. [DOI] [PubMed] [Google Scholar]
- Deng XS, Deitrich RA. Putative role of brain acetaldehyde in ethanol addiction. Curr Drug Abuse Rev. 2008;1(1):3–8. doi: 10.2174/1874473710801010003. [DOI] [PMC free article] [PubMed] [Google Scholar]
- Di Padova C, Alderman J, Lieber CS. Improved methods for the measurement of acetaldehyde concentrations in plasma and red blood cells. Alcohol Clin Exp Res. 1986;10(1):86–89. doi: 10.1111/j.1530-0277.1986.tb05621.x. [DOI] [PubMed] [Google Scholar]
- Environmental Protection Agency. Determination of carbonyl compounds by high performance liquid chromatography (HPLC), method 8315A. 1996. [Google Scholar]
- Eriksson CJ. Elevated blood acetaldehyde levels in alcoholics and their relatives: a reevaluation. Science. 1980;207(4437):1383–1384. doi: 10.1126/science.7355298. [DOI] [PubMed] [Google Scholar]
- Eriksson CJ. Human blood acetaldehyde concentration during ethanol oxidation (update 1982) Pharmacol Biochem Behav. 1983;18(S1):141–150. doi: 10.1016/0091-3057(83)90162-4. [DOI] [PubMed] [Google Scholar]
- Eriksson CJ. Measurement of acetaldehyde: what levels occur naturally and in response to alcohol? Novartis Found Symp. 2007;285:247–255. doi: 10.1002/9780470511848.ch18. [DOI] [PubMed] [Google Scholar]
- Fukunaga T, Sillanaukee P, Eriksson CJ. Problems involved in the determination of endogenous acetaldehyde in human blood. Alcohol Alcohol. 1993;28(5):535–541. [PubMed] [Google Scholar]
- Garver E, Ross AD, Tu GC, Cao QN, Zhou F, Israel Y. Paradigm to test a drug-induced aversion to ethanol. Alcohol Alcohol. 2000;35(5):435–438. doi: 10.1093/alcalc/35.5.435. [DOI] [PubMed] [Google Scholar]
- Garver E, Tu GC, Cao QN, Aini M, Zhou F, Israel Y. Eliciting the low-activity aldehyde dehydrogenase Asian phenotype by an antisense mechanism results in an aversion to ethanol. J Exp Med. 2001;194(5):571–580. doi: 10.1084/jem.194.5.571. [DOI] [PMC free article] [PubMed] [Google Scholar]
- Guan X, Anni H, Rubin E. A new method for analysis of ethanol-derived acetaldehyde in biological matrices using high-performance liquid chromatography. Alcohol Clin Exp Res. 2009;33(S1):P759(200A). [Google Scholar]
- Hamby-Mason R, Chen JJ, Schenker S, Perez A, Henderson GI. Catalase mediates acetaldehyde formation from ethanol in fetal and neonatal rat brain. Alcohol Clin Exp Res. 1997;21(6):1063–1072. [PubMed] [Google Scholar]
- Igoucheva O, Alexeev V, Anni H, Rubin E. Oligonucleotide-mediated gene targeting in human hepatocytes: implications of mismatch repair. Oligonucleotides. 2008;18(2):111–122. doi: 10.1089/oli.2008.0120. [DOI] [PMC free article] [PubMed] [Google Scholar]
- Kempter C, Zurek G, Karst U. Determination of carbonyls using liquid chromatography-mass spectrometry with atmospheric pressure chemical ionization. J Environ Monit. 1999;1:307–311. doi: 10.1039/a902766a. [DOI] [PubMed] [Google Scholar]
- Kozutsumi D, Arita M, Kawashima A, Adachi M, Takami M. An improved method for acetaldehyde determination in blood by high-performance liquid chromatography and solid-phase extraction. J Chromatogr Sci. 2002;40(9):477–482. doi: 10.1093/chromsci/40.9.477. [DOI] [PubMed] [Google Scholar]
- Lindros KO, Stowell A, Pikkarainen P, Salaspuro M. Elevated blood acetaldehyde in alcoholics with accelerated ethanol elimination. Pharmacol Biochem Behav. 1980;13(S1):119–124. doi: 10.1016/s0091-3057(80)80019-0. [DOI] [PubMed] [Google Scholar]
- Lipsky JJ, Shen ML, Naylor S. In vivo inhibition of aldehyde dehydrogenase by disulfiram. Chem Biol Interact. 2001;130–132(1–3):93–102. doi: 10.1016/s0009-2797(00)00225-8. [DOI] [PubMed] [Google Scholar]
- Lucas D, Ménez JF, Berthou F, Pennec Y, Floch HH. Determination of free acetaldehyde in blood as the dinitrophenylhydrazone derivative by high-performance liquid chromatography. J Chromatogr. 1986;382:57–66. doi: 10.1016/s0378-4347(00)83504-5. [DOI] [PubMed] [Google Scholar]
- Lynch C, Lim CK, Thomas M, Peters TJ. Assay of blood and tissue aldehydes by HPLC analysis of their 2,4-dinitrophenylhydrazine adducts. Clin Chim Acta. 1983;130(1):117–122. doi: 10.1016/0009-8981(83)90265-6. [DOI] [PubMed] [Google Scholar]
- Ma W, Klemm WR. Determination of acetaldehyde in blood by solid phase extraction and high performance liquid chromatography. Alcohol. 1997;14(5):469–472. doi: 10.1016/s0741-8329(96)00214-5. [DOI] [PubMed] [Google Scholar]
- Matthewson K, Al Mardini H, Bartlett K, Record CO. Impaired acetaldehyde metabolism in patients with non-alcoholic liver disorders. Gut. 1986;27(7):756–764. doi: 10.1136/gut.27.7.756. [DOI] [PMC free article] [PubMed] [Google Scholar]
- Moncada C, Fuentes N, Lladser A, Encina G, Sapag A, Karahanian E, Israel Y. Use of an “acetaldehyde clamp” in the determination of low-KM aldehyde dehydrogenase activity in H4-II-E-C3 rat hepatoma cells. Alcohol. 2003;31(1–2):19–24. doi: 10.1016/j.alcohol.2003.06.004. [DOI] [PubMed] [Google Scholar]
- Nagy K, Pollreisz F, Takáts Z, Vékey K. Atmospheric pressure chemical ionization mass spectrometry of aldehydes in biological matrices. Rapid Commun Mass Spectrom. 2004;18(20):2473–2478. doi: 10.1002/rcm.1648. [DOI] [PubMed] [Google Scholar]
- Peters R, Hellenbrand J, Mengerink Y, Van der Wal S. On-line determination of carboxylic acids, aldehydes and ketones by high-performance liquid chromatography-diode array detection-atmospheric pressure chemical ionization mass spectrometry after derivatization with 2-nitrophenylhydrazine. J Chromatogr A. 2004;1031:35–50. doi: 10.1016/j.chroma.2003.10.100. [DOI] [PubMed] [Google Scholar]
- Portari GV, Marchini JS, Jordão AA. Validation of a manual headspace gas chromatography method for determining volatile compounds in biological fluids. Lab Med. 2008;39(1):42–45. [Google Scholar]
- Pötter W, Karst U. Identification of chemical interferences in aldehyde and ketone determination using dual-wavelength detection. Anal Chem. 1996;68(19):3354–3358. doi: 10.1021/ac960319v. [DOI] [PubMed] [Google Scholar]
- Preedy VR, Crabb DW, Farrés J, Emery PW. Alcoholic myopathy and acetaldehyde. Novartis Found Symp. 2007;285:158–177. doi: 10.1002/9780470511848.ch12. [DOI] [PubMed] [Google Scholar]
- Quertemont E, Didone V. Role of acetaldehyde in mediating the pharmacological and behavioral effects of alcohol. Alcohol Res Health. 2006;29(4):258–265. [PMC free article] [PubMed] [Google Scholar]
- Ren J. Acetaldehyde and alcoholic cardiomyopathy: lessons from the ADH and ALDH2 transgenic models. Novartis Found Symp. 2007;285:69–76. doi: 10.1002/9780470511848.ch5. [DOI] [PubMed] [Google Scholar]
- Rouach H, Andraud E, Aufrère G, Beaugé F. The effects of acetaldehyde in vitro on proteasome activities and its potential involvement after alcoholization of rats by inhalation of ethanol vapours. Alcohol Alcohol. 2005;40(5):359–366. doi: 10.1093/alcalc/agh174. [DOI] [PubMed] [Google Scholar]
- Saczk AA, Okumura LL, De Oliveira MF, Zanoni MV, Stradiotto NR. Determination of acetaldehyde in fuel ethanol by high-performance liquid chromatography with electrochemical detection. Anal Sci. 2005;21(4):441–444. doi: 10.2116/analsci.21.441. [DOI] [PubMed] [Google Scholar]
- Salaspuro M. Interrelationship between alcohol, smoking, acetaldehyde and cancer. Novartis Found Symp. 2007;285:80–89. doi: 10.1002/9780470511848.ch6. [DOI] [PubMed] [Google Scholar]
- Seitz HK, Stickel F. Acetaldehyde as an underestimated risk factor for cancer development: role of genetics in ethanol metabolism. Genes Nutr. 2010;5:121–128. doi: 10.1007/s12263-009-0154-1. [DOI] [PMC free article] [PubMed] [Google Scholar]
- Uchiyama S, Ando M, Aoyagi S. Isomerization of aldehyde-2,4-dinitrophenylhydrazone derivatives and validation of high-performance liquid chromatographic analysis. J Chromatogr A. 2003;996:95–102. doi: 10.1016/s0021-9673(03)00542-9. [DOI] [PubMed] [Google Scholar]
- Vogel M, Büldt A, Karst U. Hydrazine reagents as derivatizing agents in environmental analysis - a critical review. Fresenius J Anal Chem. 2000;366:781–791. doi: 10.1007/s002160051572. [DOI] [PubMed] [Google Scholar]
- van Leeuwen SM, Hendriksen L, Karst U. Determination of aldehydes and ketones using derivatization with 2,4-dinitrophenylhydrazine and liquid chromatography-atmospheric pressure photoionization–mass spectrometry. J Chromatogr A. 2004;1058:107–112. doi: 10.1016/j.chroma.2004.08.149. [DOI] [PubMed] [Google Scholar]
- Wu H, Cai P, Clemens DL, Jerrells TR, Ansari GA, Kaphalia BS. Metabolic basis of ethanol-induced cytotoxicity in recombinant HepG2 cells: role of nonoxidative metabolism. Toxicol Appl Pharmacol. 2006;216(2):238–247. doi: 10.1016/j.taap.2006.05.003. [DOI] [PubMed] [Google Scholar]
- Yoshida A, Rzhetsky A, Hsu LC, Chang C. Human aldehyde dehydrogenase gene family. Eur J Biochem. 1998;251(3):549–557. doi: 10.1046/j.1432-1327.1998.2510549.x. [DOI] [PubMed] [Google Scholar]
- You J, Yan T, Zhao H, Sun Z, Xia L, Suo Y, Li Y. A sensitive fluorescence reagent for the determination of aldehydes from alcoholic beverage using high-performance liquid chromatography with fluorescence detection and mass spectrometric identification. Anal Chim Acta. 2009;636(1):95–104. doi: 10.1016/j.aca.2009.01.036. [DOI] [PubMed] [Google Scholar]
- Zhang HJ, Huang JF, Wang H, Feng YQ. Determination of low-aliphatic aldehyde derivatizatives in human saliva using polymer monolith microextraction coupled to high-performance liquid chromatography. Anal Chim Acta. 2006;565(2):129–135. [Google Scholar]