

Abstract
The principal neurons of the striatum, GABAergic medium spiny neurons (MSNs), are interconnected by local recurrent axon collateral synapses. Although critical to many striatal models, it is not clear whether these connections are random or whether they preferentially link functionally related groups of MSNs. To address this issue, dual whole patch-clamp recordings were made from striatal MSNs in brain slices taken from transgenic mice in which D1 or D2 dopamine receptor expression was reported with EGFP (enhanced green fluorescent protein). These studies revealed that unidirectional connections were common between both D1 receptor-expressing MSN (D1 MSN) pairs (26%) and D2 receptor-expressing MSN (D2 MSN) pairs (36%). D2 MSNs also commonly formed synapses on D1 MSNs (27% of pairs). Conversely, only 6% of the D1 MSNs formed detectable connections with D2 MSNs. Furthermore, synaptic connections formed by D1 MSNs were weaker than those formed by D2 MSNs, a difference that was attributable to fewer GABAA receptors at D1 MSN synapses. The strength of detectable recurrent connections was dramatically reduced in Parkinson's disease models. The studies demonstrate that recurrent collateral connections between MSNs are not random but rather differentially couple D1 and D2 MSNs. Moreover, this recurrent collateral network appears to be disrupted in Parkinson's disease models, potentially contributing to pathological alterations in MSN activity patterns and psychomotor symptoms.
Keywords: striatum, GABA, medium spiny neurons, lateral inhibition, patch clamp, Parkinson's disease
Introduction
The principal neurons of the striatum are GABAergic medium spiny neurons (MSNs) (Kemp and Powell, 1971; Kitai, 1981; Chang and Kitai, 1985). The axons of MSNs have collateral branches that form synapses on neighboring cells (Wilson and Groves, 1980; Somogyi et al., 1982; Bolam et al., 1983). From a theoretical perspective, recurrent collateral connections are common features of neural network models, endowing them with computational and learning capacities (Churchill and Sejnowski, 1992). Recent work has shown that MSN collaterals give rise to synapses that generate small but potentially important postsynaptic, GABAA receptor-mediated currents (Czubayko and Plenz, 2002; Tunstall et al., 2002; Koos et al., 2004; Taverna et al., 2004, 2005; Venance et al., 2004; Gustafson et al., 2006; Tecuapetla et al., 2007).
A major factor in determining the network consequences of feedback inhibition is the rule by which different neuronal populations are linked. In both the dorsal and ventral striatum, the best-characterized subdivision that is likely to be of importance for recurrent collaterals is based on dopamine (DA) receptor expression. In the dorsal striatum, D1 receptor expression is largely limited to MSNs having axonal projections to the substantia nigra, whereas D2 receptors are expressed by MSNs projecting to the globus pallidus (Gerfen and Young, 1988; Surmeier and Kitai, 1994). In the ventral striatum (or nucleus accumbens), there is a similar organization, with ventral tegmental area and ventral pallidum as the major targets of D1 and D2 MSNs, respectively (Lu et al., 1998).
Studies to date have found little evidence for specificity in the connections between these MSN populations. Using immunoreactivity for substance P and enkephalin as surrogate markers of D1 and D2 receptor expression, respectively, anatomical studies have inferred that D1 and D2 MSNs are interconnected by collaterals (Bolam et al., 1983; Yung et al., 1996). Although valuable, these approaches are not quantitative and do not provide a physiological measure of synaptic function. This level of measurement has been difficult to achieve, however, because it has required paired MSN recording and cellular phenotyping with demanding technologies such as single-cell reverse transcription (RT)-PCR (Tkatch et al., 2000). The advent of transgenic mice in which D1 and D2 receptor-expressing MSNs are labeled with enhanced green fluorescent protein (EGFP) has made the phenotyping issue readily surmountable (Gong et al., 2003; Day et al., 2006). Taking advantage of these mice, the studies reported here show that MSN recurrent collaterals are not randomly distributed. Rather, D1 receptor-expressing MSNs (D1 MSNs) form functional connections primarily with other D1 MSNs, whereas D2 receptor-expressing MSNs (D2 MSNs) form recurrent connections with both D2 and D1 MSNs. Moreover, synapses formed by D1 MSNs appear to have significantly smaller numbers of GABAA receptors than do those formed by D2 MSNs, further reducing their functional significance. Last, in models of Parkinson's disease (PD), there appears to be a profound downregulation of these connections.
Materials and Methods
Slice preparation.
Slices were obtained from FVB mice [postnatal day 16 (P16)–P31] in which bacterial artificial chromosome vectors (BACs) were used to genetically target expression of the EGFP gene under control of either the D1 or D2 receptor promoter (Gong et al., 2003). All animals were handled in accord with Northwestern University Center for Comparative Medicine and National Institutes of Health guidelines. Animals were anesthetized with isoflurane and decapitated. The brains were quickly removed from the skull in ice-cold artificial CSF (ACSF) containing the following (in mm): 125 NaCl, 25 NaHCO3, 2.5 KCl, 1.25 NaH2PO4, 2 CaCl2, 1 MgCl2, and 25 glucose, pH 7.4 (bubbled with 95% O2 and 5% CO2). Parasagittal striatal slices (300 μm thick) were cut using a vibratome (VT100; Leica) and stored in ACSF at 25–28°C. For recording, slices were transferred to a recording chamber continuously superfused with ACSF (1–2 ml/min at 30–32°C). To block AMPA receptor-mediated currents, 5 μm NBQX was added before the experiment.
Fluorescence imaging.
EGFP was excited by an arc lamp (X-Cite 120; EXFO) attached to the epifluorescence port of an Axioscop FS plus microscope (Zeiss). Light was filtered by a 470/40× bandpass filter and reflected by a Q495LP dichroic mirror (Chroma Technology). D1 or D2 MSNs were visually identified by EGFP fluorescence passed through an HQ525/50m bandpass filter. Mixed pairs made by one D1 and one D2 cell were recorded after visually selecting one fluorescent and one nonfluorescent cell in slices from BAC D2 mice. Previous experiments using single-cell PCR have shown that MSN EGFP expression in the D1/D2 BAC transgenic mice is tightly linked to the expected expression of D1 or D2 receptor mRNAs, as well as the associated peptide mRNAs (Day et al., 2006; Wang et al., 2006). Nonfluorescent MSNs consistently were of the complementary phenotype in single-cell RT-PCR experiments. The strength of EGFP expression was greater in D2 BAC mice, making the task of identifying negative neurons easier. As a consequence, these mice, rather than D1 BAC mice, were used for mixed-pair recordings.
Electrophysiology.
Recordings were made from both the ventral and dorsal striatum. These two samples were approximately equal in number. There were no apparent differences in the connectivity of MSNs or in synaptic properties in these two regions, so data were pooled. MSNs sampled were 25–100 μm from the surface of the slice to facilitate paired recordings. Pairs always had cell bodies that were similar in depth (near the same focal plane) in an attempt to minimize the probability that the local axon collateral of one or the other cell was cut. After choosing a given pair of cells (lateral distance between somata, ≤50 μm), the microscope illumination was switched to differential interference contrast mode, and simultaneous dual whole-cell recordings were performed in both current- and voltage-clamp configurations (holding potential, −80 mV). Signals were sampled at 10 kHz, filtered at 2 kHz, and acquired using a MultiClamp 700A amplifier and pClamp 10 software (Molecular Devices). Recording pipettes (3–5 MΩ in bath) contained the following solution (in mm): 30 KH2PO4, 100 KCl, 10 NaCl, 2 MgCl2, 0.5 EGTA, 10 HEPES, 2 Na2-ATP, 0.03 Na-GTP, and 8 biocytin (pH 7.2, adjusted with KOH). Because the reversal potential for Cl− ions was −4 mV with this solution, GABAergic currents recorded at −80 mV were inward. Series resistance was partially compensated (20–40%).
Synaptic connections were first detected in current-clamp mode by stimulating one cell through injection of a rectangular depolarizing current step (100–300 pA, 1 s) and observing the occurrence in the other cell of depolarizing postsynaptic potentials (dPSPs) that were time locked with presynaptic action potentials. The protocol was also repeated in reversed order. In voltage-clamp mode, unitary IPSCs were recorded in response to individual action potentials elicited by brief suprathreshold current steps (10 ms, 500–600 pA). Series and input resistance were constantly monitored by detecting the stability of current responses to brief voltage pulses (−10 mV, 100 ms). Cells that displayed unstable series and input resistance and/or changes in leak were discarded. Failures were defined as postsynaptic responses that, in a 20 ms time window after the action potential peak, were smaller than three times the SD of the baseline noise average.
Nonstationary noise analysis.
IPSCs selected for the analysis had a smooth, fast rising phase (<1 ms) and exponential decay phase. For each MSN pair, IPSCs (40–120) were aligned to the midpoint of the rising phase and averaged. The mean IPSC was scaled to the peak of each trace, and difference currents were computed; these difference currents were then used to estimate current variance during the decay phase of the IPSC. Plots of current variance as a function of mean IPSC current were well fit with the following parabolic equation: y = iI − I 2/N + σB, where i is the single-channel current, I is the mean macroscopic current, N is the number of receptors open at the peak of the IPSC, and σB is the baseline variance (Sigworth, 1980; De Koninck and Mody, 1997; Traynelis and Jaramillo, 1998). The single-channel conductance was calculated by dividing i by the driving force for Cl− ions (76 mV in our experimental conditions).
Reserpine treatment.
FVB mice (D1 or D2 BACs, P18–P21) were injected with reserpine (5 mg/kg, dissolved in PBS added with 0.5% glacial acetic acid) intraperitoneally for 4 successive days. Each mouse received 1 injection/d. By the second day, animals displayed typical parkinsonian-like symptoms induced by reserpine (bradykinesia, posture stiffness, and tremor). Manual feeding was performed after the first day of treatment. Control animals were injected with an equal amount of dissolving solution (vehicle). Control and reserpine-treated animals were killed 18–24 h after the last injection.
6-OHDA lesions.
FVB mice (D1 or D2 BACs, P20) were anesthetized with a mixture of ketamine (50 mg/kg, i.p.) and xylazine (4.5 mg/kg, i.p.). Thirty minutes before 6-OHDA injection, animals were injected intraperitoneally with desipramine (25 mg/kg) dissolved in 0.9% NaCl. After immobilization on a stereotaxic frame (model 940; David Kopf Instruments) with a Cunningham adaptor (Harvard Apparatus), a hole was drilled (∼1 mm diameter) at 0.7 mm posterior and 1.1 mm lateral to bregma for injection into the medial forebrain bundle.
Each animal received a unilateral injection of 1 μl of 6-OHDA (3 μg/μl in 0.9% sterile NaCl + 0.02% ascorbic acid) into the left medial forebrain bundle (4.8 mm below the dura) (Paxinos and Franklin, 2001). 6-OHDA injections were made over a 30 min period using a calibrated glass micropipette (2-000-00; Drummond Scientific). At the end of each injection, the micropipette was left in place for an additional 15 min to maximize tissue retention of the solution, and was then withdrawn slowly to prevent reflux. Animals were killed 6–7 d after surgery for electrophysiological study.
Histochemistry.
Slices were fixed in 4% paraformaldehyde for 1 h at room temperature. After rinsing in PBS, slices were incubated with NeutrAvidin–Texas Red conjugate (1–2 mg/ml; Invitrogen) for 3 h at room temperature. After rinse in PBS, slices were mounted with Vectashield (Vector Laboratories) and viewed under a Nikon Eclipse 800 microscope (Nikon Instech). Images were acquired using a Nikon PCM 2000 laser-scanning confocal microscope and processed with Adobe Photoshop CS2 (Adobe Systems) to adjust contrast and brightness.
All drugs were obtained from Sigma except NBQX (Tocris). Data were analyzed using Clampfit 9 (Molecular Devices), Origin 6 (Microcal) and IgorPro (WaveMetrics). Nonstationary noise analysis was performed by using WinWCP 3.8.1 (kindly provided by Dr. J. Dempster, University of Strathclyde, Glasgow, UK). For statistical analysis, the Mann–Whitney rank sum test was used for small samples (n <10) and the Student's t test for larger samples (SigmaStat; Systat Software). Connectivity rates were analyzed with a χ2 test. Results are given as medians or means ± SEM.
Results
Identification of D1 and D2 MSNs
In tissue slices from BAC mice, fluorescent striatal neurons were selected for analysis when they displayed typical anatomical and electrophysiological features of MSNs (Wilson, 1993) (Fig. 1). Postrecording staining of biocytin-filled neurons consistently revealed them to have morphology typical of MSNs. D1 and D2 MSNs had similar resting membrane potentials (D1, −81 ± 1 mV; n = 60; D2, −81 ± 1 mV; n = 60; p > 0.05, unpaired t test), input resistances (D1, 238 ± 14 MΩ; n = 60; D2, 231 ± 25 MΩ; n = 60; p > 0.05, unpaired t test) and firing patterns. There was a tendency for D2 MSNs to spike at higher rates than D1 MSNs in response to a given level of intrasomatic current injection, as described by Kreitzer and Malenka (2007). However, this issue was not pursued.
Figure 1.

Properties of D1 and D2 MSNs. A, Anatomical reconstruction of a pair of synaptically connected MSNs. Shown is a confocal microscope image taken after biocytin staining, revealing no major morphological differences. Note the EGFP-positive cells in the background (green), in this case D2 MSNs. B, Current-clamp recordings showing voltage responses to step current injections (1 s) at various amplitudes. Subthreshold responses and firing patterns were not markedly different in D1 and D2 cells.
D1 and D2 MSNs are not randomly coupled
Dual patch-clamp recordings were performed on a total of 105 MSN pairs. All recordings were performed in the presence of the AMPA receptor antagonist NBQX (5 μm). As in previous studies (Taverna et al., 2004, 2005), GABAergic connections were found in approximately one-third (35 of 105) of the pairs, and these connections were almost invariably unidirectional, not reciprocal. Connections were found in 5 of the 19 (26%) D1 MSN pairs. The coupling percentage was higher between D2 MSNs (36%, 14 of the 39). In pairs in which one cell was a D2 MSN and one was a D1 MSN, synaptic connections were found in 16 of 47 (34%) cases. However, the coupling was asymmetric: in the vast majority of these pairs, the D2 MSN was presynaptic to the D1 MSN (13 of 16, 81%) (Fig. 2 B). Overall, the rate of connectivity was significantly higher in pairs in which the presynaptic cell was a D2 MSN, rather than a D1 MSN (27 of 86 vs 8 of 66; p < 0.05, χ2 test; note that the sum of these samples is >105 because mixed pairs were counted in each group). We did not notice a gross variation across different preparations. A different percentage of pair connectivity could be detected from day to day, but this would not substantially deviate from the average.
Figure 2.
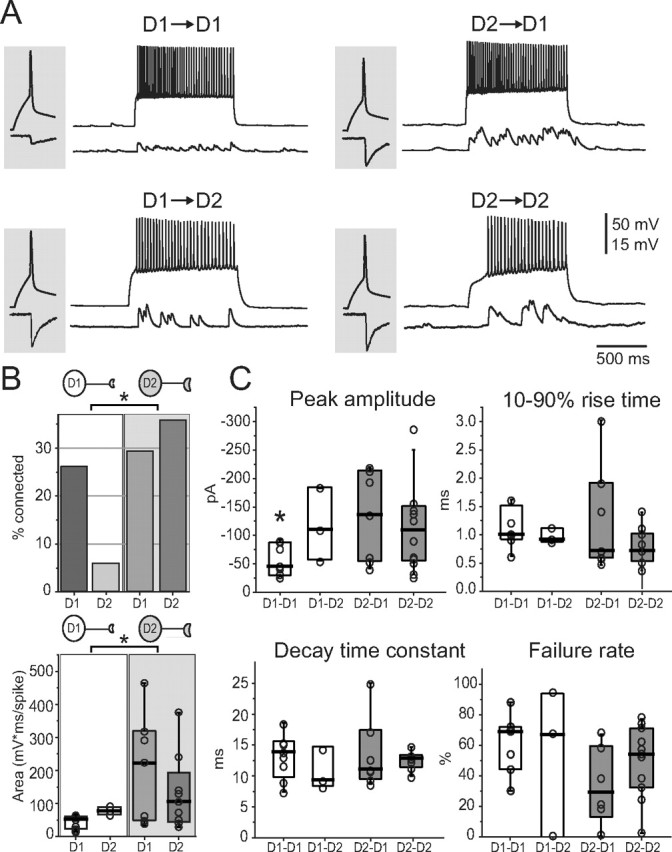
D2 MSN-mediated IPSCs are stronger and more numerous than those mediated by D1 MSN. A, Examples of recordings of synaptically connected pairs. The pair composition is indicated on top of each pair of traces. Gray-shaded insets represent individual IPSCs (bottom) in response to single action potentials (top). B, Top, Summary of the percentages of unidirectional connectivity of the four pair types. Columns related to pairs with a presynaptic D1 or D2 MSN are included in white and gray areas, respectively. Top drawings indicate the presynaptic cell. Bottom, The strength of connectivity, calculated as the area under the dPSP train and normalized by presynaptic firing frequency, is larger in pairs in which the presynaptic cell is a D2 MSN. C, Summary of unitary IPSC properties across different pairs. *p < 0.05.
In addition to coupling probability, the apparent strength of the synaptic connection between MSNs was dependent on cell type. The GABAergic dPSPs evoked by driving the presynaptic MSN with intrasomatic current varied considerably between different pairs. To quantify the synaptic responses in current-clamp recordings, the dPSPs evoked by presynaptic spiking were integrated. To correct for variation in the presynaptic spike rate (16–42 Hz), the integral was normalized by the number of spikes in the presynaptic train. When the presynaptic cell was a D2 MSN, the postsynaptic responses were consistently larger than when a D1 MSN was the presynaptic cell (Fig. 2 A,B). The median area was 117 mV · ms/spike for D2 MSN pairs (n = 8) and 223 mV · ms/spike for D2 MSN/D1 MSN pairs (n = 8). In contrast, the median area of the synaptic response between D1 MSN pairs was only 55 mV · ms/spike (n = 8). This value was significantly different from that of D2–D2 pairs (p < 0.05, Mann–Whitney rank sum test). In those rare cases when a D1 MSN made a synaptic connection with a D2 MSN, the median area was also small (78 mV · ms/spike; n = 3). Overall, there was a significant difference between the median pooled areas calculated in pairs with a presynaptic D1 MSN versus pairs with a presynaptic D2 MSN (59 mV · ms/spike and 129 mV · ms/spike, respectively; p < 0.05, Mann–Whitney rank sum test) (Fig. 2 B).
GABAergic D2 MSN IPSCs are larger than those of D1 MSNs
To better characterize the synaptic connections, unitary IPSCs were studied by triggering a single action potential in the presynaptic neuron while holding the somatic membrane potential of the postsynaptic neuron at −80 mV (Fig. 2 A). The median amplitude of the IPSCs evoked by D1 MSNs in D1 MSNs was significantly smaller than that of IPSCs evoked by D1 MSNs in D2 MSNs, or by D2 MSNs in either D1 or D2 MSNs (medians, −42 pA; n = 8; −107 pA; n = 3; −133; n = 7; and −107 pA; n = 10, respectively; p < 0.05, Mann–Whitney rank sum test). In contrast, IPSC rise times, decay time constants, and failure rates were not significantly correlated with cell type (Fig. 2 C).
In principle, the variation in IPSC size could be attributable to differences in the number of postsynaptic GABAA receptors activated or the conductance of the receptors. To address this issue, nonstationary noise analysis of IPSCs was performed (Fig. 3). Given the small sample size, we did not include the D1–D2 pairs in this analysis. The estimated single-channel conductance was similar for all groups (medians, D1 MSN pairs, 23 pS; n = 6; D2 MSN pairs, 24 pS; n = 7; D2 MSN to D1 MSN pairs, 24 pS; n = 6; p > 0.05, Mann–Whitney rank sum test). However, the estimated number of postsynaptic receptors (N) was significantly smaller at synapses formed between D1 MSNs (36; n = 6) than at synapses formed either between D2 MSNs (74; n = 7) or at synapses of D2 MSNs formed on D1 MSNs (77; n = 6; p < 0.05, Mann–Whitney rank sum test). These results clearly suggest that the relative strength of GABAergic synapses formed by D2 MSNs onto either D2 or D1 MSNs is attributable to receptor number, not to differences in receptor conductance.
Figure 3.
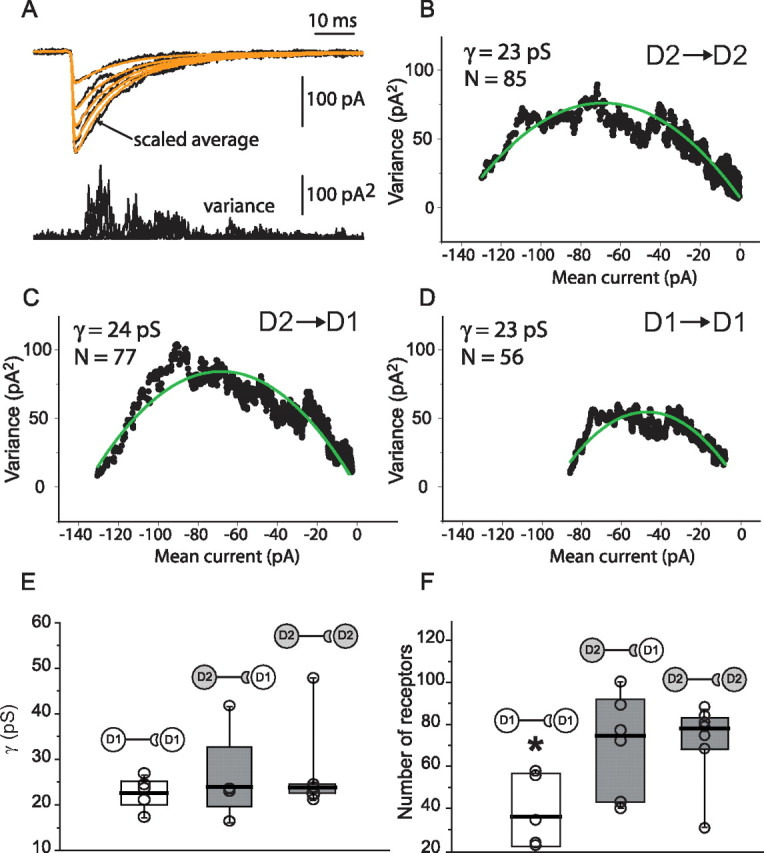
Synaptic contacts made by D2 MSN target a larger number of GABA receptors than those made by D1 MSN. A, Example of unitary IPSCs selected for nonstationary noise analysis. Smooth lines represent scale averages used to calculate variances. B–D, Representative mean–variance plots for three types of pairs. Single-channel conductance (γ) and number of receptors (N) for these pairs are indicated. E, F, Summary plots illustrating average values of γ and N. *p < 0.05.
To further characterize the differences between these synapses, vesicular release probability was elevated by increasing the Ca2+/Mg2+ concentration ratio in the extracellular space (Silver et al., 1996). In 3 mm Ca2+/0.5 mm Mg2+, the median D2–D2 IPSC peak amplitude was −172 pA (n = 5), 61% larger than in 2 mm Ca2+/1 mm Mg2+ (−107 pA; n = 8; p < 0.05, Mann–Whitney rank sum test) (Fig. 4). Elevating Ca2+ also reduced the failure rate by 35% (medians, 55% in 2 mm Ca2+ vs 36% in 3 mm Ca2+; p < 0.05) and the coefficient of variation (CV) by 43% (0.41 in 2 mm Ca2+ vs 0.23 in 3 mm Ca2+; p < 0.05) (Fig. 4). Elevating Ca2+ also decreased the IPSC rise time (10–90%) by 43% (from 0.7 ms in 2 mm Ca2+ to 0.4 ms in 3 mm Ca2+; p < 0.05), whereas the decay time constant was similar in the two conditions (12 vs 9 ms; p > 0.05). These results suggest that receptors at D2 MSN synapses are not saturated normally and that increasing GABA release activates more receptors in D2–D2 MSN pairs. Indeed, nonstationary noise analysis suggested that the number of activated receptors in 3 mm Ca2+ was 35% more than in 2 mm Ca2+ (medians, 105; n = 4; 78; n = 7; p < 0.05). Conversely, the median unitary conductance was not significantly different in the two conditions (24 pS vs 26 pS; p > 0.05) (Fig. 4).
Figure 4.
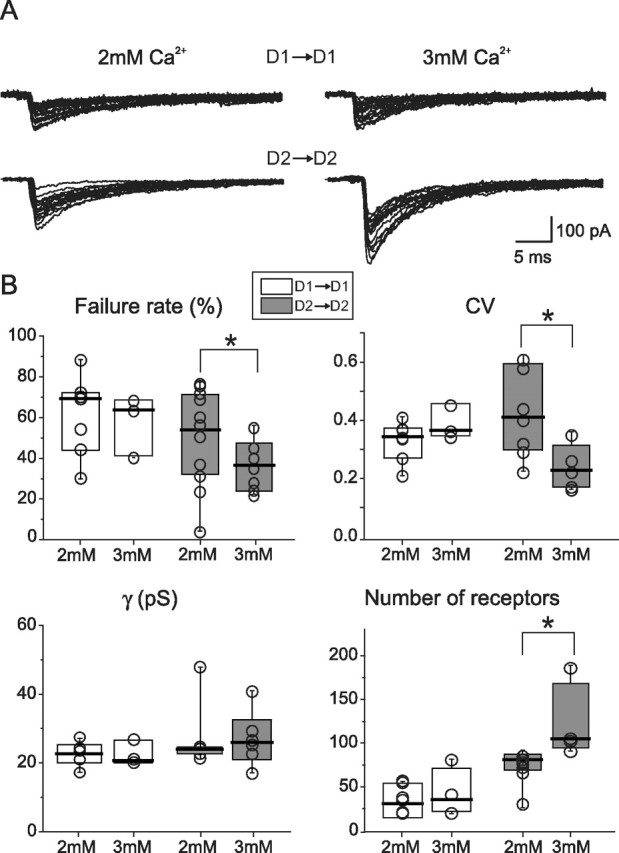
Increased release probability reveals unsaturated synapses in D2–D2 but not D1–D1 pairs. A, Representative traces for the two pair types in two different extracellular Ca2+ concentrations. B, Summary plots for failure rate, CV, single-channel conductance (γ), and number of receptors in low and high extracellular Ca2+. *p < 0.05.
Interestingly, D1–D1 MSN synapses were not significantly affected by elevating GABA release probability. The median peak IPSC amplitude in 3 mm Ca2+ was −83 pA (n = 4), not significantly different from that found in control condition (−42 pA; n = 8; p > 0.1) (Fig. 4). Similarly, the failure rate was not significantly reduced (control, 69%; 3 mm Ca2+, 63%; p > 0.1), nor was the CV (control, 0.35; 3 mm Ca2+, 0.37; p > 0.1). Last, neither the number of open receptors (control, 38; 3 mm Ca2+, 42; p > 0.1), nor the single-channel conductance (control, 23 pS; 3 mm Ca2+, 21 pS; p > 0.1) was changed by elevating extracellular Ca2+ concentration and release probability.
Together, these data suggest that the synapses formed by D1 MSNs are characterized by a relatively small number of receptors, which tend to be saturated under normal conditions of neurotransmitter release. Conversely, synapses between D2 MSNs have larger number of receptors that are not normally saturated.
Diminished collateral connectivity in models of PD
In animal models of PD, the synaptic connectivity of MSNs changes in parallel with alterations in intrinsic excitability (Day et al., 2006). In addition, there are profound alterations in the activity of nuclei controlled by MSNs (Bevan et al., 2002), suggesting that alterations in the pattern or synchrony of MSN spiking could be of importance to the emergence of pathophysiology. One obvious way in which correlated activity could be controlled in the striatum is through recurrent collateral connections. To explore the possibility that these connections are altered in PD, MSN pairs were examined after depleting striatal dopamine in one of two ways.
The first strategy used was to administer reserpine for 4 successive days to deplete vesicular DA stores (Carlsson et al., 1957). This regimen renders animals parkinsonian and produces a profound loss of spines in striatopallidal D2 MSNs (Day et al., 2006). D1–D1, D2–D1, and D2–D2 MSN pairs were then examined in dorsal striatal slices from these animals. In D2–D2 MSN pairs (Fig. 5), connections were less frequently detected after DA depletion (28%; n = 5 of 18) than in saline-injected controls (44%; n = 4 of 9). Second, the average IPSC amplitude was significantly smaller (vehicle control, −80 pA; n = 4; reserpine, −23 pA; n = 5; p < 0.05). Third, the failure rate rose after reserpine treatment (vehicle controls, 56%; n = 4; reserpine, 82%; n = 5; p < 0.05). Last, a train of presynaptic action potentials elicited only intermittent, small-amplitude dPSPs (control area, 143 mV · ms; n = 4; reserpine area, 9 mV · ms; n = 5; p < 0.05) (Fig. 5 B). Conversely, IPSC kinetics were not altered by reserpine treatment (vehicle control, 10–90%; rise time, 1 ms; n = 4; reserpine, 1 ± 0.3 ms; n = 4; p > 0.1; decay time constant, vehicle controls, 11 ms; n = 4; reserpine, 9 ms; n = 4; p > 0.1, Mann–Whitney rank sum test).
Figure 5.

Lateral GABAergic connectivity is severely impaired in D2 MSNs from reserpine-treated mice. A, Left, Examples of unitary IPSCs elicited by a presynaptic action potential. Right, Trains of dPSPs in response to presynaptic firing during injection of a 1 s current step. B, Summary plots for different properties of D2–D2 pairs recorded in slices from mice injected with vehicle (Ctrl) and reserpine (Res). *p < 0.05.
In recordings from D1–D1 MSNs pairs, no connections were detected after reserpine treatment (n = 8) (Fig. 6 A). Repetitive stimulation of the presynaptic MSN failed to uncover any functional connection (Fig. 6 B). On the other hand, connectivity was intact in vehicle-treated controls (43%; n = 3 of 7). Similarly, in recordings from D2–D1 MSN pairs after reserpine treatment, a synaptic connection was found in only one of 10 pairs (data not shown). This lack of connectivity precluded statistical analysis, but in this one pair the median unitary IPSC amplitude was small (−50 pA), and the failure rate was high (83%), corroborating the conclusion that DA depletion attenuates collateral GABAergic synaptic connections.
Figure 6.

Lateral GABAergic connectivity is severely impaired in D1 MSNs from reserpine-treated mice. A, Left, examples of unitary IPSCs elicited by a presynaptic action potential. Right, Trains of dPSPs in response to presynaptic firing during injection of a 1 s current step. B, Summary plots for different properties of D1–D1 pairs recorded in slices from mice injected with vehicle (Ctrl) and reserpine (Res). *p < 0.05.
Finally, short-term reserpine treatment did not induce major changes in intrinsic properties (firing pattern, input resistance, and resting membrane potential) of either D1 or D2 MSNs (data not shown).
Although reserpine treatment reliably reduces dopaminergic synaptic transmission, it also depletes other monoamines, raising the possibility that the effects on connectivity are not solely dependent on DA depletion. Therefore, paired recordings also were made from mice unilaterally lesioned by a 6-OHDA injection into the medial forebrain bundle. One week after lesioning, mice were subjected to a limb asymmetry test to confirm the magnitude of the depletion before proceeding to electrophysiological study. Lesions induced a clear asymmetry in both turning behavior (26 ipsiversive vs 1 contraversive turns; n = 8 mice; p < 0.05, Mann–Whitney rank sum test) and paw lifting (25 ipsilateral vs 1 contralateral; n = 8 mice; p < 0.05, Mann–Whitney rank sum test), suggesting that lesions of the dopaminergic innervation of the ipsilateral striatum were near complete (Schwarting and Huston, 1996). Histological analysis of a subset of the striata from these mice confirmed the almost complete loss of tyrosine hydroxylase staining in mice displaying this level of behavioral impairment (data not shown).
As with reserpine treatment, 6-OHDA lesions dramatically reduced detectable GABAergic connections between MSNs (Fig. 7). IPSCs were detected in only 18% of D2–D2 pairs (3 of 17). In these few connected pairs, the number of IPSC failures was significantly higher than in intact animals (medians, 6-OHDA, 88%; unlesioned, 54%; n = 3 and 10, respectively; p < 0.05, Mann–Whitney rank sum test). The median area under the dPSP trace during a train of presynaptic action potentials was 2 mV · ms/spike in 6-OHDA (n = 3), significantly less than the area in the unlesioned condition (117 mV · ms/spike; n = 10; p < 0.05, Mann–Whitney rank sum test). Although the median IPSC amplitude was smaller in connected pairs from 6-OHDA-lesioned animals (−67 pA; n = 3; unlesioned median, −107 pA; n = 10), the small sample size precluded a reliable statistical analysis. Median rise time and decay time constant were not significantly different in the two conditions (rise time, 6-OHDA, 1 ms; unlesioned, 0.8 ms; p > 0.1; decay time constant, 6-OHDA, 10 ms; unlesioned, 13 ms; p > 0.1, Mann–Whitney rank sum test). The proportion of D2–D1 pairs having detectable connections after 6-OHDA lesions (3 of 12, 25%) was similar to that found in control conditions (13 of 47, 27%) (Fig. 7). However, unitary IPSC median amplitude, percentage of failures, and normalized dPSP area were significantly different from control (−33 vs −133 pA; 86 vs 29%; 31 vs 223 mV · ms/spike, respectively; p < 0.05, Mann–Whitney rank sum test). Last, as after reserpine treatment, no functional connections (0 of 7 pairs) were found between D1–D1 MSNs after 6-OHDA lesions (Fig. 7).
Figure 7.

Impairment of GABAergic connectivity in 6-OHDA-lesioned mice. A, Representative current-clamp traces from D2–D2, D2–D1, and D1–D1 pairs. B, Summary plots for different properties of these pairs. Here, median values from 6-OHDA-lesioned mice (columns) are compared with median values from unlesioned mice (horizontal bars on top of shaded areas), which are the same as those shown in Figure 2. *p < 0.05.
Together, these data show that depletion of striatal DA, induced either by reserpine or by 6-OHDA lesioning of DA fibers, causes a profound impairment of functional GABAergic connectivity between both D1 and D2 MSNs.
Discussion
Using paired patch-clamp recordings from neighboring MSNs in brain slices, several groups have shown that MSNs are coupled by recurrent collaterals (Czubayko and Plenz, 2002; Tunstall et al., 2002; Koos et al., 2004; Taverna et al., 2004; Venance et al., 2004; Gustafson et al., 2006; Tecuapetla et al., 2007). Our studies have extended these results, providing evidence for three novel conclusions. First, the synapses formed by recurrent collateral axons of MSNs are not random. Rather, D2 MSNs make synaptic connections both with other D2 MSNs and with D1 MSNs, whereas D1 MSNs almost exclusively form synaptic connections with other D1 MSNs. Second, the synapses formed by presynaptic D2 MSNs have a relatively large postsynaptic GABAA receptor complement compared with synapses formed by presynaptic D1 MSNs. Third, recurrent collateral connections between MSNs are dramatically downregulated by dopamine depletion mimicking PD.
MSNs are not randomly coupled
The evidence for differential coupling of MSNs is based on recordings from neurons expressing an EGFP reporter construct for D1 and D2 receptors (Gong et al., 2003). Previous work by our group has verified that neurons identified in this way have the appropriate gene expression profile, as well as typical anatomical and physiological features of MSNs (Shen et al., 2005; Day et al., 2006). Although the estimate of connectivity between D2 MSNs and between D1 MSNs relied on detection of a positive phenotypic marker, our estimates of connectivity between D2 and D1 MSNs relied on recording from an MSN that appeared not to express EGFP in BAC D2 tissue. Mixed pairs always had somata at the same depth, to minimize the chance of a false-negative identification attributable to tissue attenuation of the fluorescence of cells lying deeper in the slice. This strategy consistently yielded pairs in which the fluorescent D2 MSN was presynaptic to an unlabeled, presumptive D1 MSN. Because the cell bodies of recorded pairs were always near the same depth in the slice, the low D1→D2 MSN connectivity is not likely to have been a consequence of one cell's axon being systematically cut unless the axon collaterals of D1 MSNs tend to target MSNs further away from the parent cell body than do D2 MSNs; in the slice, this might give the appearance of an asymmetry in connectivity of the sort we observed. However, there is no evidence of this kind. Furthermore, if some or most nonfluorescent cells were actually D2 MSNs, we would have probably detected more connections in the opposite direction (nonfluorescent→fluorescent), because unidirectional D2–D2 connected pairs were encountered in 36% of cases. Another possibility is that the weakness of synaptic connections formed by D1 MSNs led to an underestimate of their connectivity rates; although this is certainly possible, it does not change the core conclusion that the functional connectivity of this group is weak. As a consequence, the most parsimonious interpretation of our results is that the interaction between these two projection systems relies almost entirely on collateral projections from D2 MSNs to D1 MSNs. It is tempting to speculate that the deviation from strict segregation of the recurrent collaterals might be linked to the collateralization of striatonigral axons into the globus pallidus external segment (GPe) (Kawaguchi et al., 1989), providing a way in which MSNs influencing GPe neurons can communicate with one another. Another possibility is that D1 MSNs are connected to D2 MSNs, but synapses are located exclusively in remote dendritic sites.
Finally, in contrast to some studies (Czubayko and Plenz, 2002; Venance et al., 2004) but in agreement with others (Koos et al., 2004; Taverna et al., 2004; Tecuapetla et al., 2007), we found no evidence of electrotonic coupling. In part, this discrepancy could be attributable to a developmental downregulation of gap junctions and our reliance on older mice.
Recurrent synapses with presynaptic D2 MSNs are more potent
Synaptic connections originating with D2 MSNs were consistently more potent than those from D1 MSNs. Unitary IPSC amplitudes in D1–D1 MSN pairs were approximately one-half of those seen in D2 MSN pairs. Furthermore, with repetitive presynaptic spiking, the integrated postsynaptic response was nearly three times larger in D2 MSN pairs than in D1 MSN pairs. Nonstationary noise analysis suggested that there were no differences in the conductance of GABAA receptors in the two cell types. In all pairs, median conductance estimates were 23–24 pS. This range is similar to that seen using the same analysis in neurons from other regions of the brain, including hippocampus (De Koninck and Mody, 1997), cerebellum (Nusser et al., 1997), and neocortex (Kilman et al., 2002). These estimates also are consistent with single-channel recording studies in striatal MSNs (Ade et al., 2008), heterologous expression systems (Verdoorn et al., 1990; Angelotti and Macdonald, 1993; Lavoie et al., 1997), and cultured hippocampal neurons (Eghbali et al., 1997).
Although there were no differences in receptor conductance, there were significant differences in the apparent receptor numbers at D2 and D1 MSN synapses. This seems to explain the difference in the median IPSC peak amplitude, whereas the similarity of rise time and decay time constant between the two groups excludes an effect of passive cable properties. That said, it is important to stress that our analysis was restricted to IPSCs with fast rise times (<1 ms) and that more distal synapses might have different properties. Moreover, because nonstationary noise analysis was performed with IPSCs evoked by direct stimulation of presynaptic MSNs, we cannot draw firm conclusions about the number of functional synapses, the number of release sites, or whether there was multivesicular release. Answering these questions will require electron microscopic analysis of the synaptic connections between MSNs (Biro et al., 2006).
Collateral inhibition is attenuated in PD models
In two animal models of PD, the synaptic connections between both D1 and D2 MSNs were dramatically attenuated. Based on the dissociation between the change in IPSC amplitude and failure rates at D2 MSN synapses, the downregulation in these connections appeared largely attributable to reduced GABA release. This was not expected. Anatomical studies of 6-OHDA-lesioned rats revealed that striatal expression of GAD (glutamate decarboxylase), the synthetic enzyme for GABA, rises (Soghomonian and Laprade, 1997). Moreover, the terminals of striatopallidal D2 MSNs in the GPe and the striatum are enlarged, in parallel with an increased expression of the releasable peptide enkephalin (Ingham et al., 1991, 1997). These changes have been assumed to reflect increased, rather than decreased, GABA release. Clearly, our results suggest otherwise. An important question is whether GABA release at striatopallidal synapses is affected in the same way as intrastriatal collaterals. Preliminary experiments suggest that GABA release at these synapses is not depressed, implicating intrastriatal regulatory mechanisms.
Interestingly, microdialysis studies suggested that depolarization-induced release of GABA in rats striatum increases after DA depletion (Lindefors et al., 1989; Campbell et al., 1993; Abarca and Bustos, 1999). In light of our results, the most parsimonious interpretation of these findings is that they are detecting primarily GABA released from interneurons. In accord with this hypothesis, the frequency of spontaneous IPSCs in our MSN recordings from depleted tissue was relatively normal. Recent work by Mallet et al. (2006) also is consistent with the proposition that feedforward GABAergic signaling through fast-spiking interneurons is intact after DA-depleting lesions. Testing this hypothesis will require paired recordings from fast-spiking interneurons and MSNs in PD models.
Regardless of how parent axon terminal function is altered by DA depletion, the attenuation of collateral feedback inhibition among MSNs could have significant effects on striatal processing of excitatory input. In sensory pathways, recurrent collateral inhibition serves to sharpen receptive fields (Churchill and Sejnowski, 1992). Something similar could be happening in the striatum, where recurrent collaterals have been hypothesized to shape the neuronal ensembles recruited by cortical motor commands (Mink, 1996; Beiser and Houk, 1998; Redgrave et al., 1999). One potential manifestation of this impaired shaping of striatal activity is the enlargement of receptive fields in GP neurons of 1-methyl-4-phenyl-1,2,3,6-tetrahydropyridine-lesioned primates (Filion et al., 1988; Boraud et al., 2000). Another potential consequence of attenuated recurrent collateral connections is diminished network control of synaptic plasticity. It has been hypothesized that one of the functions of dendritically placed recurrent collateral synapses is the regulation of backpropagating action potentials (bAPs) in MSNs (Plenz, 2003). In other brain neurons, bAPs are thought to be essential to naturally occurring forms of activity-dependent synaptic plasticity (Abbott and Nelson, 2000; Dan and Poo, 2004). The attenuation of shunting GABAergic synaptic activity could lead to enhanced bAP invasion of MSN dendritic trees and inappropriate alterations in the strength of glutamatergic synaptic connections. This alteration could be particularly important in D2 MSNs, whose excitability is elevated by DA depletion (Day et al., 2006; Mallet et al., 2006; Shen et al., 2007).
In conclusion, this study shows that recurrent collateral connections among MSNs are not random but rather follow specific rules. In addition, synapses formed by D2 MSNs are significantly more potent than those formed by D1 MSNs. Last, recurrent collateral connections between MSNs are dramatically downregulated in models of PD, revealing an unappreciated alteration in striatal connectivity.
Footnotes
This work was supported by grants from the Picower Foundation and National Institutes of Health Grants MH 074866 and NS 34696. We thank Dr. Mark Bevan for helpful comments on this manuscript.
References
- Abarca J, Bustos G. Differential regulation of glutamate, aspartate and gamma-amino-butyrate release by N-methyl-d-aspartate receptors in rat striatum after partial and extensive lesions to the nigro-striatal dopamine pathway. Neurochem Int. 1999;35:19–33. doi: 10.1016/s0197-0186(99)00029-7. [DOI] [PubMed] [Google Scholar]
- Abbott LF, Nelson SB. Synaptic plasticity: taming the beast. Nat Neurosci. 2000;3(Suppl):1178–1183. doi: 10.1038/81453. [DOI] [PubMed] [Google Scholar]
- Ade KK, Janssen MJ, Ortinski PI, Vicini S. Differential tonic GABA conductances in striatal medium spiny neurons. J Neurosci. 2008;28:1185–1197. doi: 10.1523/JNEUROSCI.3908-07.2008. [DOI] [PMC free article] [PubMed] [Google Scholar]
- Angelotti TP, Macdonald RL. Assembly of GABAA receptor subunits: α1β1 and α1β1γ2S subunits produce unique ion channels with dissimilar single-channel properties. J Neurosci. 1993;13:1429–1440. doi: 10.1523/JNEUROSCI.13-04-01429.1993. [DOI] [PMC free article] [PubMed] [Google Scholar]
- Beiser DG, Houk JC. Model of cortical-basal ganglionic processing: encoding the serial order of sensory events. J Neurophysiol. 1998;79:3168–3188. doi: 10.1152/jn.1998.79.6.3168. [DOI] [PubMed] [Google Scholar]
- Bevan MD, Magill PJ, Terman D, Bolam JP, Wilson CJ. Move to the rhythm: oscillations in the subthalamic nucleus-external globus pallidus network. Trends Neurosci. 2002;25:525–531. doi: 10.1016/s0166-2236(02)02235-x. [DOI] [PubMed] [Google Scholar]
- Biro AA, Holderith NB, Nusser Z. Release probability-dependent scaling of the postsynaptic responses at single hippocampal GABAergic synapses. J Neurosci. 2006;26:12487–12496. doi: 10.1523/JNEUROSCI.3106-06.2006. [DOI] [PMC free article] [PubMed] [Google Scholar]
- Bolam JP, Somogyi P, Takagi H, Fodor I, Smith AD. Localization of substance P-like immunoreactivity in neurons and nerve terminals in the neostriatum of the rat: a correlated light and electron microscopic study. J Neurocytol. 1983;12:325–344. doi: 10.1007/BF01148468. [DOI] [PubMed] [Google Scholar]
- Boraud T, Bezard E, Bioulac B, Gross CE. Ratio of inhibited-to-activated pallidal neurons decreases dramatically during passive limb movement in the MPTP-treated monkey. J Neurophysiol. 2000;83:1760–1763. doi: 10.1152/jn.2000.83.3.1760. [DOI] [PubMed] [Google Scholar]
- Campbell K, Kalen P, Wictorin K, Lundberg C, Mandel RJ, Bjorklund A. Characterization of GABA release from intrastriatal striatal transplants: dependence on host-derived afferents. Neuroscience. 1993;53:403–415. doi: 10.1016/0306-4522(93)90204-s. [DOI] [PubMed] [Google Scholar]
- Carlsson A, Lindqvist M, Magnusson T. 3,4-Dihydroxyphenylalanine and 5-hydroxytryptophan as reserpine antagonists. Nature. 1957;180:1200. doi: 10.1038/1801200a0. [DOI] [PubMed] [Google Scholar]
- Chang HT, Kitai ST. Projection neurons of the nucleus accumbens: an intracellular labeling study. Brain Res. 1985;347:112–116. doi: 10.1016/0006-8993(85)90894-7. [DOI] [PubMed] [Google Scholar]
- Churchill PS, Sejnowski TJ. The computational brain. Cambridge, MA: MIT; 1992. [Google Scholar]
- Czubayko U, Plenz D. Fast synaptic transmission between striatal spiny projection neurons. Proc Natl Acad Sci USA. 2002;99:15764–15769. doi: 10.1073/pnas.242428599. [DOI] [PMC free article] [PubMed] [Google Scholar]
- Dan Y, Poo MM. Spike timing-dependent plasticity of neural circuits. Neuron. 2004;44:23–30. doi: 10.1016/j.neuron.2004.09.007. [DOI] [PubMed] [Google Scholar]
- Day M, Wang Z, Ding J, An X, Ingham CA, Shering AF, Wokosin D, Ilijic E, Sun Z, Sampson AR, Mugnaini E, Deutch AY, Sesack SR, Arbuthnott GW, Surmeier DJ. Selective elimination of glutamatergic synapses on striatopallidal neurons in Parkinson disease models. Nat Neurosci. 2006;9:251–259. doi: 10.1038/nn1632. [DOI] [PubMed] [Google Scholar]
- De Koninck Y, Mody I. Endogenous GABA activates small-conductance K+ channels underlying slow IPSCs in rat hippocampal neurons. J Neurophysiol. 1997;77:2202–2208. doi: 10.1152/jn.1997.77.4.2202. [DOI] [PubMed] [Google Scholar]
- Eghbali M, Curmi JP, Birnir B, Gage PW. Hippocampal GABA(A) channel conductance increased by diazepam. Nature. 1997;388:71–75. doi: 10.1038/40404. [DOI] [PubMed] [Google Scholar]
- Filion M, Tremblay L, Bedard PJ. Abnormal influences of passive limb movement on the activity of globus pallidus neurons in parkinsonian monkeys. Brain Res. 1988;444:165–176. doi: 10.1016/0006-8993(88)90924-9. [DOI] [PubMed] [Google Scholar]
- Gerfen CR, Young WS., III Distribution of striatonigral and striatopallidal peptidergic neurons in both patch and matrix compartments: an in situ hybridization histochemistry and fluorescent retrograde tracing study. Brain Res. 1988;460:161–167. doi: 10.1016/0006-8993(88)91217-6. [DOI] [PubMed] [Google Scholar]
- Gong S, Zheng C, Doughty ML, Losos K, Didkovsky N, Schambra UB, Nowak NJ, Joyner A, Leblanc G, Hatten ME, Heintz N. A gene expression atlas of the central nervous system based on bacterial artificial chromosomes. Nature. 2003;425:917–925. doi: 10.1038/nature02033. [DOI] [PubMed] [Google Scholar]
- Gustafson N, Gireesh-Dharmaraj E, Czubayko U, Blackwell KT, Plenz D. A comparative voltage and current-clamp analysis of feedback and feedforward synaptic transmission in the striatal microcircuit in vitro. J Neurophysiol. 2006;95:737–752. doi: 10.1152/jn.00802.2005. [DOI] [PubMed] [Google Scholar]
- Ingham CA, Hood SH, Arbuthnott GW. A light and electron microscopical study of enkephalin-immunoreactive structures in the rat neostriatum after removal of the nigrostriatal dopaminergic pathway. Neuroscience. 1991;42:715–730. doi: 10.1016/0306-4522(91)90040-u. [DOI] [PubMed] [Google Scholar]
- Ingham CA, Hood SH, Mijnster MJ, Baldock RA, Arbuthnott GW. Plasticity of striatopallidal terminals following unilateral lesion of the dopaminergic nigrostriatal pathway: a morphological study. Exp Brain Res. 1997;116:39–49. doi: 10.1007/pl00005743. [DOI] [PubMed] [Google Scholar]
- Kawaguchi Y, Wilson CJ, Emson PC. Intracellular recording of identified neostriatal patch and matrix spiny cells in a slice preparation preserving cortical inputs. J Neurophysiol. 1989;62:1052–1068. doi: 10.1152/jn.1989.62.5.1052. [DOI] [PubMed] [Google Scholar]
- Kemp JM, Powell TP. The connexions of the striatum and globus pallidus: synthesis and speculation. Philos Trans R Soc Lond B Biol Sci. 1971;262:441–457. doi: 10.1098/rstb.1971.0106. [DOI] [PubMed] [Google Scholar]
- Kilman V, van Rossum MC, Turrigiano GG. Activity deprivation reduces miniature IPSC amplitude by decreasing the number of postsynaptic GABAA receptors clustered at neocortical synapses. J Neurosci. 2002;22:1328–1337. doi: 10.1523/JNEUROSCI.22-04-01328.2002. [DOI] [PMC free article] [PubMed] [Google Scholar]
- Kitai ST. Anatomy and physiology of the neostriatum. Adv Biochem Psychopharmacol. 1981;30:1–21. [PubMed] [Google Scholar]
- Koos T, Tepper JM, Wilson CJ. Comparison of IPSCs evoked by spiny and fast-spiking neurons in the neostriatum. J Neurosci. 2004;24:7916–7922. doi: 10.1523/JNEUROSCI.2163-04.2004. [DOI] [PMC free article] [PubMed] [Google Scholar]
- Kreitzer AC, Malenka RC. Endocannabinoid-mediated rescue of striatal LTD and motor deficits in Parkinson's disease models. Nature. 2007;445:643–647. doi: 10.1038/nature05506. [DOI] [PubMed] [Google Scholar]
- Lavoie AM, Tingey JJ, Harrison NL, Pritchett DB, Twyman RE. Activation and deactivation rates of recombinant GABA(A) receptor channels are dependent on alpha-subunit isoform. Biophys J. 1997;73:2518–2526. doi: 10.1016/S0006-3495(97)78280-8. [DOI] [PMC free article] [PubMed] [Google Scholar]
- Lindefors N, Brodin E, Tossman U, Segovia J, Ungerstedt U. Tissue levels and in vivo release of tachykinins and GABA in striatum and substantia nigra of rat brain after unilateral striatal dopamine denervation. Exp Brain Res. 1989;74:527–534. doi: 10.1007/BF00247354. [DOI] [PubMed] [Google Scholar]
- Lu XY, Ghasemzadeh MB, Kalivas PW. Expression of D1 receptor, D2 receptor, substance P and enkephalin messenger RNAs in the neurons projecting from the nucleus accumbens. Neuroscience. 1998;82:767–780. doi: 10.1016/s0306-4522(97)00327-8. [DOI] [PubMed] [Google Scholar]
- Mallet N, Ballion B, Le Moine C, Gonon F. Cortical inputs and GABA interneurons imbalance projection neurons in the striatum of parkinsonian rats. J Neurosci. 2006;26:3875–3884. doi: 10.1523/JNEUROSCI.4439-05.2006. [DOI] [PMC free article] [PubMed] [Google Scholar]
- Mink JW. The basal ganglia: focused selection and inhibition of competing motor programs. Prog Neurobiol. 1996;50:381–425. doi: 10.1016/s0301-0082(96)00042-1. [DOI] [PubMed] [Google Scholar]
- Nusser Z, Cull-Candy S, Farrant M. Differences in synaptic GABA(A) receptor number underlie variation in GABA mini amplitude. Neuron. 1997;19:697–709. doi: 10.1016/s0896-6273(00)80382-7. [DOI] [PubMed] [Google Scholar]
- Paxinos G, Franklin KB. The mouse brain in stereotaxic coordinates. San Diego: Academic; 2001. [Google Scholar]
- Plenz D. When inhibition goes incognito: feedback interaction between spiny projection neurons in striatal function. Trends Neurosci. 2003;26:436–443. doi: 10.1016/S0166-2236(03)00196-6. [DOI] [PubMed] [Google Scholar]
- Redgrave P, Prescott TJ, Gurney K. The basal ganglia: a vertebrate solution to the selection problem? Neuroscience. 1999;89:1009–1023. doi: 10.1016/s0306-4522(98)00319-4. [DOI] [PubMed] [Google Scholar]
- Schwarting RK, Huston JP. The unilateral 6-hydroxydopamine model in behavioral brain research. Analysis of functional deficits, recovery and treatments. Prog Neurobiol. 1996;50:275–331. doi: 10.1016/s0301-0082(96)00040-8. [DOI] [PubMed] [Google Scholar]
- Shen W, Hamilton SE, Nathanson NM, Surmeier DJ. Cholinergic suppression of KCNQ channel currents enhances excitability of striatal medium spiny neurons. J Neurosci. 2005;25:7449–7458. doi: 10.1523/JNEUROSCI.1381-05.2005. [DOI] [PMC free article] [PubMed] [Google Scholar]
- Shen W, Tian X, Day M, Ulrich S, Tkatch T, Nathanson NM, Surmeier DJ. Cholinergic modulation of Kir2 channels selectively elevates dendritic excitability in striatopallidal neurons. Nat Neurosci. 2007;10:1458–1466. doi: 10.1038/nn1972. [DOI] [PubMed] [Google Scholar]
- Sigworth FJ. The variance of sodium current fluctuations at the node of Ranvier. J Physiol (Lond) 1980;307:97–129. doi: 10.1113/jphysiol.1980.sp013426. [DOI] [PMC free article] [PubMed] [Google Scholar]
- Silver RA, Cull-Candy SG, Takahashi T. Non-NMDA glutamate receptor occupancy and open probability at a rat cerebellar synapse with single and multiple release sites. J Physiol (Lond) 1996;494:231–250. doi: 10.1113/jphysiol.1996.sp021487. [DOI] [PMC free article] [PubMed] [Google Scholar]
- Soghomonian JJ, Laprade N. Glutamate decarboxylase (GAD67 and GAD65) gene expression is increased in a subpopulation of neurons in the putamen of parkinsonian monkeys. Synapse. 1997;27:122–132. doi: 10.1002/(SICI)1098-2396(199710)27:2<122::AID-SYN3>3.0.CO;2-G. [DOI] [PubMed] [Google Scholar]
- Somogyi P, Priestley JV, Cuello AC, Smith AD, Takagi H. Synaptic connections of enkephalin-immunoreactive nerve terminals in the neostriatum: a correlated light and electron microscopic study. J Neurocytol. 1982;11:779–807. doi: 10.1007/BF01153519. [DOI] [PubMed] [Google Scholar]
- Surmeier DJ, Kitai ST. Dopaminergic regulation of striatal efferent pathways. Curr Opin Neurobiol. 1994;4:915–919. doi: 10.1016/0959-4388(94)90142-2. [DOI] [PubMed] [Google Scholar]
- Taverna S, van Dongen YC, Groenewegen HJ, Pennartz CM. Direct physiological evidence for synaptic connectivity between medium-sized spiny neurons in rat nucleus accumbens in situ. J Neurophysiol. 2004;91:1111–1121. doi: 10.1152/jn.00892.2003. [DOI] [PubMed] [Google Scholar]
- Taverna S, Canciani B, Pennartz CM. Dopamine D1-receptors modulate lateral inhibition between principal cells of the nucleus accumbens. J Neurophysiol. 2005;93:1816–1819. doi: 10.1152/jn.00672.2004. [DOI] [PubMed] [Google Scholar]
- Tecuapetla F, Carrillo-Reid L, Bargas J, Galarraga E. Dopaminergic modulation of short-term synaptic plasticity at striatal inhibitory synapses. Proc Natl Acad Sci USA. 2007;104:10258–10263. doi: 10.1073/pnas.0703813104. [DOI] [PMC free article] [PubMed] [Google Scholar]
- Tkatch T, Baranauskas G, Surmeier DJ. Kv4.2 mRNA abundance and A-type K(+) current amplitude are linearly related in basal ganglia and basal forebrain neurons. J Neurosci. 2000;20:579–588. doi: 10.1523/JNEUROSCI.20-02-00579.2000. [DOI] [PMC free article] [PubMed] [Google Scholar]
- Traynelis SF, Jaramillo F. Getting the most out of noise in the central nervous system. Trends Neurosci. 1998;21:137–145. doi: 10.1016/s0166-2236(98)01238-7. [DOI] [PubMed] [Google Scholar]
- Tunstall MJ, Oorschot DE, Kean A, Wickens JR. Inhibitory interactions between spiny projection neurons in the rat striatum. J Neurophysiol. 2002;88:1263–1269. doi: 10.1152/jn.2002.88.3.1263. [DOI] [PubMed] [Google Scholar]
- Venance L, Glowinski J, Giaume C. Electrical and chemical transmission between striatal GABAergic output neurones in rat brain slices. J Physiol (Lond) 2004;559:215–230. doi: 10.1113/jphysiol.2004.065672. [DOI] [PMC free article] [PubMed] [Google Scholar]
- Verdoorn TA, Draguhn A, Ymer S, Seeburg PH, Sakmann B. Functional properties of recombinant rat GABAA receptors depend upon subunit composition. Neuron. 1990;4:919–928. doi: 10.1016/0896-6273(90)90145-6. [DOI] [PubMed] [Google Scholar]
- Wang Z, Kai L, Day M, Ronesi J, Yin HH, Ding J, Tkatch T, Lovinger DM, Surmeier DJ. Dopaminergic control of corticostriatal long-term synaptic depression in medium spiny neurons is mediated by cholinergic interneurons. Neuron. 2006;50:443–452. doi: 10.1016/j.neuron.2006.04.010. [DOI] [PubMed] [Google Scholar]
- Wilson CJ. The generation of natural firing patterns in neostriatal neurons. Prog Brain Res. 1993;99:277–297. doi: 10.1016/s0079-6123(08)61352-7. [DOI] [PubMed] [Google Scholar]
- Wilson CJ, Groves PM. Fine structure and synaptic connections of the common spiny neuron of the rat neostriatum: a study employing intracellular inject of horseradish peroxidase. J Comp Neurol. 1980;194:599–615. doi: 10.1002/cne.901940308. [DOI] [PubMed] [Google Scholar]
- Yung KK, Smith AD, Levey AI, Bolam JP. Synaptic connections between spiny neurons of the direct and indirect pathways in the neostriatum of the rat: evidence from dopamine receptor and neuropeptide immunostaining. Eur J Neurosci. 1996;8:861–869. doi: 10.1111/j.1460-9568.1996.tb01573.x. [DOI] [PubMed] [Google Scholar]