

Abstract
Principal medium spiny projection neurons (MSNs) of the striatum have long been thought to be homogeneous in their somatodendritic morphology and physiology. Recent work using transgenic mice, in which the two major classes of MSN are labeled, has challenged this assumption. To explore the basis for this difference, D1 and D2 receptor-expressing MSNs (D1 and D2 MSNs) in brain slices from adult transgenic mice were characterized electrophysiologically and anatomically. These studies revealed that D1 MSNs were less excitable than D2 MSNs over a broad range of developmental time points. Although M1 muscarinic receptor signaling was a factor, it was not sufficient to explain the dichotomy between D1 and D2 MSNs. Reconstructions of biocytin-filled MSNs revealed that the physiological divergence was paralleled by a divergence in total dendritic area. Experimentally grounded simulations suggested that the dichotomy in MSN dendritic area was a major contributor to the dichotomy in electrophysiological properties. Thus, rather than being an intrinsically homogenous population, striatal MSNs have dichotomous somatodendritic properties that mirror differences in their network connections and biochemistry.
Keywords: medium spiny neuron, striatum, anatomical reconstruction, basal ganglia, excitability, whole-cell patch-clamp recording
Introduction
A point of convergence for cortical and thalamic excitatory signals, the striatum is thought to participate in a wide range of psychomotor behaviors (Ragsdale and Graybiel, 1981; Schultz, 2006; Balleine et al., 2007). The principal target of these signals is the GABAergic medium spiny projection neuron (MSN). MSNs are commonly divided into two major subsets based on their expression of both releasable peptides and dopamine (DA) receptors, and their axonal projection targets (Gerfen and Young, 1988; Le Moine et al., 1991). MSNs with axonal projections to the substantia nigra pars reticulata (SNr) express substance P, dynorphin, and D1 DA receptors (D1 MSNs), whereas MSNs with principal axon projections to the globus pallidus express enkephalin and D2 DA receptors (D2 MSNs).
Although less well characterized than the biochemical and anatomical differences, MSNs also appear to differ in their synaptic connectivity. For example, striatal neurons have been divided into type I and II neurons based on paired-pulse responses to cortical stimulation, a feature attributable to variable striatal GABAergic interneuron connectivity (Gerfen and Young, 1988). Although the correlation between these two response types and D1 and D2 MSNs has been suggested (Onn et al., 1994), it has not been established. MSNs also differ in their activity level during cortically driven up-states in anesthetized rodents (Wickens and Wilson, 1998). As the cortical glutamatergic input to D1 and D2 MSNs appears to arise from distinct projection systems (Lei et al., 2004), it is possible that variation in presynaptic sites and release properties could account for the observed dichotomy, but again there is no clear linkage with the D1 and D2 MSN phenotypes.
Despite the dichotomies in axonal projections and synaptic connectivity, D1 and D2 MSNs have been thought of as homogenous in their somatodendritic morphology and intrinsic physiological properties. Until recently, distinguishing MSNs while recording has been technically difficult and labor intensive, requiring either single-cell gene profiling (Surmeier et al., 1996) or axonal tracing (Kawaguchi et al., 1990). The development of bacterial artificial chromosome (BAC) transgenic mice expressing enhanced green fluorescent protein (eGFP) under the control of promoters for the D1 and D2 receptors has eliminated this problem (Day et al., 2006; Wang et al., 2006; Kreitzer and Malenka, 2007; Shen et al., 2007; Ade et al., 2008; Cepeda et al., 2008). Based on work with BAC transgenic mice, Kreitzer and Malenka (2007) have suggested that in 3-week-old mice, D2 MSNs are more responsive to intrasomatic current injection than are D1 MSNs. To pursue this observation, whole-cell patch-clamp recordings were obtained from identified D1 and D2 MSNs in brain slices from BAC transgenic mice between 3 and 10 weeks of age. MSNs were characterized electrophysiologically, filled with biocytin, and anatomically reconstructed. These studies confirmed that D2 MSNs are more responsive to intrasomatic current injection, but more importantly provided an important clue as to why: D2 MSNs had significantly smaller dendritic trees than did D1 MSNs. Computer simulations suggested that this anatomical dichotomy was a major factor underlying the electrophysiological dichotomy.
Materials and Methods
Slice preparation.
All experiments detailed are in accord with the Northwestern University Animal Care and Use Committee. D1 and D2 receptor-eGFP BAC transgenic mice on an FVB background, developed by the GENSAT project (Heintz, 2004), between postnatal days 35–45 (unless otherwise indicated), were anesthetized with ketamine/xylazine and perfused transcardially with ice-cold artificial CSF (aCSF), containing in mm: 125 NaCl, 2.5 KCl, 1.25 NaH2PO4, 2.0 CaCl2, 1.0 MgCl2, 25 NaHCO3, and 12.5 glucose, bubbled continuously with carbogen (95% O2 and 5% CO2). The brains were rapidly removed, glued to the stage of a VT1000S slicer (Leica), and immersed in ice-cold aCSF. Striatal slices were cut at a thickness of 230–275 μm and transferred to a holding chamber, where they were submerged in aCSF, incubated at 35°C for 30 min, and returned to room temperature before recording.
Single-cell RT-PCR.
In slices, cells were identified as D1 MSNs or D2 MSNs based on eGFP expression. After recording, negative pressure was used, while maintaining a tight seal, to aspirate cytoplasmic content into the pipette. After aspiration, the electrode was broken and contents ejected into a 0.5 ml Eppendorf tube containing 5 μl of diethylpyrocarbonate-treated water, 0.5 μl of superasin (28,000 U/ml), and 0.5 μl of dithiothreitol (DTT) (0.1 m). Oligo(dT) (0.5 μg/μl) and random hexanucleotides (50 ng/μl) were used to prime reverse transcription (RT) using: SuperScript II reverse transcriptase (1 μl, 200 U/μl) and buffer [4 μl, 5× First Strand Buffer: (in mm) 250 Tris-HCl, 375 KCl, 15 MgCl2], Superase-In (1 μl, 20 U/μl), DTT (1.5 μl, 0.1 m), and mixed deoxynucleotide triphosphates (1 μl, 10 mm). After RNA digestion by 1 μl of RNase H (2 U/μl), cDNA from the RT reaction was amplified by the PCR. PCR from the single-cell cDNA was performed for substance P and enkephalin as described previously (Wang et al., 2002).
Retrograde tracing.
BAC transgenic mice aged postnatal day 28–30 (P28–P30) were first anesthetized with ketamine/xylazine. After immobilization on a stereotaxic frame (Model 940; David Kopf Instruments) with a Cunningham adaptor (Harvard Apparatus), a hole was drilled at 3.0 mm posterior and 1.4 mm lateral to bregma for injection into the SNr. Alexa Fluor-Cholera toxin subunit B [1 μl (1 mg/ml); Invitrogen] in sterile PBS was delivered using a calibrated glass micropipette (2-000-00; Drummond Scientific) at a depth of 4.7 mm from the surface of the skull. The micropipette remained in situ for 30 min postinjection to minimize tracer diffusion to other regions. Animals were perfused and fixed with 4% paraformaldehyde 14 d later; 50 μm slices were sectioned and imaged as single frames on a laser-scanning confocal microscope (see below) with a 63×/1.4 numerical aperture (NA) oil-immersion objective.
Whole-cell patch-clamp recording.
Recordings were made at room temperature (20–22°C) with patch electrodes (1.5 mm outer diameter) fabricated from filamented, thick-wall borosilicate-glass (Sutter Instruments) pulled on a Flaming-Brown puller (P-97; Sutter Instruments) and fire polished immediately before use. Pipette resistance was typically ∼3–5 MΩ when filled with internal solution consisting of (in mm): 135 KMeSO4, 5 KCl, 10 Na-phosphocreatine, 5.0 EGTA, 0.5 CaCl2, 2.0 Mg-ATP, 0.5 Na3-GTP, 5 HEPES, 0.2% w/v biocytin, pH 7.25–7.30, 300 mOsm. The liquid junction potential in recordings was ∼7 mV and not corrected for. MSNs within the dorsal striatum were identified by their somatic morphological characteristics under infrared differential interference contrast (IR-DIC) optics. Somatic eGFP expression was verified routinely in cell-attach mode using epifluorescence microscopy to confirm cell identity before breaking into whole-cell mode. Current- and voltage-clamp data were obtained and compared from both eGFP-positive neurons from a D1 eGFP animal and eGFP-negative neurons from a D2-eGFP animal; as no differences in this sampling strategy were noted, data were pooled and labeled as D1 MSNs. Somatic whole-cell patch-clamp recordings were obtained with a MultiClamp 700B amplifier (Molecular Devices) interfaced to a Pentium-based PC running pClamp9 (Molecular Devices). The signal for voltage-clamp recordings was filtered at 1 kHz and digitized at 10 kHz with a Digidata 1322A (Molecular Devices), except for adjusted whole-cell capacitance estimates. A 10 ms pulse was used to adjust the amplifier compensation for voltage-clamp recording and capacitance compensation. To obtain more accurate whole-cell capacitance measurements, whole-cell capacitance was measured using a 5 mV, 100 ms step from −80 mV, with a Bessel filter of 10 kHz, averaged 50–100 times to avoid sampling error. The plateau phase of the step was fit with a line constrained to a slope of zero, from which the y-intercept was measured and used to constrain a biexponential fit to the peak of the capacitive transient; a weighted τ was calculated and used for whole-cell capacitance calculations (supplemental Fig. 2, available at www.jneurosci.org as supplemental material). Population data for which compensation measurements alone were available were recalculated using a linear regression calculated from a subset of cells (n = 50) with both amplifier compensation and 5 mV pulse measurements. For current-clamp recordings, the amplifier bridge circuit was adjusted to compensate for electrode resistance and subsequently monitored. Rheobase current was defined as the first current step, within a series of + 20 pA steps beginning at −150 pA, capable of eliciting one action potential.
Confocal imaging/anatomical reconstruction.
For anatomical reconstruction, 0.2% biocytin was included in the internal solution described above and recorded in whole-cell mode for at least 30 min. Slices recovered were flat-mounted on nitrocellulose filters (Millipore) and fixed in 4% paraformaldehyde (with 15% picric acid, prepared in 0.1 mm PB at pH 7.4) for 7–12 d. After several washes, slices were then reacted with 2 μg/ml streptavidin-AlexaFluor 594 (Invitrogen) in 2% Triton-X, 1% NGS prepared in PBS overnight at room temperature in the dark. Sections were then washed and coverslipped in an aqueous-based mounting medium. A cell was rejected if the soma was not intact or any dye was seen in neighboring cells or processes, suggesting processes of compromised integrity. Serial optical sections (Z-stacks) were acquired on a laser-scanning confocal microscope (LSM 510; Zeiss) with a 40×/1 NA oil-immersion objective (Zeiss) at 1 μm intervals. Images were stored at 16-bit image depth at a resolution of 1024 × 1024 pixels (0.22 × 0.22 × 1 μm). Z-series of the same cell were stitched together using Volume Integration and Alignment Software (VIAS; Mt. Sinai Computational Neurobiology and Imaging Center), and subsequently reconstructed and analyzed using the Neurolucida/Neuroexplorer suite (MicroBrightField). No correction was applied for tissue shrinkage during fixation.
Corticostriatal coculture.
Corticostriatal coculture was prepared as described previously (Segal et al., 2003). Striata from D2-eGFP BAC mice and cortices from embryonic day 18–19 C57BL/6 mice were isolated, digested with papain (Worthington Biochemical ), and dissociated with 1 ml pipet tips as described previously (Brewer, 1997). Striatal cells and cortical cells were mixed at a ratio of 3:1 and plated on 12 mm coverslips coated with polyethylenimine (Sigma) at a density of 1 × 10⁵/cm2. Coverslips were placed in 24-well plates with Neurobasal A medium (Invitrogen) supplemented with 0.5 mm glutamine (Invitrogen), 1×B27 (Invitrogen), 50 mg/l penicillin/streptomycin (Invitrogen), 50 ng/ml BDNF (Sigma), and 30 ng/ml GDNF (Sigma). After initial plating, one quarter of the medium was exchanged with fresh medium without BDNF and GDNF every 3–4 d. Cultures (21 d old) were fixed with 4% paraformaldehyde in PBS buffer, pH 7.4, for 20 min at room temperature. Fixed cells were incubated in blocking buffer containing 0.2% Triton X-100, 1% BSA, 5% normal donkey serum (Jackson ImmunoResearch Laboratories), and 0.01% sodium azide in PBS for 1 h at room temperature. The coverslips were then exposed to goat anti-eGFP antibody (1:5000; Abcam) or rat anti-D1 receptor antibody (1:500; Sigma). After a brief wash, cells were stained with appropriate secondary antibodies (Invitrogen). Single frame images of eGFP-positive D1 MSN cells were captured using with a laser-scanning confocal microscope (see above).
NEURON modeling.
MSNs were modeled with NEURON, version 6.0 (Hines and Carnevale, 1997, 2001). The canonical model neuron [Functional Reconstruction for Examining Dendrites (FRED)] was constructed of a cylindrical soma [length (L), 30 μm; diameter (D), 12 μm], 4 to 10 dendrites, an axon initial segment (L, 10 μm; D, 1.4 μm), and a cylindrical axon consisting of a sequence of five sections (L, 100 μm; D, 1 μm) separated by four nodes (L, 1 μm; D, 1 μm). Each dendrite consisted of one primary section (L, 30 μm; diameter tapers from 2.5–2 μm), two secondary sections (L, 50 μm; diameter tapers from 2 to 1 μm), two tertiary sections (L, 75 μm; diameter tapers from 1.92–0.6 μm), and two quaternary sections (L, 94 μm; D, 0.6 μm). Segment number and length estimates were taken from reconstructed neurons and dendritic diameters from previous electron microscopic studies (Wilson et al., 1983; Koos et al., 2004). Spines were represented as a doubling of surface area of the tertiary and quaternary sections (incorporated in the dimensions that are listed this section), and a fourfold increase in axial resistivity to represent cross-sectional electrical impedance. Axial resistivity was 100 Ω-cm, except in the tertiary and quaternary dendritic sections where it was 400 Ω-cm to compensate for increased cross-sectional area (Jack et al., 1989; Larkman et al., 1992). Specific membrane capacitance was adjusted to 1.2 μF/cm2. Alternatively, spine calculations were made with a doubling of specific membrane capacitance and a halving of membrane resistance; outcome measures reported, such as whole-cell capacitance and rheobase current measured through a simulated somatic whole-cell recording, were not qualitatively or quantitatively significantly different, as has been reported previously (Vetter et al., 2001).
The cell model incorporated biophysically accurate ion channel models describing Nav, Kv1, Kv2, Kv4, Kir2, Cav, and SK channels, as well as a Ca2+ buffering system, which were constrained by experimental data (Baranauskas et al., 1999, 2003; Tkatch et al., 2000; Chan et al., 2004; Shen et al., 2004, 2005) or acquired from NEURON database mod files from previous simulations (Migliore et al., 1995; Wang et al., 2002; Khaliq et al., 2003) and incorporated into the appropriate compartments. AMPA-mediated synaptic input was simulated at 120 μm eccentricities from the soma with a rise time of 0.2 ms, a decay time of 4 ms, and a maximum conductance of 2.5 nS. All simulations were done at 23°C and with an ENa of 50 mV and EK of −90 mV. NEURON mod files providing a complete description of the model are available on request and will be posted on the ModelDB web site (http://senselab.med.yale.edu/neurondb).
Additionally, reconstructions of prototypical D1 and D2 MSNs were imported from Neurolucida (MicroBrightField) into NEURON using the Import 3D tool. A soma, similar in size to the soma of the FRED models, was created in NEURON and attached to the reconstructed dendrites. The reconstruction models incorporated the same specific membrane capacitance and ion channel properties (i.e., identities, kinetics, and densities) as the FRED models, with channels distributed according to dendritic branch order: primary, secondary, tertiary and quaternary.
Data and statistical analyses.
Curve fitting and data analyses were done with Igor Pro 6.0 (WaveMetrics) and Sigmastat (Systat Software). Box plots were used for graphic representation, whereby the central line represents the median, the edges represent the interquartile ranges, and the whiskers represent the overall distribution. Non-normal distributions were assumed for all data sets regardless of sample size and variance. Pairwise comparisons were performed using a Mann–Whitney rank sum test with a threshold of p < 0.05 for significance; correlations were examined by a Spearman rank correlation test.
Results
Medium spiny neurons can be identified by eGFP expression
Whole-cell recordings were obtained from MSNs in parasagittal slices from BAC transgenic mice (P35–P45) (Fig. 1a). With the aid of eGFP expression, D1 receptor expressing striatonigral MSNs (D1 MSNs) and D2 receptor expressing striatopallidal MSNs (D2 MSNs) were identified within the slice (Fig. 1b). To confirm the identity of these cells, a subset of cells identified by eGFP expression were profiled using single-cell RT-PCR (Fig. 1d). As previously described, substance P and enkephalin expression were restricted to D1 and D2 MSNs, respectively (Gerfen et al., 1990; Surmeier et al., 1992, 1996). Finally, to determine whether D1 and D2 receptors were coexpressed in a subset of neurons, cholera toxin subunit B (CTX-B), a retrograde tracer, (Ericson and Blomqvist, 1988) was injected into the SNr of D1 and D2 BAC mice. Confocal imaging of the striatum revealed complete colocalization of eGFP with CTX-B in striata from D1 BAC mice, whereas no colocalization was found in striata from D2 BAC mice (Fig. 1e,f). Neurons labeled with CTX-B, but not eGFP, were not readily observed, in contrast to the suggestion of a recent study that there is a significant unlabeled population (∼30%) of MSNs in D1 BAC mice (Shuen et al., 2008). As noted below, D1 and D2 MSNs identified by their expression of eGFP differed significantly in their intrinsic excitability. eGFP-negative MSNs sampled from D2 BAC slices were electrophysiologically indistinguishable from D1 MSNs sampled in slices from D1 BAC mice (supplemental Fig. 1, available at www.jneurosci.org as supplemental material). As a consequence, each MSN population was studied in a single slice to control for variability in founder populations and slice viability.
Figure 1.

Identification of D1 and D2 MSNs. a, A sagittal slice taken from a P40 FVB mouse. Ctx, Cortex; Cpu, caudate putamen; GP, globus pallidus; ec, external capsule; ic, internal capsule. b, Confocal image of eGFP-positive MSNs from a BAC transgenic animal. c, Visualized whole-cell recordings were made with contrast-enhanced IR-DIC microscopy (see Materials and Methods). d, Single-cell RT-PCR (scRT-PCR) verification of substance P (sp) and enkephalin (enk) expression in D1 and D2 spiny neurons. e, f, Injection of Cholera toxin subunit B-Alexa 647 into the SNr of BAC D1 and D2-eGFP mice displays overlapping and mutually exclusive populations of MSNs.
D1 and D2 medium spiny neurons differed in intrinsic excitability
Whole-cell patch-clamp recordings were made in current-clamp mode to survey the intrinsic properties of D1 and D2 MSNs (Fig. 2). After seal rupture and equilibration, the resting membrane potential of D1 MSNs was more hyperpolarized than that of D2 MSNs (D1 MSN: median, −87.2 mV, n = 35; D2 MSN: median, −85.4 mV, n = 31; p < 0.05). The rheobase current was significantly greater in D1 MSNs (D1 MSN: median, 270 pA, n = 35; D2 MSN: median, 130 pA, n = 31; p < 0.001). Thus, the current step used to evoke a single spike in a D2 MSN failed to push a D1 MSN to spike threshold; conversely, intrasomatic injection of a typical rheobase current step in a D1 MSN evoked a train of action potentials in a D2 MSN (Fig. 2a). The differences in rheobase were not reflective of differences in spike threshold (D1 MSN: median, −43.3 mV, n = 35; D2 MSN: median, −44.2 mV, n = 31). However, there was a significant difference in input resistance measured with a −150 pA hyperpolarizing step from the resting membrane potential (D1 MSN: median, 53.1 MΩ, n = 35; D2 MSN: median, 93.1 MΩ, n = 31; p < 0.05). Input resistance was also calculated from a linear fit to a voltage–current plot for comparison with other reports. A 5 mV voltage-clamp step from −80 mV revealed that D2 MSNs had a shorter membrane time constant than D1 MSNs (D1 MSN: median, 2.9 ms, n = 35; D2 MSN: median, 2.3 ms, n = 31; p < 0.05). Last, the relationship between spiking frequency and injected current (F–I plot) was shifted leftward in D2 MSNs compared with D1 MSNs.
Figure 2.

Differences in the membrane properties of D1 and D2 MSNs. a, b, Rheobase current is significantly higher in D1 MSNs (D1 MSNs: median, 270 pA, n = 35; D2 MSNs: median, 130 pA, n = 31; p < 0.001). c, Resting membrane potential is significantly more depolarized in D2 MSNs (D1 MSNs: median, −87.2 mV, n = 35; D2 MSNs: median, −85.4 mV, n = 31; p < 0.05). d, Spike threshold is not significantly different. e, Input resistance measured with a −150 pA hyperpolarizing step is significantly smaller in D1 MSNs (D1 MSNs: median, 53.1 MΩ, n = 35; D2 MSNs: median, 93.1 MΩ, n = 31; p < 0.05). e, f, Membrane time constant and resistance measured with a 5 mV pulse in voltage clamp from −80 mV are significantly different (Rm: D1 MSNs: median, 124.40 MΩ, n = 35; D2 MSNs: median, 154.83 MΩ, n = 31; p < 0.05; τ: D1 MSNs: median, 2.9 ms, n = 28; D2 MSNs: median, 2.3 ms, n = 30; p < 0.05). h, i, Membrane responses to intrasomatic current injection reveal a subthreshold divergence. A linear fit across resting membrane potential reveals a difference in input resistance. j, Voltage responses of D1 and D2 MSNs to intrasomatic current steps demonstrate increased excitability in the D2 MSN population, as displayed in an F–I plot. *Statistical significance.
The predominant channel open at the resting membrane potential (typically −80 to −90 mV) in adult MSNs is the inwardly rectifying K+ (Kir2) channel (Uchimura et al., 1989; Jiang and North, 1991; Nisenbaum and Wilson, 1995). Somatic voltage ramps from −150 to −50 mV (0.6 mV/ms) were used to measure the currents through these Ba2+ sensitive channels (Fig. 3). The total current was modeled as a sum of currents through an inwardly rectifying Kir2 channel and a linear K+ selective leak channel (Kleak) (Shen et al., 2007). The Kir2/Kleak currents had similar properties in D1 and D2 MSNs, but differed in amplitude, being significantly larger in D1 MSNs (median, −1836 pA, n = 35; D2 MSN: median, −1159 pA, n = 31, p < 0.05).
Figure 3.

Differences in Kir2 channel current amplitude and whole-cell capacitance between D1 and D2 MSNs. a, Sample voltage-clamp recording of a spiny neuron, with a focus on the inwardly rectifying Kir2 current present during a voltage ramp. b, Mean current–voltage relationships of D1 (red) and D2 (blue) MSNs as measured with a 200 ms ramp, displayed with shaded SEM. Note the divergence of the two populations, with a difference current (inset) mirroring the Kir2 current rectification and reversal profile. Arrow indicates EK. c, Overlapping, yet significantly different, Gaussian distributions of whole-cell capacitance measurements taken from D1 and D2 MSNs (D1 MSN: median, 192 pF, n = 28; D2 MSN: median, 157 pF, n = 30; p < 0.05). d, Peak Kir2/K leak channel conductance (measured with −150 mV step; see arrow in a) is positively correlated to whole-cell capacitance in D1 and D2 MSNs.
A difference in the magnitude of the current measured with a somatic recording could be attributed to differences in channel density, channel distribution, or the surface area of the membrane in which channels are expressed. The K+ conductance at −150 mV in the sample was positively correlated with whole-cell capacitance (rS = 0.77, p < 0.001). Whole-cell capacitance estimates of D1 MSNs were consistently larger than those of D2 MSNs, suggesting they had a greater surface area (Fig. 3c) (D1 MSN: median, 177 pF, n = 69; D2 MSN: median, 142 pF, n = 72; p < 0.001). Normalizing K+ conductance with the whole-cell capacitance estimates eliminated the differences between D1 and D2 MSNs (Fig. 3d) (D1 MSN: median, −10.5 pA/pF, n = 35; D2 MSN: median, −8.03 pA/pF, n = 31), arguing that the principal difference between them was surface area, not channel density.
Differences between medium spiny neurons persisted with development
To determine whether the differences in intrinsic excitability of MSNs were developmentally regulated, D1 and D2 MSNs from 2.5 to 10 weeks of age were examined. The dichotomy in rheobase was apparent as early as 2.5 weeks postnatally and was maintained through the oldest animal studied (10 weeks) (Fig. 4). Similarly, the inward current measured in our voltage ramp protocol (Fig. 3), which was carried predominantly by Kir2 channels, increases sharply with age, past the 5- to 6-week-old time point and out to 10 weeks of age. Thus, the differences between D1 and D2 MSNs in both rheobase and Kir2 channel currents were evident from early developmental stages through adulthood.
Figure 4.

The difference between D1 and D2 MSNs is stable through development. a, Current-clamp recordings from D1 MSNs spiny throughout development. b, Rheobase current increases for all MSNs through 10 weeks of age. c, Peak inward current, as measured by a voltage step from −80 to −150 mV in voltage-clamp mode, also increases for both MSN subtypes through development.
Differences between MSNs were not solely attributable to M1 muscarinic receptors
Previous work by our group has shown that Kir2 channels in D1 and D2 MSNs are differentially modulated by M1 muscarinic receptor signaling (Shen et al., 2007). In particular, M1 receptors downregulate Kir2 channels (via Gq/11-mediated PIP2 depletion) in D2 MSNs, but have little effect on Kir2 channels in D1 MSNs. Hence, one possible explanation for the dichotomy between D1 and D2 MSNs is that it reflects basal M1 receptor modulation. To test this possibility, whole-cell recordings were taken from D2-eGFP BAC mice crossed with M1 receptor knock-out mice (Shen et al., 2007). In current-clamp mode, the F–I relationship was shifted to the right (less excitable) in D2 MSNs lacking M1 receptors, whereas D1 MSNs were unaltered (Fig. 5a–d). Voltage-clamp experiments demonstrated that Kir2 channel currents were larger in D2 MSNs lacking M1 receptors, whereas they were indistinguishable in D1 MSNs (Fig. 5e–h). Although these differences corroborate previous studies and demonstrate the existence of ambient muscarinic receptor stimulation in the in vitro slice preparation, they were not of sufficient magnitude to account for the physiological dichotomy between D1 and D2 MSNs.
Figure 5.
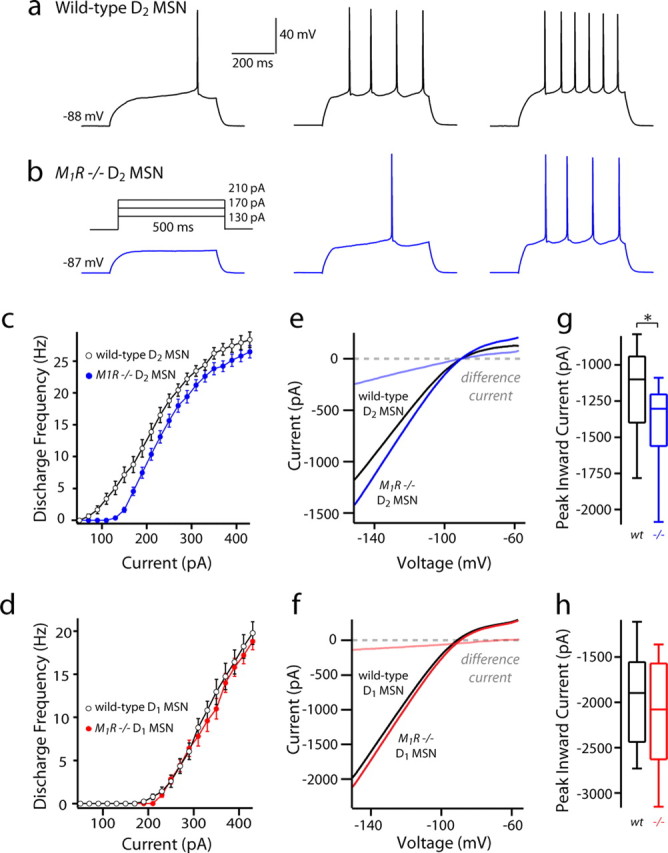
Basal muscarinic tone suppresses the excitability of D2 MSNs but is insufficient to explain the physiological dichotomy. a, b, Sample current-clamp recordings from wild-type and M1R −/− D2 spiny neurons. c, d, F–I relationships of D1 and D2 wild-type and M1R −/− MSNs. Note the decrease in firing in the D2 MSN population from M1R −/− mice. e, f, I–V relationships of wild-type versus M1R −/− D1 MSNs and wild-type (wt) versus D2 MSNs. g, h, Peak current measured at −150 mV does not differ in the D1 MSNs. (D1 MSN wt: median, −1836 pA, n = 35; D1 MSN M1R −/−: median, −2045 pA, n = 14). M1R −/− D2 MSNs show increased inward currents in the absence of M1R tone (D2 MSN wt: median, −1159 pA, n = 31; D2 MSN M1R −/−: median, −1298 pA, n = 14; p < 0.05). *Statistical significance.
Another possible explanation of the differences between D1 and D2 MSNs is a dichotomy in the tonic activation of GABAA and GABAB receptors (Ade et al., 2008). The addition of gabazine (10 μm; to block GABAA receptors) and CGP55845 (1 μm; to block GABAB receptors) produced a 1–2 mV depolarization in some MSNs; however, this effect was not consistent and failed to reduce the difference between the F–I plots of D1 and D2 MSNs (n = 5, data not shown).
D1 medium spiny neurons had more primary dendrites
A straightforward explanation for the dichotomy in whole-cell capacitance and excitability of D1 and D2 MSNs is that they differ in surface area. To test this hypothesis, D1 and D2 MSNs were identified by epifluorescence in slices from BAC mice and then patched with electrodes containing biocytin (Horikawa and Armstrong, 1988). After filling, slices were processed, and recorded MSNs were reconstructed, preserving as much three-dimensional architecture as possible (Fig. 6). Dendritic length and branching pattern were measured in a population of D1 (n = 15) and D2 MSNs (n = 16). A three-dimensional (3D) Sholl analysis was performed to determine the number of dendritic processes in concentric shells centered on the soma (Fig. 7a). D1 MSNs had more intersections than D2 MSNs from 10 to 135 μm from the soma. From the 3D Sholl analysis, the cumulative dendritic length within spheres of increasing diameter was measured and averaged to determine where branching diverged (Fig. 7b). Approximately 25 μm from the soma, the difference in cumulative dendritic length reached ∼20% and remained constant (Fig. 6b). Total dendritic length was positively correlated with whole-cell capacitance (rS = 0.549, p < 0.05), confirming the expected relationship between the electrical and anatomical measurements.
Figure 6.

Reconstructions of biocytin-filled D1 and D2 MSNs. a–c, Striatal neurons from P35–P45 BAC transgenic mice were biocytin-filled, imaged, and reconstructed in three dimensions. A GABAergic interneuron is included for comparison. d, Fan-in diagrams displayed no apparent preferred orientation in either the D1 or D2 MSN populations. e, Dendrograms displaying in two dimensions the length, number, and connectivity of dendritic segments in sample neurons.
Figure 7.

Analysis of anatomical differences between reconstructed D1 and D2 MSNs. a, A three-dimensional Sholl analysis of biocytin-filled and reconstructed neurons from P35–P45 BAC transgenic mice. Data are shown as mean (±SEM) number of intersections at 1 μm eccentricities from the soma for 15 D1 and 16 D2 MSNs. D1 MSNs have a more highly branched dendritic tree, as indicated by the increased number of intersections and positive subtracted area (gray shading). b, Mean cumulative dendritic length at 1 μm eccentricities for D1 and D2 MSN populations. Bottom, Note that the percentage difference (Diff) between populations in cumulative total dendritic length increases and remains at ∼20% (arrow and fit line) within 30 μm from the soma. Inset, The total dendritic length in each cell/number of primary dendrites is not significantly different between populations (D1 MSN: median, 398.8 μm, n = 15; D2 MSN: median, 400.5 μm, n = 16). c, Whole-cell capacitance is positively correlated to total dendritic length (rS = 0.45, p < 0.05). d, D1 MSNs have significantly more primary dendrites (D1 MSN: median, 8, n = 15; D2 MSN: median, 6, n = 16; p < 0.05), branch points (D1 MSN: median, 28, n = 15; D2 MSN: median, 19, n = 16; p < 0.05), tips (D1 MSN: median, 38, n = 16; D2 MSN: median, 28, n = 15; p < 0.001), and total dendritic length (D1 MSN: median, 3385.6 μm, n = 15; D2 MSN: median, 2878.3 μm, n = 16; p < 0.001). *Statistical significance.
The difference in total dendritic length (D1 MSNs: median, 3283 μm, n = 15; D2 MSNs: median, 2532 μm, n = 16; p < 0.001) was attributable to a difference in the number of primary dendrites (D1 MSNs: median, 8, n = 15; D2 MSNs: median, 6, n = 16; p < 0.05), as the mean tree length (i.e., total dendritic length/number of primary dendrites) was similar in the two types of MSNs. To test this inference, we calculated dendritic electrotonic length from a hyperpolarizing current step (Rall, 1969, 1977; Brown et al., 1981a,b); these measurements showed that D1 and D2 MSN dendrites were indistinguishable in electrotonic length, confirming the anatomical analysis (supplemental Fig. 2, available at www.jneurosci.org as supplemental material) (D1 MSN: median, 0.6, n = 10; D2 MSN: median, 0.6, n = 11). Although the dendrites did not differ in length, D1 MSNs had significantly more branch points and tips (D1 MSNs: median, 28 branch points, 38 tips, n = 15; D2 MSNs: median, 19 branch points, 28.5 tips, n = 16; p < 0.05 for both measures); this was attributable to their having more primary dendrites. Furthermore, the mean number and length of dendritic segments as a function of branch order was not significantly different between D1 and D2 MSNs (Table 1). A convex hull analysis was used to estimate the three-dimensional space occupied by dendritic trees (this algorithm takes into account the three-dimensional space occupied by a set of dendritic processes, allowing for a more complex polygonal surface rendering than assuming a cubic or spherical distribution). D1 MSNs occupied significantly more space than D2 MSNs (Table 1), which again was attributable to the difference in the number of primary dendrites, not the branching pattern or length of the dendrites.
Table 1.
Dendritic dimensions of reconstructed D1 and D2 MSNs
| D1 MSN (n = 15) |
D2 MSN (n = 16) |
|||
|---|---|---|---|---|
| Branch order |
Number |
Length (μm) |
Number |
Length (μm) |
| 1° Dendrite | 7.8 (±0.6) | 24.8 (±1.8) | 5.9 (±0.4) | 29.9 (±2.7) |
| 2° Dendrite | 12.4 (±1.0) | 48.5 (±3.9) | 9.9 (±0.8) | 47.7 (±3.6) |
| 3° Dendrite | 15.8 (±1.3) | 55.1 (±3.9) | 11.5 (±1.0) | 57.9 (±3.4) |
| 4° Dendrite | 12.7 (±1.1) | 59.8 (±4.2) | 8.3 (±1.1) | 60.9 (±8.5) |
| 5° Dendrite | 6.9 (±0.9) | 59.9 (±5.9) | 6.3 (±0.8) | 56.0 (±4.1) |
| 6° Dendrite | 4.4 (±0.8) | 59.7 (±4.7) | 4.9 (±0.7) | 58.9 (±10.3) |
| 7° Dendrite | 5.8 (±1.2) | 47.2 (±18.3) | 5.0 (±0.6) | 58.2 (±14.2) |
| Total tree | 471.8 | 378.8 | ||
Dendritic segments of 15 D1 and 16 D2 reconstructed MSNs were compared with respect to average number per neuron and segment length (reported as mean ± SEM). The absolute number of segments per cell was significantly higher in D1 MSNs than in D2 MSNs for 1–4° branch orders, but not significant once normalized to the number of primary dendrites. The total length of a dendritic tree emerging from a single primary dendrite was not significantly different between D1 and D2 MSNs. The space occupied by D1 MSNs was significantly larger, whereas that occupied by a D1 MSN dendritic tree was not significantly different from that of a D2 MSN. The total convex hull surface for D1 MSNs was significantly larger than D2 MSNs (D1 MSN, 105.7 mm2; D2 MSN, 89.6 mm2; p < 0.05), although the area per primary dendrite was not different (D1 MSN, 8.5 mm2; D2 MSN, 12.3 mm2).
It is not obvious whether this difference in dendritic anatomy depends on intrinsic (cell autonomous) or extrinsic (environmental) factors. A simple way to begin to examine this question is to see whether the differences can be recapitulated in a simple system, such as a two-dimensional, dissociated corticostriatal culture where the normal striatal environment and the topography of cortical connections with MSNs has been disrupted. MSNs in these cultures develop a relatively normal dendritic morphology, including spines (Segal et al., 2003). MSNs cultured from P0 D2 BAC mouse striata and wild-type cerebral cortex were maintained for three weeks in vitro. Cultures were then fixed; D2 MSNs were identified by eGFP expression and D1 MSNs were identified by immunoreactivity for D1 receptors. Although the average branching pattern of D1 and D2 MSNs differed from that seen in vivo, the total dendritic length was significantly greater in D1 MSNs (supplemental Fig. 3, available at www.jneurosci.org as supplemental material) (D1 MSNs: median, 2012 μm, n = 18; D2 MSNs: median, 1422 μm, n = 15; p < 0.001), as found in brain slices.
Differences in dendritic anatomy contribute to the physiological dichotomy
To determine whether the observed differences in dendritic anatomy were sufficient to explain the variation in MSN physiology, NEURON simulations were performed. Two types of simulations were conducted. In the first series of simulations, reconstructed D1 and D2 MSNs with features near the median of each population were loaded into NEURON, and ion channels were distributed based on our previous experimental and simulation work; adjustments were made in the distal dendrites to account for the presence of spines (see Materials and Methods). With a simulated somatic patch electrode, the models were then tested as MSNs in tissue slices. For both the D1 and D2 MSN models, the whole-cell capacitance, input resistance, and rheobase were similar to those of the cells used for the reconstructions (Fig. 8a,b).
Figure 8.
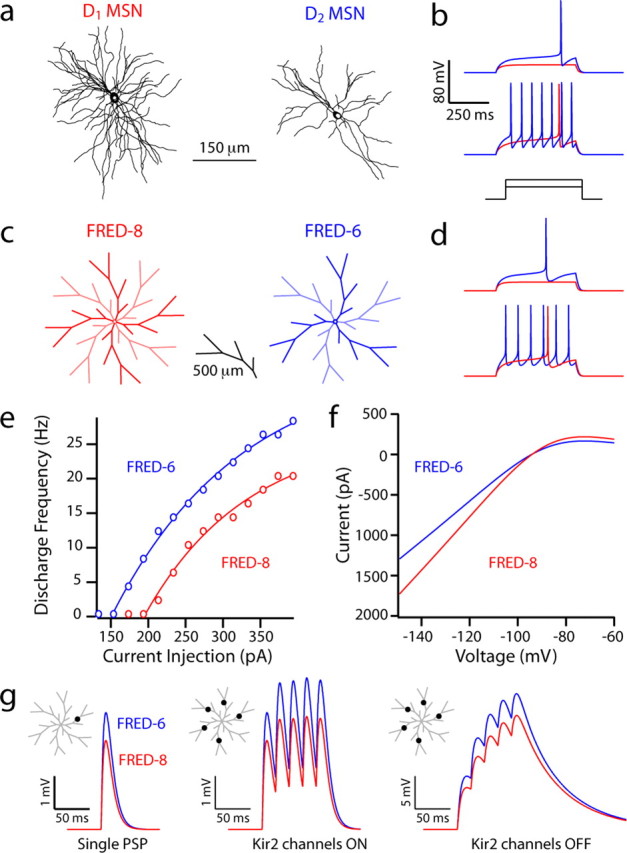
Simulations suggest that the differences in D1 and D2 MSN physiology reflect the dendritic dichotomy. a, b, NEURON models constrained to anatomical reconstructions of biocytin-filled and imaged spiny projection neurons, fit with identical channel distributions and densities, display different excitability in current-clamp simulations. The D1 MSN reconstruction model had a whole-cell capacitance of 203 pF (recorded in vitro, 209 pF) and a rheobase current of 210 pF, compared with the D2 MSN reconstruction model with a whole-cell capacitance of 182 pF (recorded in vitro, 168 pF) and a rheobase current of 160 pA. c, d, FRED NEURON models constructed with eight or six primary dendrites to simulate a D1 and D2 MSN, respectively. FRED-8 (whole-cell capacitance, 213 pF) and FRED-6 (whole-cell capacitance, 173 pF) have rheobase currents of 210 and 165 pF, respectively. e, A frequency–current plot demonstrating increased firing frequency in FRED-8 for all levels of intrasomatic current injection. f, Current–voltage relationships displaying a Kir2 current of increased amplitude in the FRED-8 model. g, Somatic depolarization in FRED-6 and FRED-8 models from an AMPA-mediated PSP to a single tertiary dendrite and to five tertiary dendrites at 50 Hz with and without Kir2 channels.
In a second set of experiments, canonical models of D1 and D2 MSNs were constructed with dendrites of a stereotyped branching structure constrained by our anatomical reconstructions, having primary dendrites with a secondary and tertiary branching structure that mimicked the prototypical D1 or D2 MSN. Again, channel densities in each compartment and nondendritic anatomical features (soma, axon initial segment, and axon) were held constant across models. These models were given the acronym FRED (Fig. 8c). The two models representing the median of the D1 and D2 MSN distributions (FRED-8 and FRED-6, respectively) differed as expected in the relative magnitude of their Kir2 channel currents, in their whole-cell capacitance, and in their rheobase currents (Fig. 8d,f). The two models also recapitulated the dichotomy of the two MSNs in their F–I relationship (Fig. 8e).
To determine the impact of the differences in dendritic anatomy on synaptic integration, simulated synapses were placed on the tertiary dendrites of each model at an identical distance from the soma (Fig. 8g). The somatic EPSP was 24% larger in the FRED-6 model than in the FRED-8 model (FRED-6, 4.2 mV; FRED-8, 3.2 mV). A similar result was obtained with a train of synaptic inputs (five impulses at 50 Hz); the difference in the EPSP amplitude was 26% (FRED-6, 5.2 mV; FRED-8, 3.9 mV). To determine how the integration of spatially distributed synaptic inputs would be affected, a single synapse was placed at the same position on five different dendrites. The difference in the somatic EPSP evoked in the two models by simultaneously activating these synapses was similar to that seen with a single synaptic location (26%), although the peak somatic depolarization was slightly larger in both models (FRED-6, 5.4 mV; FRED-8, 4.0 mV). The dendrites of the models were invested with Kir2 channels, which oppose voltage deflections and thus synaptic integration. To examine the contribution of this channel to the differences between the models, the density of this channel was reduced to zero and the simulation with the spatially distributed synapses was repeated. In this situation, somatic EPSP amplitude was increased in both models, but the difference between them remained (25% difference; FRED-6, 21.7 mV; FRED-8, 16.2 mV). We used intradendritic current steps at the same “postsynaptic site” on a tertiary dendrite to generate F–I curves, as seen from a simulated somatic electrode. The change in current injection site altered the curve of the F–I relationship in both models to a similar extent, adding support for the relationship seen with intrasomatic current injection (data not shown). To compare back-propagation of somatic spikes into dendrites, we injected near-rheobase intrasomatic current to both canonical models and found no difference in the height of the action potential in either the soma or in distal, tertiary dendrites (data not shown).
Discussion
D1 striatonigral and D2 striatopallidal MSNs have long been regarded as a single population with respect to somatodendritic morphology, regardless of differences along neurochemical or axonal dimensions (Fox et al., 1971; DiFiglia et al., 1976; Kawaguchi et al., 1989). Although parsimonious, this assumption has been difficult to test until the introduction of D1 and D2 BAC transgenic mice (Gong et al., 2003; Heintz, 2004). The capacity to distinguish MSNs without post hoc analyses (e.g., single-cell RT-PCR) has led to the discovery of unappreciated differences between these two principal populations (Day et al., 2006; Kreitzer and Malenka, 2007; Cepeda et al., 2008). Our results extend this literature, showing for the first time that there is a dichotomy in the dendritic anatomy of D1 and D2 MSNs that contributes to differences in their excitability.
Anatomical dichotomy between medium spiny neurons
Three-dimensional reconstructions of biocytin-filled MSNs revealed that the total dendritic length of D1 MSNs was significantly greater than that of D2 MSNs in adult mice. Although measures of whole-cell capacitance derived from somatic voltage steps underestimate membrane surface area, they were strongly correlated with our anatomical measures of total dendritic length. Furthermore, the number of branch points and terminal endings (“tips”) was significantly higher in D1 MSNs. However, normalizing the branching parameters (tips, intersections) by the number of primary dendrites eliminated the difference between MSNs. We also found the length of each segment and the number of segments to be the same in each primary dendritic branch, regardless of the cell type from which it emerged. These results argue that the branching structure within individual primary dendrites or branchlets is the same in the two MSN types. This conclusion was consistent with the electrotonic length equivalence of the dendritic tree in the two MSN populations (Rall, 1969, 1977; Brown et al., 1981a,b, Wilson, 1992). Thus, the difference in dendritic surface area between MSNs was not attributable to longer or more richly branched dendrites, but rather to D1 MSNs having more primary dendrites.
The more extensive dendritic arbor of D1 MSNs introduces the possibility that they receive a larger number of glutamatergic synapses than do D2 MSNs, if synaptic density is the same in each population. To our knowledge, the density of spines (the principal site of glutamatergic synapses in MSNs) is similar in D1 and D2 MSNs (cf. Day et al., 2006), although this has not been rigorously explored in older animals. Recent work suggests that synapses formed on D1 MSNs are smaller (Lei et al., 2004), raising the possibility that relatively more need to exist to achieve the same level of synaptic depolarization. However, contrary to this prediction, the distributions of glutamatergic mEPSC amplitudes in D1 and D2 MSNs are not significantly different (Kreitzer and Malenka, 2007; Cepeda et al., 2008; Ding et al., 2008). There is also the possibility that D1 MSNs integrate a broader array of glutamatergic synaptic inputs from the cerebral cortex or thalamus than do D2 MSNs (Hersch et al., 1995; Smith et al., 2004).
Mechanisms of controlling dendritic development
The factors controlling dendritic dichotomy between MSNs are unknown. A potential clue comes from recapitulation of the larger dendritic tree in D1 MSNs in corticostriatal cocultures. In these cultures, synapses formed on MSNs by cortical glutamatergic neurons induce spine formation and promote dendritic elaboration (Segal et al., 2003). This is consistent with studies in other neurons pointing to the importance of ionotropic glutamate receptors in the expansion of dendritic surface area (Rajan and Cline, 1998; Sin et al., 2002; Richards et al., 2005). Although this environment is permissive for dendritic development, it cannot reproduce the cellular specificity of glutamatergic connections onto D1 and D2 MSNs found in vivo. The retention of the dendritic dichotomy between MSNs in this environment suggests that its determinants are largely cell autonomous.
Dichotomous morphology contributes to physiological differences between D1 and D2 MSNs
As with recent studies of younger mice (Kreitzer and Malenka, 2007; Ade et al., 2008; Cepeda et al., 2008), we found a very clear difference in the excitability of striatal D1 and D2 MSNs from 5 to 6-week-old mice. Over a broad range of intrasomatic current amplitudes, D2 MSNs consistently spiked at higher frequencies than did D1 MSNs. In older MSNs, differences in resting membrane potential, input resistance, and rheobase current accompanied this difference in the F–I relationship. The physiological dichotomy was evident 3 weeks postnatally and was maintained in the oldest mice studied (10 weeks postnatal). This pattern is in agreement with previous work showing that MSN membrane properties are qualitatively established by 3 weeks postnatally (Tepper et al., 1998). Spine and asymmetric synaptic densities achieve stable densities at a similar time point (approximately the fourth postnatal week) (Wilson et al., 1983, 1992; Sharpe and Tepper, 1998). Our results suggest that although synaptic density stabilizes early, dendritic area continues to increase in both D1 and D1 MSNs for at least another 4 weeks, well past puberty into adulthood. In parallel, there are quantitative changes in physiological parameters that reflect the dendritic growth.
The physiological differences between MSNs visible with somatic current injection could not be ascribed to synaptic influences. Although it might be important in younger MSNs (Ade et al., 2008), differences in tonic GABAergic synaptic input were not significant in older MSNs. Furthermore, genetically deleting M1 muscarinic receptor signaling, which is known to target K+ channels (i.e., Kir2, Kv7 channels) that shape input resistance and the F–I relationship in MSNs (Nisenbaum and Wilson, 1995; Shen et al., 2007), reduced but did not eliminate the differences between MSNs.
The simplest explanation for the physiological dichotomy lay in the anatomical divergence of the two MSNs. Computer simulations provided clear support for this proposition. Two types of simulations were performed. Simulations using canonical MSN models with a variable number of identical dendrites (constrained by our reconstructions) were able to reproduce the basic current- and voltage-clamp properties of the two MSN populations observed experimentally. The models differed only in their dendritic morphology, having identical channel properties in each segment and standardized nondendritic components (soma, axon initial segment, and axon). To make sure that nuanced dendritic branching was not a factor, anatomical reconstructions of prototypical D1 and D2 MSNs with identical channel densities and distributions were examined. Again, the two models displayed dichotomous physiological properties that mirrored those seen experimentally. Although the models were constrained to yield inwardly rectifying K+ current amplitudes matching those recorded from neurons in the in vitro slice preparation, the dichotomous behavior of the models was relatively insensitive to absolute channel densities. A difference in the behavior of the models was seen across a spectrum of ion channel densities and kinetics.
Although the simulations suggest that differences in dendritic anatomy contribute significantly to the physiological dichotomy between D1 and D2 MSNs, there are compelling reasons to believe this is not the only way in which these neurons differ. First, the simulations were not able to recapture the magnitude of the differences in rheobase current between the two MSNs (compare Figs. 2, 8). Second, the simulations were not able to recapture the shape of the experimental F–I curves, suggesting that other factors also contribute to repetitive spiking. These features of MSN spiking may be further shaped by conductances within nondendritic regions, such as the axon initial segment (Bean, 2007). Third, recent studies of dendritic excitability suggest that somatically initiated spikes decrement more rapidly with distance from the soma in the dendrites of D1 MSNs than D2 MSNs; this difference appears attributable to asymmetries in the density of dendritic Kv4 channels (M. Day and D. J. Surmeier, unpublished observations). It is likely that future studies will identify other physiological differences between MSNs produced by variation in the expression and distribution of ion channels that help shape their physiology.
How the anatomical dichotomy between MSNs affects synaptically driven activity patterns remains to be explored. Dendritic branching pattern is a key determinant of somatic spiking (Mainen and Sejnowski, 1996), as well as forward propagation of EPSPs and back-propagation of spikes (Golding et al., 2001; Vetter et al., 2001). The similarity of dendritic branching structure in the two types of MSN significantly narrows the range of features that should be affected by the dichotomy. For example, back-propagation of spikes should not be affected by the difference in the number of primary dendrites; this inference was confirmed in our simulations. However, forward propagation of EPSPs should be sensitive to total dendritic area. In our simulations, identical synaptic events generated smaller EPSPs in D1 MSNs than D2 MSNs. Similar results were obtained when synaptic inputs were temporally or spatially summed. Not unexpectedly, injecting current into dendrites of simulated D1 MSNs was also less effective in generating repetitive spiking than in the D2 MSNs (as with intrasomatic current injection). Given this dichotomy, it is puzzling that EPSC amplitudes in D1 and D2 MSNs do not appear to differ (Kreitzer and Malenka, 2007); this raises the possibility that there are compensatory synaptic scaling mechanisms in MSNs, as in other brain neurons (Smith et al., 2003).
In summary, our results demonstrate that there is an anatomical dichotomy between D1 and D2 MSNs in adult mice that leads to a difference in their intrinsic excitability. These results have basic implications on the connectivity of these two principal MSN types and their integration of synaptic information.
Footnotes
This work was supported by National Institute of Neurological Disorders and Stroke Grant NS34696 (D.J.S.), National Institute of Mental Health Grant P50MH074866 (D.J.S.), Ruth L. Kirschstein National Research Service Award F30MH082522 (T.S.G.), and the Picower Foundation (D.J.S.). We thank Karen P. Sapporito, Josh E. Held, Yu Chen, and Xinyong Tian for excellent technical assistance.
References
- Ade KK, Janssen MJ, Ortinski PI, Vicini S. Differential tonic GABA conductances in striatal medium spiny neurons. J Neurosci. 2008;28:1185–1197. doi: 10.1523/JNEUROSCI.3908-07.2008. [DOI] [PMC free article] [PubMed] [Google Scholar]
- Balleine BW, Delgado MR, Hikosaka O. The role of the dorsal striatum in reward and decision-making. J Neurosci. 2007;27:8161–8165. doi: 10.1523/JNEUROSCI.1554-07.2007. [DOI] [PMC free article] [PubMed] [Google Scholar]
- Baranauskas G, Tkatch T, Surmeier DJ. Delayed rectifier currents in rat globus pallidus neurons are attributable to Kv2.1 and Kv3.1/3.2 K(+) channels. J Neurosci. 1999;19:6394–6404. doi: 10.1523/JNEUROSCI.19-15-06394.1999. [DOI] [PMC free article] [PubMed] [Google Scholar]
- Baranauskas G, Tkatch T, Nagata K, Yeh JZ, Surmeier DJ. Kv3.4 subunits enhance the repolarizing efficiency of Kv3.1 channels in fast-spiking neurons. Nat Neurosci. 2003;6:258–266. doi: 10.1038/nn1019. [DOI] [PubMed] [Google Scholar]
- Bean BP. The action potential in mammalian central neurons. Nat Rev Neurosci. 2007;8:451–465. doi: 10.1038/nrn2148. [DOI] [PubMed] [Google Scholar]
- Brewer GJ. Isolation and culture of adult rat hippocampal neurons. J Neurosci Methods. 1997;71:143–155. doi: 10.1016/s0165-0270(96)00136-7. [DOI] [PubMed] [Google Scholar]
- Brown TH, Fricke RA, Perkel DH. Passive electrical constants in three classes of hippocampal neurons. J Neurophysiol. 1981a;46:812–827. doi: 10.1152/jn.1981.46.4.812. [DOI] [PubMed] [Google Scholar]
- Brown TH, Perkel DH, Norris JC, Peacock JH. Electrotonic structure and specific membrane properties of mouse dorsal root ganglion neurons. J Neurophysiol. 1981b;45:1–15. doi: 10.1152/jn.1981.45.1.1. [DOI] [PubMed] [Google Scholar]
- Cepeda C, André VM, Yamazaki I, Wu N, Kleiman-Weiner M, Levine MS. Differential electrophysiological properties of dopamine D1 and D2 receptor-containing striatal medium-sized spiny neurons. Eur J Neurosci. 2008;27:671–682. doi: 10.1111/j.1460-9568.2008.06038.x. [DOI] [PubMed] [Google Scholar]
- Chan CS, Shigemoto R, Mercer JN, Surmeier DJ. HCN2 and HCN1 channels govern the regularity of autonomous pacemaking and synaptic resetting in globus pallidus neurons. J Neurosci. 2004;24:9921–9932. doi: 10.1523/JNEUROSCI.2162-04.2004. [DOI] [PMC free article] [PubMed] [Google Scholar]
- Day M, Wang Z, Ding J, An X, Ingham CA, Shering AF, Wokosin D, Ilijic E, Sun Z, Sampson AR, Mugnaini E, Deutch AY, Sesack SR, Arbuthnott GW, Surmeier DJ. Selective elimination of glutamatergic synapses on striatopallidal neurons in Parkinson disease models. Nat Neurosci. 2006;9:251–259. doi: 10.1038/nn1632. [DOI] [PubMed] [Google Scholar]
- DiFiglia M, Pasik P, Pasik T. A Golgi study of neuronal types in the neostriatum of monkeys. Brain Res. 1976;114:245–256. doi: 10.1016/0006-8993(76)90669-7. [DOI] [PubMed] [Google Scholar]
- Ding J, Peterson JD, Surmeier DJ. Corticostriatal and thalamostriatal synapses have distinctive properties. J Neurosci. 2008;28:6482–6492. doi: 10.1523/JNEUROSCI.0435-08.2008. [DOI] [PMC free article] [PubMed] [Google Scholar]
- Ericson H, Blomqvist A. Tracing of neuronal connections with cholera toxin subunit B: light and electron microscopic immunohistochemistry using monoclonal antibodies. J Neurosci Methods. 1988;24:225–235. doi: 10.1016/0165-0270(88)90167-7. [DOI] [PubMed] [Google Scholar]
- Fox CA, Andrade AN, Hillman DE, Schwyn RC. The spiny neurons in the primate striatum: a Golgi and electron microscopic study. J Hirnforsch. 1971;13:181–201. [PubMed] [Google Scholar]
- Gerfen CR, Young WS., 3rd Distribution of striatonigral and striatopallidal peptidergic neurons in both patch and matrix compartments: an in situ hybridization histochemistry and fluorescent retrograde tracing study. Brain Res. 1988;460:161–167. doi: 10.1016/0006-8993(88)91217-6. [DOI] [PubMed] [Google Scholar]
- Gerfen CR, Engber TM, Mahan LC, Susel Z, Chase TN, Monsma FJ, Jr, Sibley DR. D1 and D2 dopamine receptor-regulated gene expression of striatonigral and striatopallidal neurons. Science. 1990;250:1429–1432. doi: 10.1126/science.2147780. [DOI] [PubMed] [Google Scholar]
- Golding NL, Kath WL, Spruston N. Dichotomy of action-potential backpropagation in CA1 pyramidal neuron dendrites. J Neurophysiol. 2001;86:2998–3010. doi: 10.1152/jn.2001.86.6.2998. [DOI] [PubMed] [Google Scholar]
- Gong S, Zheng C, Doughty ML, Losos K, Didkovsky N, Schambra UB, Nowak NJ, Joyner A, Leblanc G, Hatten ME, Heintz N. A gene expression atlas of the central nervous system based on bacterial artificial chromosomes. Nature. 2003;425:917–925. doi: 10.1038/nature02033. [DOI] [PubMed] [Google Scholar]
- Heintz N. Gene expression nervous system atlas (GENSAT) Nat Neurosci. 2004;7:483. doi: 10.1038/nn0504-483. [DOI] [PubMed] [Google Scholar]
- Hersch SM, Ciliax BJ, Gutekunst CA, Rees HD, Heilman CJ, Yung KK, Bolam JP, Ince E, Yi H, Levey AI. Electron microscopic analysis of D1 and D2 dopamine receptor proteins in the dorsal striatum and their synaptic relationships with motor corticostriatal afferents. J Neurosci. 1995;15:5222–5237. doi: 10.1523/JNEUROSCI.15-07-05222.1995. [DOI] [PMC free article] [PubMed] [Google Scholar]
- Hines ML, Carnevale NT. The NEURON simulation environment. Neural Comput. 1997;9:1179–1209. doi: 10.1162/neco.1997.9.6.1179. [DOI] [PubMed] [Google Scholar]
- Hines ML, Carnevale NT. NEURON: a tool for neuroscientists. Neuroscientist. 2001;7:123–135. doi: 10.1177/107385840100700207. [DOI] [PubMed] [Google Scholar]
- Horikawa K, Armstrong WE. A versatile means of intracellular labeling: injection of biocytin and its detection with avidin conjugates. J Neurosci Methods. 1988;25:1–11. doi: 10.1016/0165-0270(88)90114-8. [DOI] [PubMed] [Google Scholar]
- Jack JJ, Larkman AU, Major G, Mason AJR, Stratford KJ. Simplified representations and compartmental modeling of cortical pyramidal neurones. J Physiol. 1989;417:3P. [Google Scholar]
- Jiang ZG, North RA. Membrane properties and synaptic responses of rat striatal neurones in vitro. J Physiol. 1991;443:533–553. doi: 10.1113/jphysiol.1991.sp018850. [DOI] [PMC free article] [PubMed] [Google Scholar]
- Kawaguchi Y, Wilson CJ, Emson PC. Intracellular recording of identified neostriatal patch and matrix spiny cells in a slice preparation preserving cortical inputs. J Neurophysiol. 1989;62:1052–1068. doi: 10.1152/jn.1989.62.5.1052. [DOI] [PubMed] [Google Scholar]
- Kawaguchi Y, Wilson CJ, Emson PC. Projection subtypes of rat neostriatal matrix cells revealed by intracellular injection of biocytin. J Neurosci. 1990;10:3421–3438. doi: 10.1523/JNEUROSCI.10-10-03421.1990. [DOI] [PMC free article] [PubMed] [Google Scholar]
- Khaliq ZM, Gouwens NW, Raman IM. The contribution of resurgent sodium current to high-frequency firing in Purkinje neurons: an experimental and modeling study. J Neurosci. 2003;23:4899–4912. doi: 10.1523/JNEUROSCI.23-12-04899.2003. [DOI] [PMC free article] [PubMed] [Google Scholar]
- Koos T, Tepper JM, Wilson CJ. Comparison of IPSCs evoked by spiny and fast-spiking neurons in the neostriatum. J Neurosci. 2004;24:7916–7922. doi: 10.1523/JNEUROSCI.2163-04.2004. [DOI] [PMC free article] [PubMed] [Google Scholar]
- Kreitzer AC, Malenka RC. Endocannabinoid-mediated rescue of striatal LTD and motor deficits in Parkinson's disease models. Nature. 2007;445:643–647. doi: 10.1038/nature05506. [DOI] [PubMed] [Google Scholar]
- Larkman AU, Major G, Stratford KJ, Jack JJ. Dendritic morphology of pyramidal neurones of the visual cortex of the rat. IV: Electrical geometry. J Comp Neurol. 1992;323:137–152. doi: 10.1002/cne.903230202. [DOI] [PubMed] [Google Scholar]
- Lei W, Jiao Y, Del Mar N, Reiner A. Evidence for differential cortical input to direct pathway versus indirect pathway striatal projection neurons in rats. J Neurosci. 2004;24:8289–8299. doi: 10.1523/JNEUROSCI.1990-04.2004. [DOI] [PMC free article] [PubMed] [Google Scholar]
- Le Moine C, Normand E, Bloch B. Phenotypical characterization of the rat striatal neurons expressing the D1 dopamine receptor gene. Proc Natl Acad Sci U S A. 1991;88:4205–4209. doi: 10.1073/pnas.88.10.4205. [DOI] [PMC free article] [PubMed] [Google Scholar]
- Mainen ZF, Sejnowski TJ. Influence of dendritic structure on firing pattern in model neocortical neurons. Nature. 1996;382:363–366. doi: 10.1038/382363a0. [DOI] [PubMed] [Google Scholar]
- Migliore M, Cook EP, Jaffe DB, Turner DA, Johnston D. Computer simulations of morphologically reconstructed CA3 hippocampal neurons. J Neurophysiol. 1995;73:1157–1168. doi: 10.1152/jn.1995.73.3.1157. [DOI] [PubMed] [Google Scholar]
- Nisenbaum ES, Wilson CJ. Potassium currents responsible for inward and outward rectification in rat neostriatal spiny projection neurons. J Neurosci. 1995;15:4449–4463. doi: 10.1523/JNEUROSCI.15-06-04449.1995. [DOI] [PMC free article] [PubMed] [Google Scholar]
- Onn SP, Berger TW, Grace AA. Identification and characterization of striatal cell subtypes using in vivo intracellular recording and dye-labeling in rats: III. Morphological correlates and compartmental localization. Synapse. 1994;16:231–254. doi: 10.1002/syn.890160308. [DOI] [PubMed] [Google Scholar]
- Ragsdale CW, Jr, Graybiel AM. The fronto-striatal projection in the cat and monkey and its relationship to inhomogeneities established by acetylcholinesterase histochemistry. Brain Res. 1981;208:259–266. doi: 10.1016/0006-8993(81)90556-4. [DOI] [PubMed] [Google Scholar]
- Rajan I, Cline HT. Glutamate receptor activity is required for normal development of tectal cell dendrites in vivo. J Neurosci. 1998;18:7836–7846. doi: 10.1523/JNEUROSCI.18-19-07836.1998. [DOI] [PMC free article] [PubMed] [Google Scholar]
- Rall W. Time constants and electrotonic length of membrane cylinders and neurons. Biophys J. 1969;9:1483–1508. doi: 10.1016/S0006-3495(69)86467-2. [DOI] [PMC free article] [PubMed] [Google Scholar]
- Rall W. Core conductor theory and cable properties of neurons. In: Brookhart JM, Mountcastle VB, editors. The nervous system. Bethesda, MD: Am Physiological Society; 1977. pp. 39–97. [Google Scholar]
- Richards DA, Mateos JM, Hugel S, de Paola V, Caroni P, Gähwiler BH, McKinney RA. Glutamate induces the rapid formation of spine head protrusions in hippocampal slice cultures. Proc Natl Acad Sci U S A. 2005;102:6166–6171. doi: 10.1073/pnas.0501881102. [DOI] [PMC free article] [PubMed] [Google Scholar]
- Schultz W. Behavioral theories and the neurophysiology of reward. Annu Rev Psychol. 2006;57:87–115. doi: 10.1146/annurev.psych.56.091103.070229. [DOI] [PubMed] [Google Scholar]
- Segal M, Greenberger V, Korkotian E. Formation of dendritic spines in cultured striatal neurons depends on excitatory afferent activity. Eur J Neurosci. 2003;17:2573–2585. doi: 10.1046/j.1460-9568.2003.02696.x. [DOI] [PubMed] [Google Scholar]
- Sharpe NA, Tepper JM. Postnatal development of excitatory synaptic input to the rat neostriatum: an electron microscopic study. Neuroscience. 1998;84:1163–1175. doi: 10.1016/s0306-4522(97)00583-6. [DOI] [PubMed] [Google Scholar]
- Shen W, Hernandez-Lopez S, Tkatch T, Held JE, Surmeier DJ. Kv1.2-containing K+ channels regulate subthreshold excitability of striatal medium spiny neurons. J Neurophysiol. 2004;91:1337–1349. doi: 10.1152/jn.00414.2003. [DOI] [PubMed] [Google Scholar]
- Shen W, Hamilton SE, Nathanson NM, Surmeier DJ. Cholinergic suppression of KCNQ channel currents enhances excitability of striatal medium spiny neurons. J Neurosci. 2005;25:7449–7458. doi: 10.1523/JNEUROSCI.1381-05.2005. [DOI] [PMC free article] [PubMed] [Google Scholar]
- Shen W, Tian X, Day M, Ulrich S, Tkatch T, Nathanson NM, Surmeier DJ. Cholinergic modulation of Kir2 channels selectively elevates dendritic excitability in striatopallidal neurons. Nat Neurosci. 2007;10:1458–1466. doi: 10.1038/nn1972. [DOI] [PubMed] [Google Scholar]
- Shuen JA, Chen M, Gloss B, Calakos N. Drd1a-tdTomato BAC transgenic mice for simultaneous visualization of medium spiny neurons in the direct and indirect pathways of the basal ganglia. J Neurosci. 2008;28:2681–2685. doi: 10.1523/JNEUROSCI.5492-07.2008. [DOI] [PMC free article] [PubMed] [Google Scholar]
- Sin WC, Haas K, Ruthazer ES, Cline HT. Dendrite growth increased by visual activity requires NMDA receptor and Rho GTPases. Nature. 2002;419:475–480. doi: 10.1038/nature00987. [DOI] [PubMed] [Google Scholar]
- Smith MA, Ellis-Davies GC, Magee JC. Mechanism of the distance-dependent scaling of Schaffer collateral synapses in rat CA1 pyramidal neurons. J Physiol. 2003;548:245–258. doi: 10.1113/jphysiol.2002.036376. [DOI] [PMC free article] [PubMed] [Google Scholar]
- Smith Y, Raju DV, Pare JF, Sidibe M. The thalamostriatal system: a highly specific network of the basal ganglia circuitry. Trends Neurosci. 2004;27:520–527. doi: 10.1016/j.tins.2004.07.004. [DOI] [PubMed] [Google Scholar]
- Surmeier DJ, Eberwine J, Wilson CJ, Cao Y, Stefani A, Kitai ST. Dopamine receptor subtypes colocalize in rat striatonigral neurons. Proc Natl Acad Sci U S A. 1992;89:10178–10182. doi: 10.1073/pnas.89.21.10178. [DOI] [PMC free article] [PubMed] [Google Scholar]
- Surmeier DJ, Song WJ, Yan Z. Coordinated expression of dopamine receptors in neostriatal medium spiny neurons. J Neurosci. 1996;16:6579–6591. doi: 10.1523/JNEUROSCI.16-20-06579.1996. [DOI] [PMC free article] [PubMed] [Google Scholar]
- Tepper JM, Sharpe NA, Koós TZ, Trent F. Postnatal development of the rat neostriatum: electrophysiological, light- and electron-microscopic studies. Dev Neurosci. 1998;20:125–145. doi: 10.1159/000017308. [DOI] [PubMed] [Google Scholar]
- Tkatch T, Baranauskas G, Surmeier DJ. Kv4.2 mRNA abundance and A-type K(+) current amplitude are linearly related in basal ganglia and basal forebrain neurons. J Neurosci. 2000;20:579–588. doi: 10.1523/JNEUROSCI.20-02-00579.2000. [DOI] [PMC free article] [PubMed] [Google Scholar]
- Uchimura N, Cherubini E, North RA. Inward rectification in rat nucleus accumbens neurons. J Neurophysiol. 1989;62:1280–1286. doi: 10.1152/jn.1989.62.6.1280. [DOI] [PubMed] [Google Scholar]
- Vetter P, Roth A, Häusser M. Propagation of action potentials in dendrites depends on dendritic morphology. J Neurophysiol. 2001;85:926–937. doi: 10.1152/jn.2001.85.2.926. [DOI] [PubMed] [Google Scholar]
- Wang J, Chen S, Nolan MF, Siegelbaum SA. Activity-dependent regulation of HCN pacemaker channels by cyclic AMP: signaling through dynamic allosteric coupling. Neuron. 2002;36:451–461. doi: 10.1016/s0896-6273(02)00968-6. [DOI] [PubMed] [Google Scholar]
- Wang Z, Kai L, Day M, Ronesi J, Yin HH, Ding J, Tkatch T, Lovinger DM, Surmeier DJ. Dopaminergic control of corticostriatal long-term synaptic depression in medium spiny neurons is mediated by cholinergic interneurons. Neuron. 2006;50:443–452. doi: 10.1016/j.neuron.2006.04.010. [DOI] [PubMed] [Google Scholar]
- Wickens JR, Wilson CJ. Regulation of action-potential firing in spiny neurons of the rat neostriatum in vivo. J Neurophysiol. 1998;79:2358–2364. doi: 10.1152/jn.1998.79.5.2358. [DOI] [PubMed] [Google Scholar]
- Wilson CJ. Dendritic Morphology, Inward Rectification and the Functional Properties of Neostriatal Neurons. In: McKenna T, Davis J, Zornetzer SF, editors. Single Neuron Computation. San Diego: Academic; 1992. pp. 141–171. [Google Scholar]
- Wilson CJ, Groves PM, Kitai ST, Linder JC. Three-dimensional structure of dendritic spines in the rat neostriatum. J Neurosci. 1983;3:383–388. doi: 10.1523/JNEUROSCI.03-02-00383.1983. [DOI] [PMC free article] [PubMed] [Google Scholar]
- Wilson CJ, Mastronarde DN, McEwen B, Frank J. Measurement of neuronal surface area using high-voltage electron microscope tomography. Neuroimage. 1992;1:11–22. doi: 10.1016/1053-8119(92)90004-7. [DOI] [PubMed] [Google Scholar]