Abstract
Bursting oscillations are common in neurons and endocrine cells. One type of bursting model with two slow variables has been called ‘phantom bursting’ since the burst period is a blend of the time constants of the slow variables. A phantom bursting model can produce bursting with a wide range of periods: fast (short period), medium, and slow (long period). We describe a measure, which we call the ‘dominance factor’, of the relative contributions of the two slow variables to the bursting produced by a simple phantom bursting model. Using this tool, we demonstrate how the control of different phases of the burst can be shifted from one slow variable to another by changing a model parameter. We then show that the dominance curves obtained as a parameter is varied can be useful in making predictions about the resetting properties of the model cells. Finally, we demonstrate two mechanisms by which phase-independent resetting of a burst can be achieved, as has been shown to occur in the electrical activity of pancreatic islets.
Keywords: Bursting, Multi-scale, Islet, Oscillations
1 Introduction
Bursting oscillations, episodes of electrical activity followed by quiescence, are common in neurons and endocrine cells. Many mathematical models for bursting cells have been developed (Coombes & Bressloff, 2005), and singular geometric perturbation analysis (also called fast/slow analysis) has proven to be very useful in the analysis of such models (Rinzel, 1987; Rinzel & Ermentrout, 1989). This makes use of the separation of times scales between those variables that change rapidly (the fast variables) and those that change slowly (the slow variables). Many models contain a single slow variable, for example, (Butera et al., 1999; Chay & Keizer, 1983), while others contain two or more slow variables, for example, (Bertram & Sherman, 2004; Rinzel & Lee, 1987). One type of bursting model with two slow variables produces phantom bursting, so named because the burst period can be a blend of the slow variables (Bertram et al., 2000); therefore, the search for a single slow process with time constant similar to the burst period in experimental studies would be fruitless.
In the phantom bursting model described in (Bertram et al., 2000) there are two slow variables, s1 and s2, with very different time constants, τs2 >> τs1. As a result, s2 changes appreciably slower than s1. Depending on the values of other parameters, the bursting that is produced may be fast (short period), driven by s1; slow, driven by s2; or medium, driven by a combination of both slow variables. In pancreatic β-cells, the cells for which the model was developed, s1 could correspond to the fraction of K+ channels activated by cytosolic Ca2+ and s2 to the fraction of ATP-sensitive K+ channels activated by the ratio of ADP to ATP or to the Ca2+ concentration in the endoplasmic reticulum (Bertram & Sherman, 2004).
Phantom bursting has been analyzed using fast/slow analysis to understand the mechanism of bursting and the wide range of burst periods that can be produced (Bertram et al., 2000; Bertram & Sherman, 2004, 2005). While this analysis clarified why the different slow variables control the fast or slow bursting and how the two work together to produce medium bursting, the relative contributions of the two slow variables to the generation of the medium bursting was not determined. That is, for a given medium bursting pattern, it was never determined quantitatively how much s1 contributed to the burst period and how much s2 contributed. In this article, we describe a measure, which we call the dominance factor, of the relative contributions of the two slow variables to the bursting produced by the phantom bursting model described in (Bertram et al., 2000). Since the contributions of the variables may be different during the active and silent phases of bursting, we compute dominance factors for both phases. Using this tool, we demonstrate how the control of different phases of the burst can be shifted from one slow variable to another by changing a model parameter. We then show that the dominance factor curves obtained as a parameter is varied can be useful for making predictions about the resetting properties of the model cells.
One feature of bursting driven by a single slow variable is that it is possible to reset the oscillation from the silent to active phase, or vice versa, with a sufficiently large perturbation. The phase that follows the reset should be shorter than normal, since the slow variable has not had time to reach its typical starting point for that phase. Resetting experiments were performed on intact pancreatic islets by Cook and associates (Cook et al., 1981) to test these predictions. They found that resetting was indeed possible, but that the phase following the reset was often of full length. That is, for most silent-active resets the following active phase was no shorter than normal, and for most active-silent resets the following silent phase was of full duration. We refer to these as full-length resets. Full-length resets in both directions (bidirectional full-length resets) were shown in the same islet in one case (Figs. 3 and 4 in (Cook et al., 1981)). A later study showed full-length silent-active resets, but short active-silent resets (Zimliki et al., 2003). The existence of a full-length reset in either direction indicates that the bursting is driven by more than one slow variable. But how? We demonstrate that a full-length reset can be produced if one slow variable determines the silent phase duration while the other slow variable determines the active phase duration. This explanation was postulated earlier (Smolen & Sherman, 1994) and demonstrated with a β-cell model in which the time constants were adjusted so that one slow variable changes rapidly during the silent phase (so that the other slow variable controls the silent phase duration), and vice-versa for the active phase. We use a similar approach to account for cases where full-length resets occur in both directions. However, unidirectional full-length resets can be accounted for with the phantom bursting model by simply adjusting a system parameter so that the dominance curves for the active and silent phases are well separated. We illustrate this, and the case of bidirectional full-length resets, later. Thus, the dominance factor is both a tool for understanding the dynamics of fast/slow systems with two slow processes and a practical tool for making testable predictions.
Figure 3.
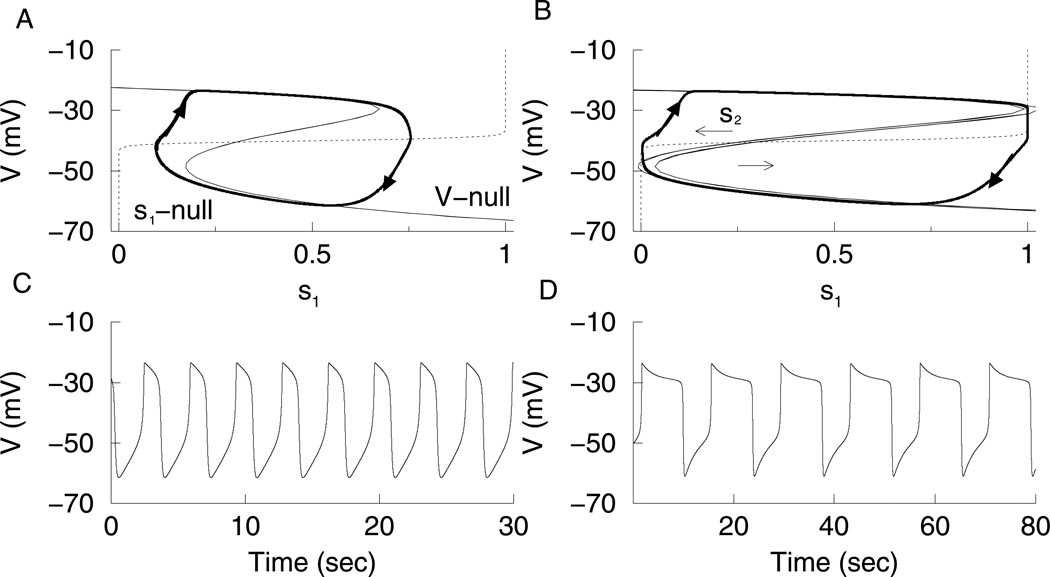
Phase plane analysis of fast and medium relaxation oscillations. (A) The V-nullcline (z-shaped curve) and s1-nullcline (dotted curve) for fast oscillations with gs1 = 40 pS and s2 fixed at 0.436. The trajectory (heavy solid curve) follows the upper and lower branches of the V-nullcline. (B) The V-nullcline and s1-nullcline for medium oscillations with gs1 = 20 pS. The V-nullcline on the left has s2 at it maximum value (0.619), while the V-nullcline on the right has s2 at its minimum value (0.591). (C) Fast relaxation oscillations driven by s1. (D) Medium relaxation oscillations driven by s1 and s2.
Figure 4.
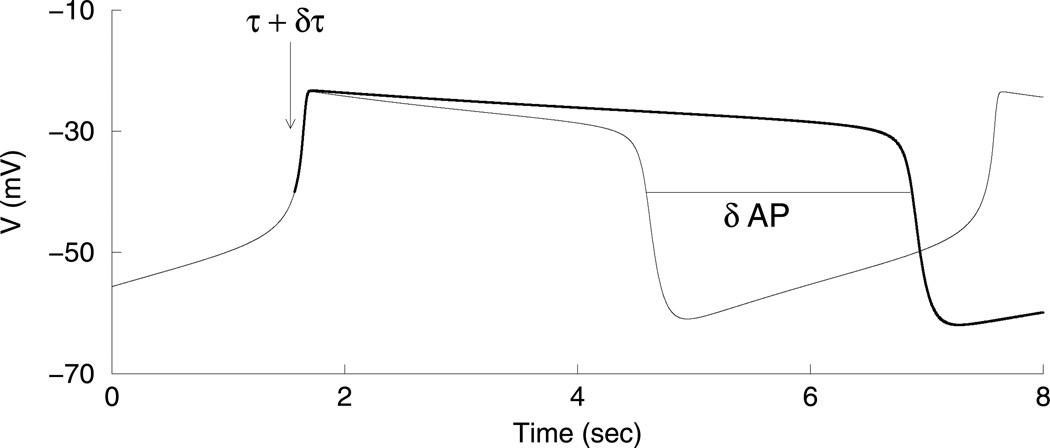
Measuring the effect of a slow variable on the duration of the active phase. The time constant of the slow variable, τ, is increased by δτ at the beginning of the active phase (arrow). This causes the slow variable to slow down and the active phase duration to increase by δAP (bold curve).
2 Generic Phantom Bursting Model
The generic phantom bursting model for pancreatic β-cells is composed of fast and slow subsystems (Bertram et al., 2000). The fast subsystem consists of the cell’s plasma membrane potential (V) and the activation variable (n) for the delayed rectifier K+ current. The slow subsystem consists of two distinct slow negative feedback variables, s1 and s2. These are activation variables for slowly activating K+ currents Is1 and Is2, respectively. Both s1 and s2 are slow in relation to V and n, which operate on a time scale of tens of milliseconds. However, the s1 variable, with time constant τs1 = 1 sec, is considerably faster than s2 with τs2 = 2 min.
The model equations are:
| (1) |
| (2) |
| (3) |
| (4) |
with ionic currents:
| (5) |
| (6) |
| (7) |
ICa is an inward Ca2+ current that activates very rapidly (assumed instantaneous), IK is a rapidly activating outward K+ current, and IL is a leak current. Cm is the membrane capacitance of the cell. The g parameters are the maximum current conductances, and VCa, VK, and VL are the reversal potentials. The activation curves for m, n, s1, and s2 are sigmoidal Boltzman functions, which increase with membrane potential:
| (8) |
| (9) |
The only voltage-dependent time constant is τn:
| (10) |
As V is varied over the interval [−55,−20] mV, τn ranges from 6.2 to 9.0 msec. The fast subsystem governs spiking during the active phase of a burst, while the slow subsystem controls when the spiking is turned on and off. The spiking activity causes s1 and s2 to slowly increase. When these variables are sufficiently large, Is1 and Is2 suppress the action potentials, and the cell returns to a hyperpolarized silent state. Model equations were solved numerically using the CVODE algorithm implemented in the XPPAUT software package (Ermentrout, 2002). Bifurcation diagrams were also computed with XPPAUT. Computer codes are available as freeware from www.math.fsu.edu/~bertram/software/islet.
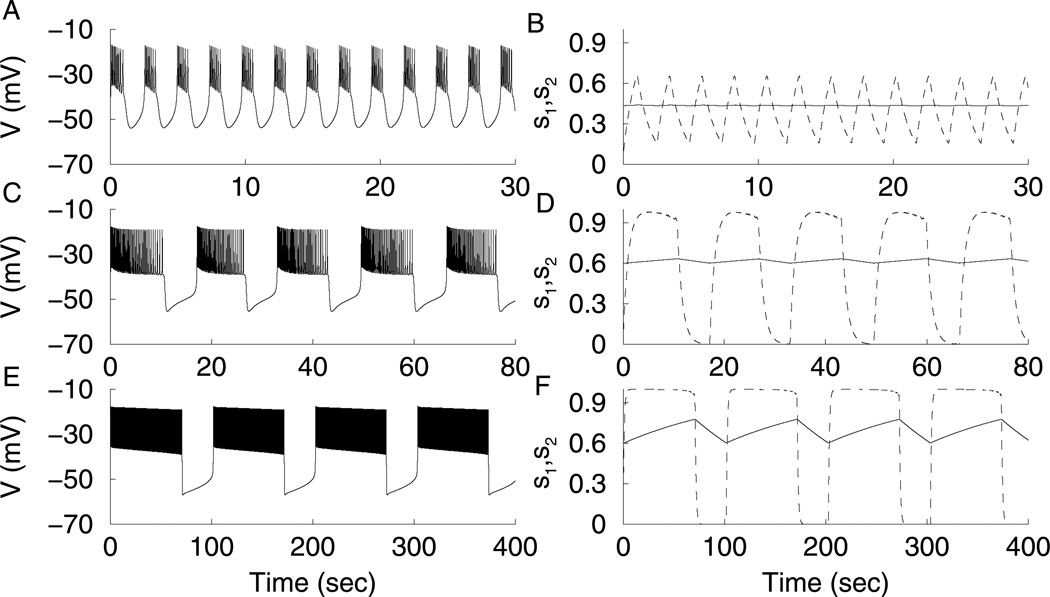
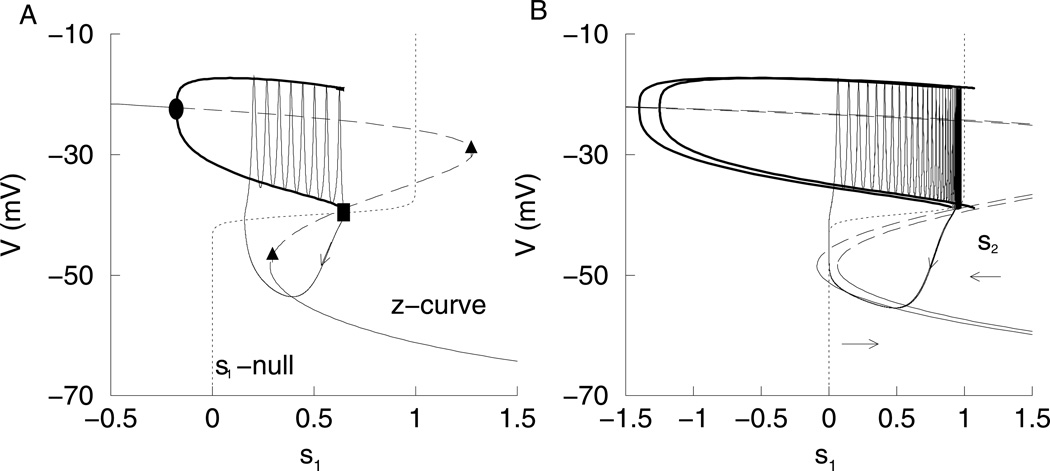
When the Is1 conductance (gs1) is large, bursting is driven by s1. Since τs1 = 1 sec, the burst period is only a few seconds (Fig. 1A). For this fast bursting, s2 is almost constant, while s1 varies with a sawtooth pattern (Fig. 1B). In fact, if s2 is clamped at its average value, the bursting continues almost unaltered. To analyze the bursting, we performed a fast/slow analysis. The s1 variable is treated as the bifurcation parameter for the fast subsystem with s2 held constant at its average value. The fast subsystem bifurcation diagram, or z-curve, is shown in Fig. 2A. The stationary solutions form the z-curve. The solid part of the curve represents the stable solutions, and the dashed part represents unstable solutions. There are two saddle node bifurcations (triangle) where the curve folds. A branch of periodic solutions emerges from a Hopf bifurcation (circle) and represents action potentials (both minimum and maximum voltage are indicated). The periodic branch terminates at an infinite-period homoclinic bifurcation (square). The burst trajectory is superimposed over the z-curve showing the system dynamics, with s1 no longer treated as a parameter. The z-curve now plays the role of a generalized V-nullcline, and the s1-nullcline is added to the figure. During the silent phase, the burst trajectory follows the bottom of the z-curve, moving leftward, since it is to the right of the s1-nullcline. Once the lower knee is reached, the phase point moves to the only attractor, the periodic branch that represents the spiking phase of the burst. Since it is now to the left of the s1-nullcline, it moves rightward until the homoclinic bifurcation is reached, at which time the phase point returns to the bottom branch to restart the silent phase.
Figure 1.
(A) Fast bursting, gs1 = 20 pS. (B) Bursting is driven by s1 (dashed), while s2 is nearly constant (solid). (C,D) Medium bursting driven by both s1 and s2, gs1 = 7 pS. (E, F) Slow bursting, is driven by s2, gs1 = 2 pS.
Figure 2.
(A) Fast subsystem bifurcation diagram of fast bursting (gs1 = 20 pS) with s1 as the bifurcation parameter and s2 = 0.436. The s1-nullcline and burst trajectory are superimposed on the bifurcation diagram. The circle represents a Hopf bifurcation, the square represents a homoclinic bifurcation, and the triangles represent saddle node bifurcations. (B) Fast/slow analysis of medium bursting (gs1 = 7 pS). There are two bifurcation diagrams with s1 as the bifurcation parameter. The curve on the left has s2 fixed at its maximum value (0.633) achieved during the bursting, while the curve on the right has s2 fixed at is minimum value (0.600). The burst trajectory is superimposed on the diagram. Arrows indicate direction of movement of the z-curve driven by variations in s2.
When gs1 is lowered, variations in Is1 are insufficient to move the system between active and silent phases. This requires a contribution from Is2. During the active phase, s2 slowly increases and slowly decreases during the silent phase (Fig. 1D), increasing and decreasing the current, respectively. Medium bursting is produced (Fig. 1C) with period influenced by both s1 and s2. If s2 is clamped, the bursting is replaced by a steady-state solution or continuous spiking. If s1 is clamped, the burst period greatly increases. Fig. 2B shows two z-curves for medium bursting. The curve on the left has s2 fixed at its maximum value achieved during a burst, while the curve on the right has s2 fixed at its minimum value. During the active phase of a burst, the phase point gets caught at the intersection of the periodic branch with the s1-nullcline. As s2 increases, the z-curve shifts to the left so the homoclinic bifurcation terminating the periodic branch moves past the nullcline. The trajectory then enters the silent phase. While in the silent phase, the phase point gets caught at the intersection of the bottom branch of the z-curve with the s1-nullcline. The burst period is determined both by the time required for the phase point to move along the z-curve (controlled by the s1 dynamics) and the time required to translate the z-curve and periodic branch back and forth (controlled by the s2 dynamics). Our analysis aims to quantify these contributions.
Further reduction in gs1 leads to a further increase in the burst period. Bursting is now solely driven by s2 (Fig. 1E). Since τs2 = 2 min, the burst period is nearly 2 min. The s1 time course is a square wave, characteristic of the fast variable in a relaxation oscillation. In fact, s1 is part of the fast subsystem. While s1 plateaus at its highest value during the active phase, s2 varies with a sawtooth pattern (Fig. 1F). In the extreme cases where gs1 is very big or very small, we can say that bursting is fast or slow based on the period of oscillations. However, it is difficult to define precisely where the transition occurs from fast to medium and from medium to slow bursting. Using the method of quantification described later, we will be able to define these transitions.
The generic phantom bursting model can be reduced to a phantom relaxation oscillator by making the activation kinetics of the delayed rectifier current instantaneous. That is, n = n∞(V) in Eq. 5. This replaces the spikes of an active phase of bursting with a depolarized voltage plateau. When gs1 is large, a fast relaxation oscillation is produced, which is driven by s1. This can be analyzed in the s1-V plane, with s2 held constant at its average value. In Fig. 3A, the solid z-shaped curve is the V-nullcline, given by:
| (11) |
The s1-nullcline is the dotted curve in Fig. 3A and is given by:
| (12) |
As in Fig. 2A the s1-nullcline intersects the z-shaped curve, now the V-nullcline, on the middle branch, and the full-system equilibrium is unstable. The phase point travels along the bottom branch during the silent phase and the top branch during the depolarized phase. This is a standard relaxation oscillation (Fig. 3C). When gs1 is reduced the relaxation oscillation is driven by both s1 and s2 (Fig. 3D). As in Fig. 2B, in the s1-V plane, the V-nullcline moves with changes in s2 to end the active and silent phases (Fig. 3B). In fact, Eq. (11) makes it evident that increasing s2 translates the V-nullcline leftward.
3 Method of Quantification
We now develop a method for quantifying the contribution that each slow variable makes to the active and silent phases of the oscillation. We begin with the phantom relaxation oscillation and rely on the fact that activity is terminated and restarted as the slow variables increase during the active phase and decrease during the silent phase. The method is illustrated in Fig. 4. At the beginning of the active phase (AP) of a relaxation oscillation the time constant, τ, for one of the slow variables is increased by δτ. This slows down the slow variable, so if slow variation of this variable contributes to the termination of the active phase, the active phase should increase by δAP. The larger the slow variable’s contribution to the active phase duration, the larger δAP. If the variable has no influence on the active phase duration, then slowing it down will give δAP =0. The procedure is repeated for the second slow variable and the silent phase (SP). Note that we perturb only one variable’s time constant at a time, at the very beginning of a phase, and only look at how this perturbation affects that phase. We do not let the system equilibrate after a time constant is changed, because then both variables will vary over a slightly different range than before the perturbation. This change in the range of variations of the slow variables may also lead to a change in the AP and SP durations, compounding the effect of the original perturbation in time constant.
We consider the system to be in the active phase when V > −40 mV and to be in the silent phase when V < −40 mV. Now, a measure of the contribution of s1 to the duration of the active phase is given by δAPs1/δτs1, an approximation to the derivative of the AP duration with respect to τs1. Then, the normalized contribution of s1 to the AP duration is given by
| (13) |
With defined in this way, if s1 is the only slow variable contributing to the duration of the AP, an increase in τs1 of 5% so that δτs1/τs1 = 0.05 would result in an increase in AP of 5% so that δAPs1/AP = 0.05, and therefore . If s1 has no effect on the active phase duration, then . In most cases both s1 and s2 will contribute, so . Similarly, we can quantify the effect that s1 has on the silent phase duration by increasing the time constant at the beginning of the SP and measuring the effect that it has on the SP. Thus, we have
| (14) |
Likewise, we use the same technique on the s2 variable to obtain:
| (15) |
| (16) |
By comparing , we can evaluate the respective contributions of s1 and s2 to AP and SP durations. This is facilitated by using a measure we call the dominance factor (DF) for each phase:
| (17) |
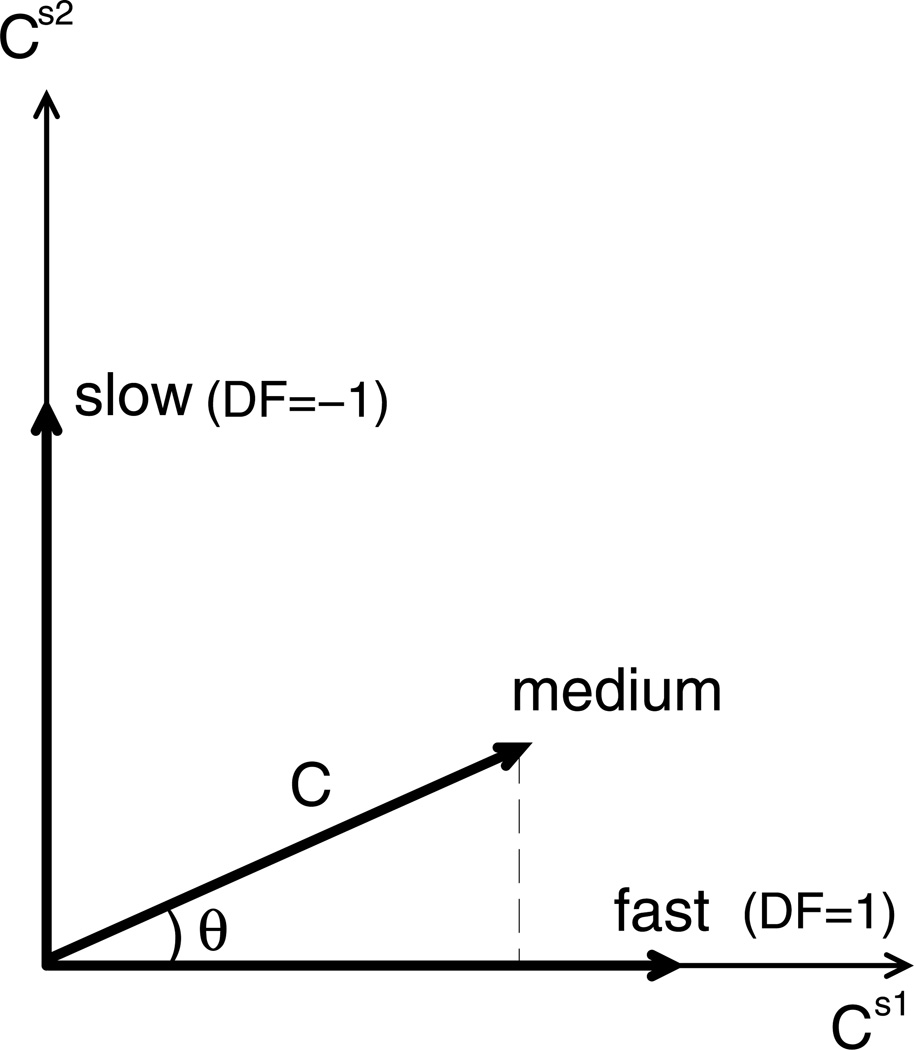
Defined in this way, the dominance factor has a trigonometric interpretation in the Cs1 − Cs2 plane (Fig. 5). The length of the vector C⃗= (Cs1,Cs2) is . Then, Cs1 = |C⃗| cos θ, Cs2 = |C⃗| sin θ, and from Eq. (17), DF = cos θ−sin θ. When s1 dominates θ = 0 and DF = 1, and when s2 dominates and DF = −1. For all θ between 0 and , DF is between these two extremes. The DF can go outside of this range if either Cs1 or Cs2 is negative (as discussed later).
Figure 5.
Interpretation of the dominance factor, DF = cosθ−sinθ. When θ = 0, DF = 1 and the oscillation is fast. When , DF = −1 and the oscillation is slow. Medium frequency oscillations occur when and DF ∈ (−1, 1).
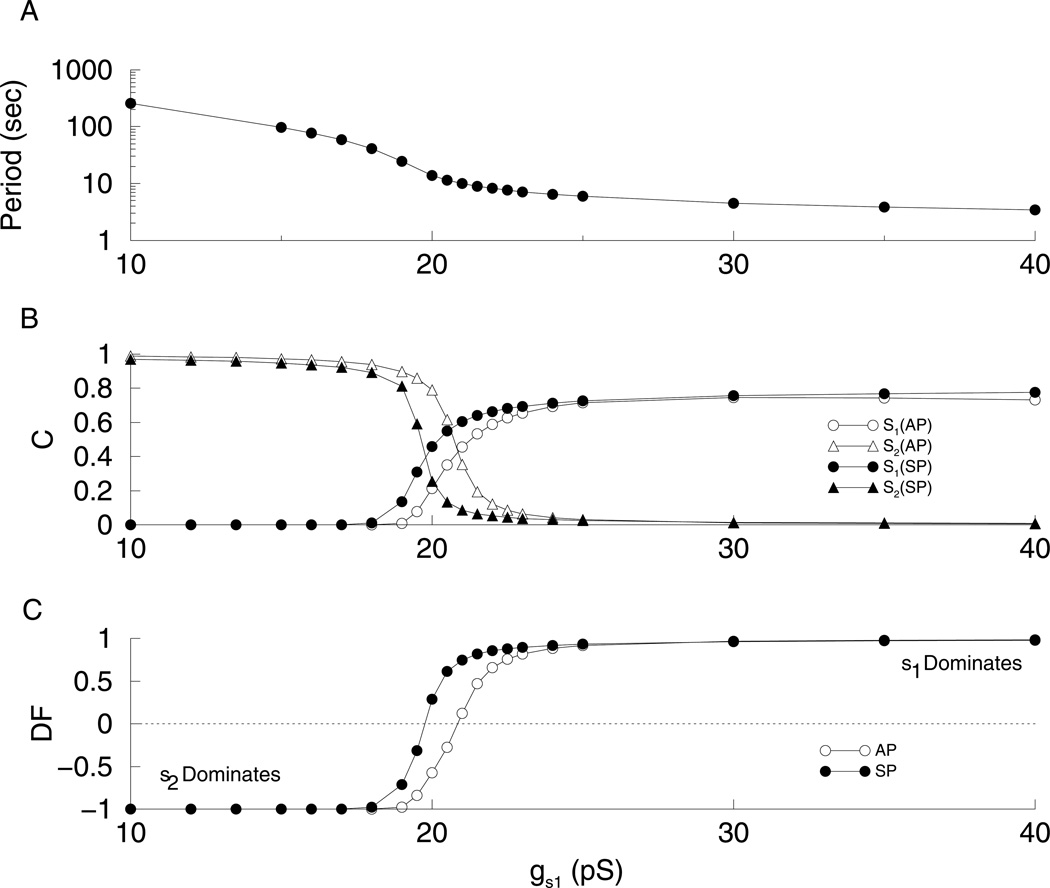
Figure 6 shows the results of applying this method of quantification to the phantom relaxation oscillator for various values of gs1. Here and in other figures, we use δτ/τ = 1. The rationale for using this somewhat large value is discussed later for the case of phantom bursting. Fast oscillations occur with high values of gs1, while slow oscillations occur with low values of gs1 (Fig. 6A). The C values for various values of gs1 are shown in Fig. 6B. (open circle) and (closed circle) start near 0 for small values of gs1, then increase to 1 as gs1 increases, while (open triangle) and (closed triangle) start at 1 and decrease to 0. Figure 6C shows DFAP (open circles) and DFSP (closed circles). For low values of gs1, DF is close to −1 indicating that s2 is the variable driving the oscillations, which therefore have a large period (Fig. 6A). For high values of gs1, DF is close to 1 indicating that s1 is the variable driving the oscillations, which have a short period since τs1 is small. It also shows that the switch between s1-driven oscillations and s2-driven oscillations occurs near gs1 = 20 pS. However, the switch of control does not occur simultaneously for the AP and the SP. When gs1 = 20 pS the AP is driven primarily by s2, while the SP is primarily driven by s1. This difference in contribution to the AP and SP between s1 and s2 is not simply due to the difference in their time constants. The difference in their time constants leads to s1’s dominance of fast bursting and s2’s dominance of slow bursting. Rather, it is due to the difference in their activation. Figure 3B illustrates that the phase point gets stuck in the AP shown by the vertical trajectory as s2 moves the V-nullcline leftward, ending the AP. The slow increase in s2 moves the V-nullcline leftward, while the phase point is at the upper intersection of this nullcline with the s1-nullcline. Once this intersection disappears, the phase point moves vertically downward, and then to the left. While it is not as clear for the SP, s2 moves the lower knee before the phase point reaches it. Therefore, the phase point does not get stuck. So, the contribution of s2 to the termination of the SP is minimal, while s2 controls the termination of the AP.
Figure 6.
Results of the quantification method on the phantom relaxation oscillator. δτ=τ here and in other figures that follow. The results obtained using δτ = 0.05τ are similar for the relaxation case. (A) Oscillation period decreases with gs1. (B) C values for active and silent phases and for s1 and s2. (C) For low values of gs1 the DF is close to −1 indicating that s2 is the variable driving slow oscillations, while for high values of gs1 DF is close to 1 indicating that s1 is the variable driving slow oscillations.
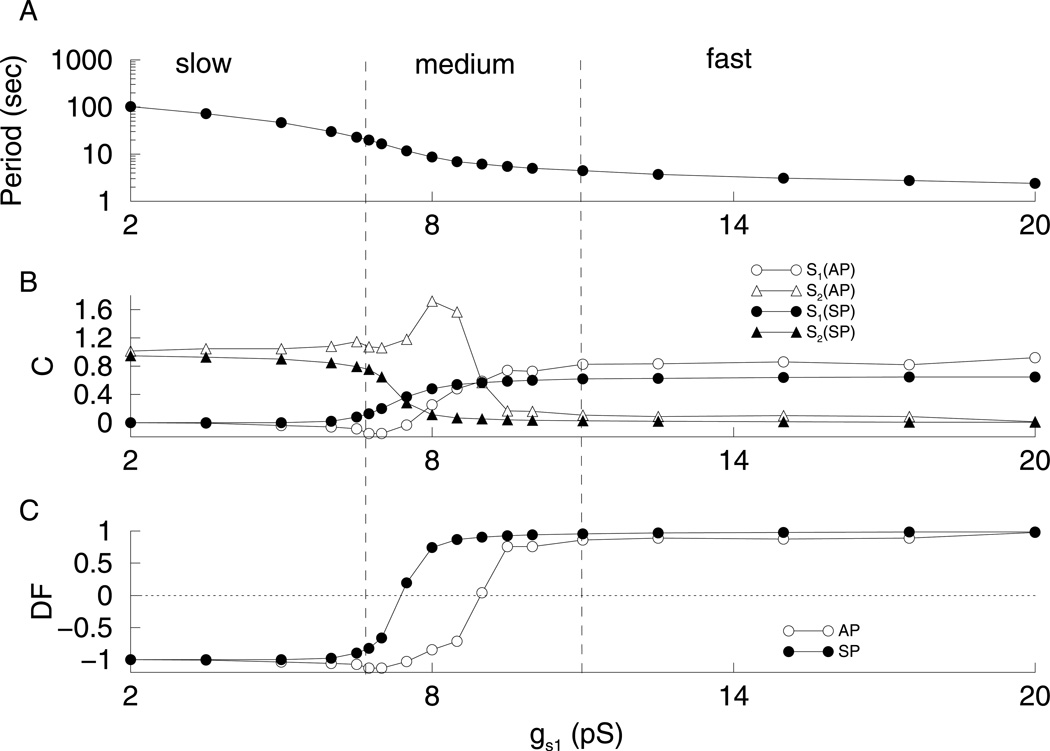
Figure 7 shows the results of applying the method of quantification to the phantom bursting model for various values of gs1. These results are similar to those obtained for the relaxation oscillator (Fig. 6). Thus, we see a similar transition between s1-dominated and s2-dominated dynamics, except that now the switch of control between s1 and s2 occurs at a lower value of gs1. At gs1 = 8 pS, the control is mixed; s1 controls the length of the SP, while s2 controls the length of the AP. While a small δτ works well with the relaxation oscillator, it can produce very jagged contribution (C) curves when used with bursting. This is because asmall δτ can lead to the addition of an extra spike in some cases, but not others. The curves are smoother with a larger δτ (δτ = τ). We verified that, in the case of the phantom relaxation oscillator, the dominance factor curves are similar for δτ = 0.05τ and δτ = τ (used in Figs. 6,7,9).
Figure 7.
Results for phantom bursting. (A) Burst period decreases with gs1. (B) C values for active and silent phases and for s1 and s2. (C) For low values of gs1, DF is close to −1 indicating that s2 is the variable driving slow bursting, while for high values of gs1, DF is close to 1 indicating that s1 is the variable driving fast bursting. The type of bursting can be defined in terms of the dominance factors.
Figure 9.
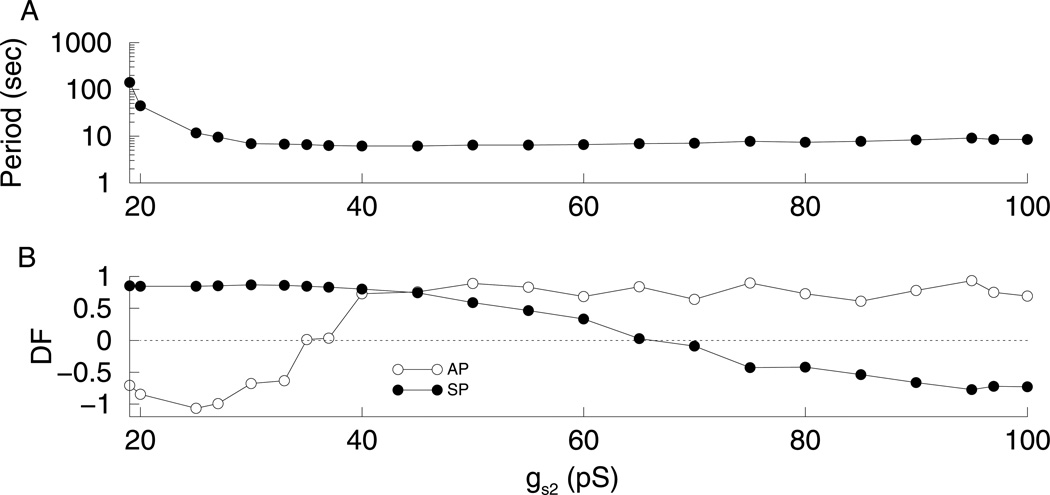
Results for phantom bursting with gs2 as the varying parameter and gs1 = 8.5 pS. (A) Burst period decreases with gs2. For gs2 < 19 pS, the system spikes continuously. (B) C values for active and silent phases and for s1 and s2. (C) For low values of gs2, DFAP is close to −1 and DFSP is close to 1 indicating that s2 drives the active phase, while s1 drives the silent phase. However, for high values of gs2 DFAP is close to 1 and DFSP is close to −1 indicating that s1 drives the AP, while s2 drives the SP.
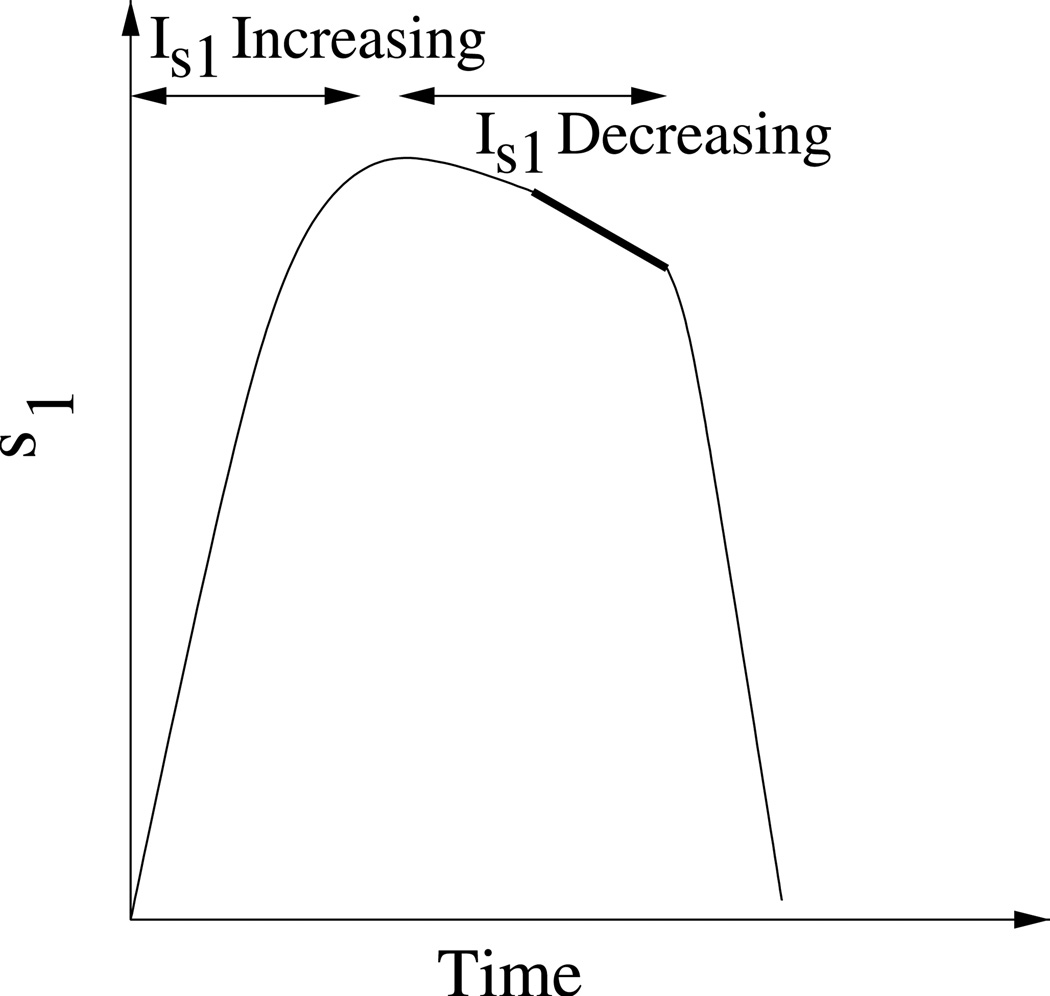
During the active phase of a fast burst s1 increases monotonically (Fig. 1B). During the active phase of a medium burst s1 first increases, but then decreases (Fig. 1D and Fig. 8). This decrease occurs when the trajectory is “stuck” near the end of the periodic branch. The value of s1 averaged over a spike declines as s2 rises and shifts the z-curve leftward, since now the spike spends a longer period of time at its nadir, underneath (and to the right of) the s1-nullcline In other words, s1 declines due to the decrease in spike frequency near the end of the active phase. If τs2 is now increased, the duration of the decreasing phase of s1 will be extended. This extra decrease in s1 provides an extra increase in the AP duration. Figure 8 is an exaggerated picture of the decrease in s1 leading to burst prolongation. As s1 declines, the hyperpolarizing current Is1 also declines, tending to increase the AP duration. As a result, , as seen in Fig. 7B for gs1 near 8 pS. This does not occur in the relaxation oscillator since there are no spikes to bring the trajectory to the right of the s1-nullcline.
Figure 8.
As s1 rises during an active phase, Is1 increases, which promotes the termination of the AP. However, Is1 starts to decline toward the end of the burst, leading to burst prolongation. Therefore, an increase in the time constant for s2 (τs2), leads to a longer decline in s1 (bold part of curve), which acts to increase AP duration.
There are also cases during medium bursting where , so that increasing τs1 decreases the active phase duration. This is again due to the decline in s1 during the latter part of the active phase in medium bursting. If τs1 is increased, s1 rises more slowly during the active phase and enters its declining phase much later in the burst. Once it enters the declining phase it declines more slowly. Together, the active phase prolongation, due to the s1 decline during the active phase, is reduced. The end result is that slowing down s1 makes the active phase shorter, so .
We can use the dominance curves to provide, for the first time, a quantitative distinction between the types of phantom bursting. For some small ε > 0 (we choose ε = 0.15), bursting can be defined as “fast” if DFSP, DFAP > 1−ε. Bursting is “slow” if DFSP, DFAP < −(1−ε). Bursting is “medium” if −(1−ε) < DFSP, DFAP < 1−ε. From Fig. 7, slow bursting occurs for gs1 < 6.75 pS; medium bursting occurs for 6.75 pS < gs1 < 11 pS;and fast bursting occurs for gs1 > 11 pS.
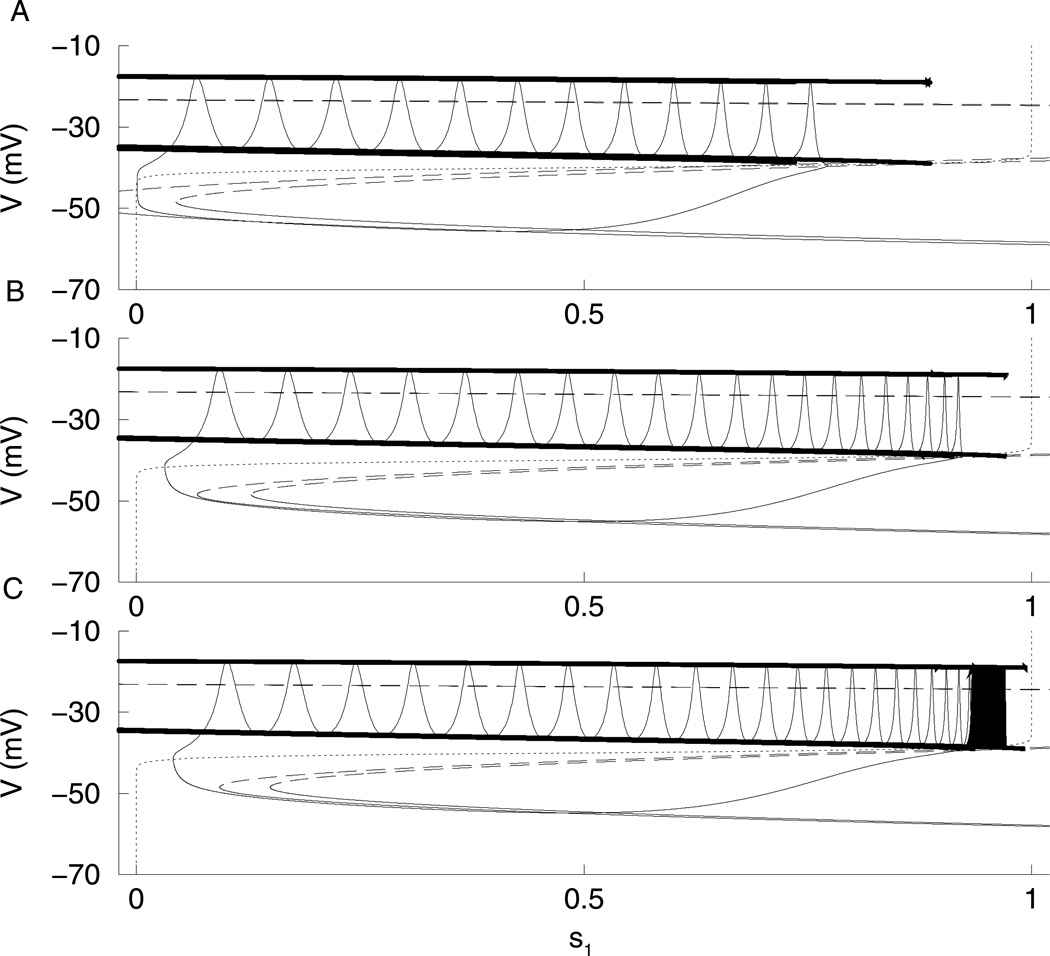
In computing the dominance curves in Fig. 7, gs1 was varied to produce the different types of bursting. For fast bursting, both DFAP and DFSP were close to 1, while for slow bursting both DFAP and DFSP were close to −1. This indicated that either s1 or s2 controlled both phases of the burst. On the other hand, for medium bursting (gs1 ≈ 8 pS), we can have DFAP < 0 and DFSP > 0, showing that each slow variable controls one phase (Fig. 7C). If the dominance curves are computed by varying gs2 and keeping gs1 constant at 8.5 pS, one slow variable controls the active phase while the other controls the silent phase over most of the range (Fig. 9). As gs2 is increased, the burst period decreases (Fig. 9A). Figure 9B shows the DF values for a range of values of gs2. For low values of gs2, DFAP is close to −1 and DFSP is close to 1 indicating that s2 drives the active phase, while s1 drives the silent phase. In other words, as gs2 is varied, the z-curve shifts from left to right, changing which phase the trajectory gets stuck in. Therefore, the DF curves intersect. Figure 10C shows the fast subsystem bifurcation diagram for gs2 = 20 pS. Here the phase point gets stuck in the AP and has to wait for s2 to move the z-curve to the left, terminating the AP. The phase point does not get stuck in the SP. However, for high values of gs2 the DFAP is close to 1 and DFSP is close to −1 indicating that s1 is the variable driving the AP, while s2 is driving the SP. Figure 10A shows the fast subsystem bifurcation diagram for gs2 = 100 pS. Now, the phase point gets stuck in the SP, and has to wait for s2 to terminate the SP.Figure 10B shows the fast subsystem bifurcation diagram for gs2 = 40 pS. Now, the phase point never gets stuck; s1 is in control of both the AP and SP. Thus, at extreme values of gs2 each slow variable contributes to a phase of the burst, while with gs2 held constant and gs1 varied, a single variable controls both phases at the extreme gs1 values. By applying our definition of medium bursting, as gs2 varies, the bursting goes from medium to fast then back to medium.
Figure 10.
Bifurcation diagrams with gs1 = 8.5 pS. The two dashed curves are the bifurcation diagrams for the extreme values of s2. (A)For gs2 = 100 pS, the phase point gets stuck in the SP. (B)For gs2 = 40 pS, the phase point does not get stuck. (C)For gs2 = 20 pS, the phase point gets stuck in the AP.
4 Resetting
When a relaxation oscillator is perturbed from the silent (active) to the active (silent) phase half way through the silent phase, the immediately following active phase is reduced. This is also true for a bursting oscillation driven by a single slow variable. When there is more than one slow variable, the resetting properties can be different. In fact, if the dominance curves are appropriate, full-length resets may be achieved for both the phantom relaxation oscillator (not shown) and the phantom burster (shown below).
The condition required for a full-length reset is that one slow variable, s1, controls one phase of the oscillation while the second slow variable, s2, controls the other phase. This can be achieved by adjusting gs2 so that the dominance curves become separated as in Fig. 9C. In Fig. 9C, for low values of gs2, DFAP ≈ −1, while DFSP ≈ 1. This means that s1 is in control of the SP, while s2 controls the AP. For high values of gs2, DFAP ≈ 1 and DFSP ≈ −1, so s1 is in control of the AP and s2 controls the SP.
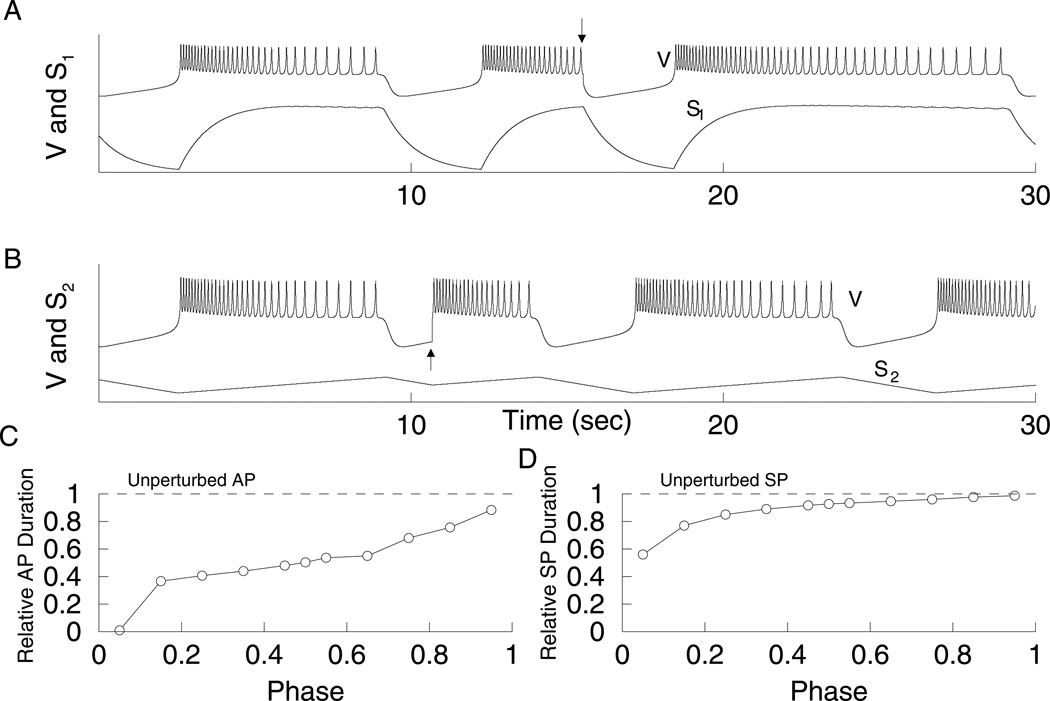
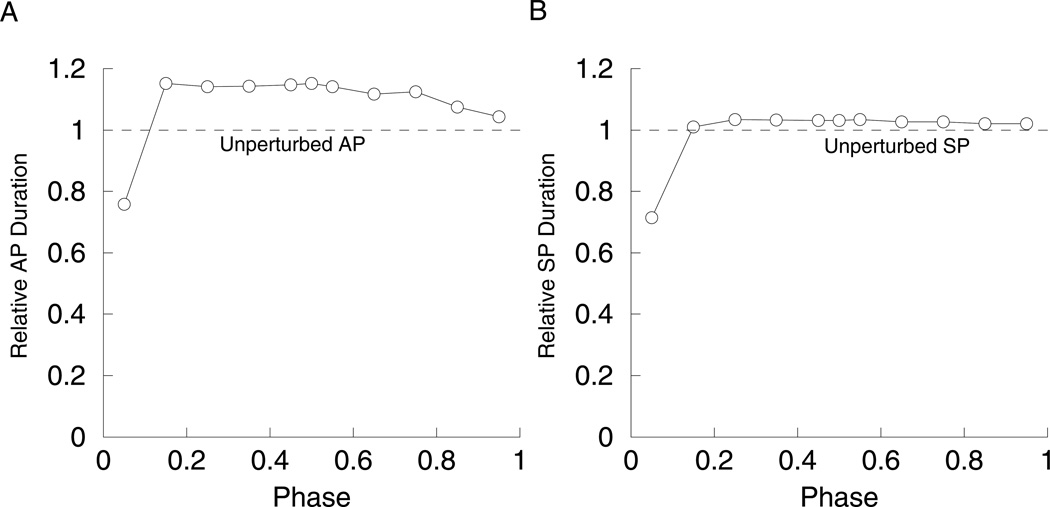
When s2 is in control of the active phase, s1 reaches its maximum value very early in the AP, while s2 increases monotonically. If the model cell is reset before the end of the active phase, and if s1 controls the silent phase duration (as in Fig. 9C, for gs2 = 27 pS), then the silent phase will have a full duration. That is, s1 will be starting at the same value almost regardless of when the reset occurs in the active phase. This is shown in Fig. 11A. However, when resetting half-way through the silent phase, the induced active phase is reduced (Fig. 11B). This occurs because s2 is in control of the active phase; s2 is between its minimum and maximum values when the reset occurs, so during the subsequent AP it need only travel a portion of the distance required to terminate the AP. In this case, silent-active resetting is phase dependent (Fig. 11C); the duration of the induced AP is closer to the unperturbed AP duration the longer the system is in the SP before the reset. On the other hand, active-silent resetting is approximately phase independent, if resetting occurs after s1 reaches its maximum value (Fig. 11D). That is, a reset very early in the active phase does not result in a full-length silent phase, but resets applied at most points during the AP do produce nearly full-length silent phases as in Fig. 11C.
Figure 11.
Resetting with gs2 = 27 pS and gs1 = 8.5 pS. In this case, s1 is in control of the SP (DF = 0.85), while s2 is in control of the AP (DF = −0.99). (A) Half-way through the AP the system was reset to the SP (arrow), which has full length. s1 has reached its maximum at the time of resetting (bottom curve). The V and s1 time courses have been scaled to facilitate comparison. (B) Half-way through the SP the system was reset to the AP (arrow), which is reduced. s2 is in the middle of decreasing to its minimum value at the time of resetting (bottom curve). (C) The duration of the induced AP is phase dependent. (D) The duration of the induced SP is close to the duration of the unperturbed SP if the resetting occurs after s1 reaches its maximum value.
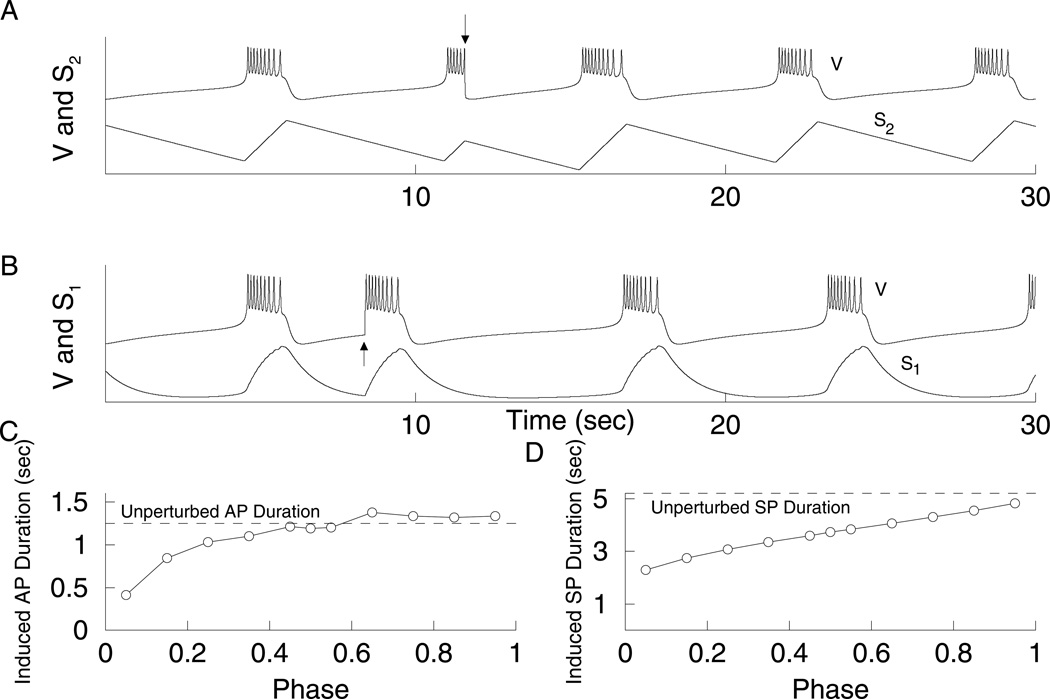
When s2 is in control of the silent phase, and s1 controls the active phase (e.g., for gs2 = 97 pS, Fig 9C), s1 reaches its minimum value early in the silent phase, while s2 decreases monotonically. If the model cell is reset before the end of the silent phase, then the active phase will have a full duration. That is, s1 will be starting at the same value almost regardless of when the reset occurs in the silent phase. This is shown in Fig. 12B. However, when resetting half-way through the active phase, the induced silent phase is reduced (Fig. 12A). This occurs because s2 is in control of the silent phase; s2 is between its minimum and maximum values when the reset occurs, so during the subsequent SP it need only travel part of the distance required to terminate the SP. In this case, silent-active resetting is nearly phase independent (Fig. 12C) and the active-silent resetting is phase dependent (Fig. 12D).
Figure 12.
Resetting with gs2 = 97 pS and gs1 = 8.5 pS. In this case, s1 is in control of the AP (DF = 0.79), while s2 is in control of the SP (DF = −0.68). (A) Half-way through the AP the system was reset to the SP (arrow), which is reduced. s2 is midway to its maximum value at the time of resetting (bottom curve). (B) Half-way through the SP the system was reset to the AP (arrow), which has full length. s1 has reached its minimum value at the time of reseting (bottom curve). (C) The duration of the induced AP is close to the width of the unperturbed AP if the resetting occurs after s1 reaches its minimum value. (D) The width of the induced SP is phase dependent.
5 Bidirectional Full-Length Resets
So far we have described full-length resets in one direction. By changing model parameters, we can get either active-silent or silent-active full-length resets. Such full-length resets are consistent with experimental data from pancreatic islets (Cook et al., 1981). However, in (Cook et al., 1981) there was an example in which full-length resets occurred in both directions (bidirectional full-length resetting) in an islet, which cannot be accounted for with the model in its current form. However, with a few modifications the model can reproduce this data. The idea is to design the system so that s1 controls the active phase and s2 controls the silent phase. Then, make the s1 and s2 time scales voltage dependent, so that s1 is slow during the active phase and fast during the silent phase, and vice-versa for s2. Time scales that achieve this are
| (18) |
with
| (19) |
and τs1,min = 100 msec, τs2,min = 100 msec, τs1,max = 10 sec, and τs2,max = 10 sec.
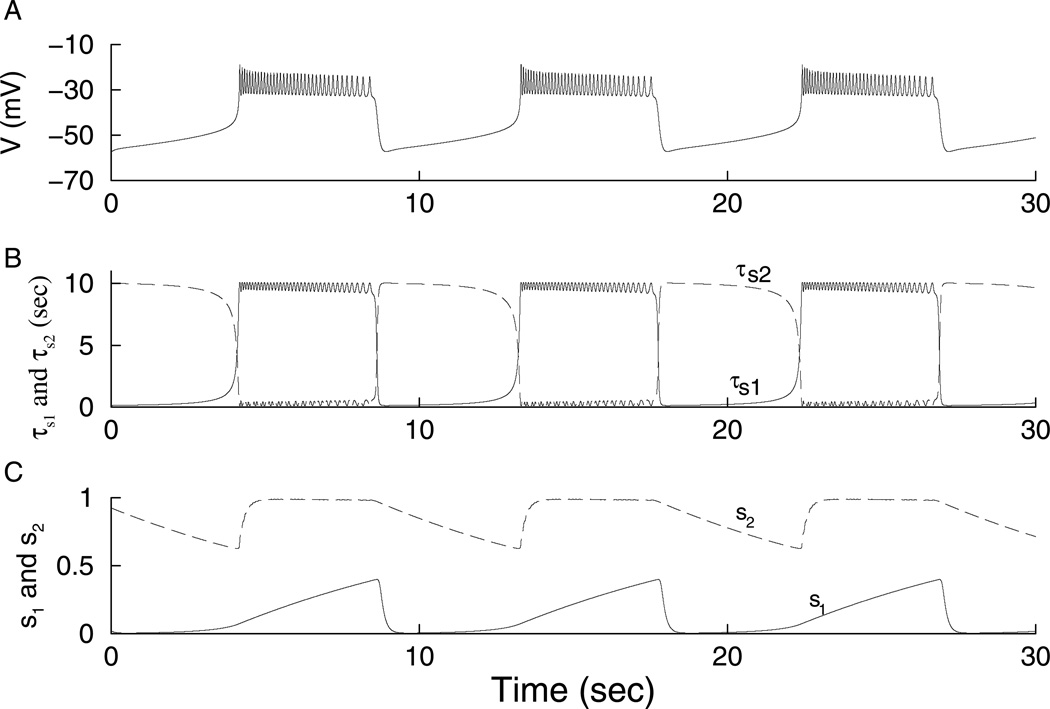
With these changes to the model, we get bursting as shown in Fig. 13A. During the active phase τs1 ≈ 10 sec, while during the silent phase τs1 ≈100 msec (Fig. 13B). The s2 time scale, τs2, is the opposite (Fig. 13B). Thus, s1 quickly resets to its minimum value during the silent phase, while s2 quickly achieves its maximum value during the active phase (Fig. 13C). During the active phase, s2 almost instantaneously achieves its maximum value, while s1 rises monotonically. Likewise, during the silent phase, s1 almost achieves its minimum value instantaneously, while s2 decreases monotonically (Fig. 13C).
Figure 13.
Bursting produced by the model with V-dependent s1 and s2 time scales (Eqs. 18, 19), gs1 = 16 pS and gs2 = 30 pS. (A) Voltage time course. (B) τs1 ≈ 10 sec during the active phase and ≈ 100 msec during the silent phase. s1 is in control of the active phase. (C) τs2 ≈ 100 msec during the active phase and ≈ 10 sec during the silent phase. s2 is in control of the silent phase.
bidirectional full-length resetting is now possible. Since s1 quickly reaches its minimum value during the silent phase, when reset to the active phase s1 has to rise the normal amount to reach its maximum value, yielding a full-length silent-active reset (Fig. 14A). Since s2 quickly reaches its maximum value during the active phase, when reset to the silent phase s2 must decrease the normal amount to end the silent phase, producing a full-length active-silent reset (Fig. 14B).
Figure 14.
Bidirectional resetting produced by the bursting model with V-dependent s1 and s2 time scales, gs1 = 16 pS, and gs2 = 30 pS. (A) Silent-active phase-independent resetting. (B) Active-silent phase-independent resetting.
6 Discussion
We developed a measure, the dominance factor, to quantify the contributions of two slow variables to a phantom relaxation oscillation and phantom bursting. This is useful for determining which slow variable controls each phase of the oscillation or whether the two work together. The dominance factor also allows us to quantitatively categorize bursting into fast, medium, and slow (Fig. 7). In the past, it has been difficult to distinguish between medium and slow bursting in a quantitative way. With the dominance factor, it is also easy to see when the control of the active and silent phases is shifted from one slow variable to the other as a parameter is varied (Figs. 6, 7, 9).
The method used here was previously developed in the context of a neural relaxation oscillator with two types of negative feedback variables, one divisive and one subtractive (Tabak et al., submitted). Here, s1 and s2 are both subtractive, so the analysis developed in the earlier paper predicts that the contribution of each variable should be the same for the active and silent phase. Also, the contributions of s1 and s2 to both the active and silent phase should depend on the inverse ratio of their time constants. Given the difference in time scales between s1 and s2, s1 should control both the active and silent phase. We show here that this is true only for fast bursting. As gs1 is lowered, the contributions vary quantitatively, but at some point a qualitative change occurs due to the phantom effect. That is, the system becomes stuck in the active or silent phase and has to wait for s2. In that case, the slower s2 starts to control the phase. The longer the system is stuck, the more s2 controls the duration of that phase. Also, unless parameters are tuned precisely, as gs1 or gs2 is varied, the system will first be stuck in one phase, but not the other. Thus, the contribution of each variable to the active and silent phases will be different. For sufficiently small gs1, the system will be stuck in both phases so s2 will control the duration of both phases.
The method assumes that both slow negative feedback variables are the only variables responsible for burst termination and that they vary monotonically during each phase of the burst. In that case, all the C values should be positive and below 1. Also, Cs1 + Cs2 = 1. We have good agreement to this rule in the relaxation case (Fig. 6), but not in the bursting case (Fig. 7). This is because during medium bursting s1 does not vary monotonically. Instead, it quickly reaches a high value during the active phase, then slowly decreases since the spikes can push the V-s1 trajectory below the s1-nullcline. This decrease of s1 slows down the termination of the active phase, instead of s1 steadily contributing to its termination. This is why for some gs1 values we get . Nevertheless, the results are qualitatively similar to those obtained in the relaxation case. Finally, the method should in principle be used with small δτ. Unfortunately, the spikes make the active phase duration discontinuous, so the CAP values become very variable when δτ is small. To avoid this problem, we have used δτ = τ after having checked that in the relaxation case we obtain quantitatively similar results with δτ = 0.05τ and δτ = τ. Thus, the method that was originally developed for a relaxation oscillation can be extended to bursting where a fast oscillation (the spikes) is superimposed on a slow relaxation rhythm.
It is unlikely that the approach used here to calculate dominance factors can be applied experimentally. This fact argues for the utility of mathematical models for biological systems. It may be known from experiments that two or more slow processes are involved in the burst generation, but without a model it is difficult or impossible to know how much each variable contributes to bursting. This is the case with pancreatic β-cells, where slow variables such as the cytosolic Ca2+ concentration, the Ca2+ in the endoplasmic reticulum, the ATP/ADP ratio, and slow inactivation of Ca2+ currents have all been postulated to contribute to bursting (Bertram & Sherman, 2000). With the development of models containing some or all of the slow processes, and the technique that we describe here to quantify slow variable dominance, it becomes possible to identify the key processes driving the bursting. In fact, we are currently applying this technique to a β-cell model that contains many of the slow variables listed above, with the challenge that there are more than two slow variables.
Another extension of the simple β-cell model would be the inclusion of channel noise. This would add a stochastic element to the voltage differential equation (1). It has been shown previously that phantom bursting is sensitive to noise, particularly for the case of slow bursting (Pedersen, 2007). In this case, active and silent phases can be significantly shorter than predicted by the deterministic model, since now the noise, rather than the slower of the two slow variables, is what terminates the active/silent phase. Therefore, the contribution to bursting of the s2 variable predicted by the dominance factor analysis of the deterministic model would be overstated for the stochastic model. In other words, we expect that dominance factors for the stochastic model would be closer to 1 than those for the deterministic model in the case of single β-cells, which can be very noisy. However, this effect would depend on noise amplitude, which is small in islets.
One application of the dominance factor is in the determination of parameter values that allow phase-independent resetting. Such resetting was documented in islets nearly 30 years ago (Cook et al., 1981). An earlier model, similar to our model for bidirectional full-length resets, was able to account for this (Smolen & Sherman, 1994). However, that model was not a phantom bursting model and thus the burst period was constrained to a relatively narrow range of values. The present model possesses both the desired (but unidirectional) full-length reset properties (Figs. 11, 12), and can produce the wide range of oscillation periods that is characteristic of pancreatic β-cells (Bertram et al., 2000).
bidirectional full-length resets cannot be produced with the phantom bursting model in its current form. We showed how the model can be changed to produce this type of resetting (Fig. 14), but with the changes the model is no longer a phantom bursting model. Since bidirectional full-length resets have been documented in at least one pancreatic islet (Cook et al., 1981), this calls into question the validity of the phantom bursting model as a description of islet electrical activity. One possibility is that the slow processes (such as Ca2+ dynamics in the cytosol and the endoplasmic reticulum, and the ATP/ADP ratio) work together to produce phantom bursting in some islets, but not others. It is also possible that with a more sophisticated phantom bursting model (Bertram & Sherman, 2004) bidirectional full-length resets can be achieved, although we have not yet found this to be true.
Our analysis predicts unidirectional full-length resets for medium bursting islets, but not for slow or fast bursting islets. Active-silent full-length resets should be found in islets with a long active phase and short silent phase (Fig. 11), while, silent-active full-length resets should be found in islets with a short active phase, but a long silent phase (Fig. 12). For fast and slow bursting only one variable controls the duration of both phases, so full-length resets should not occur. At the time that Cook et al. performed their islet resetting experiments (Cook et al., 1981) slow islet oscillations had not appeared in the literature, and resetting of only medium-period (15–30 sec) oscillations were attempted. Since the long period of the now commonly reported slow islet oscillations would make resetting data easier to interpret than in the case of fast bursting, we encourage investigators to continue the work of Cook and colleagues by examining islet resetting of slow bursters.
Acknowledgments
This work was partially supported by NSF grant DMS0917664 and NIH grant DA19356 to Richard Bertram. Arthur Sherman is supported by the Intramural Research Program of the NIH (NIDDK).
Footnotes
Publisher's Disclaimer: This is a PDF file of an unedited manuscript that has been accepted for publication. As a service to our customers we are providing this early version of the manuscript. The manuscript will undergo copyediting, typesetting, and review of the resulting proof before it is published in its final citable form. Please note that during the production process errors may be discovered which could affect the content, and all legal disclaimers that apply to the journal pertain.
References
- Bertram R, Previte J, Sherman A, Kinard T, Satin L. The phantom burster model for pancreatic β-cells. Biophys. J. 2000;79:2880–2892. doi: 10.1016/S0006-3495(00)76525-8. [DOI] [PMC free article] [PubMed] [Google Scholar]
- Bertram R, Sherman A. Dynamical complexity and temporal plasticity in pancreatic β-cells. J. Bio. Sci. 2000;25:197–209. [PubMed] [Google Scholar]
- Bertram R, Sherman A. A calcium-based phantom bursting model for pancreatic islets. Bull. Math. Biol. 2004;66:1313–1344. doi: 10.1016/j.bulm.2003.12.005. [DOI] [PubMed] [Google Scholar]
- Bertram R, Sherman A. Negative calcium feedback: The road from Chay-Keizer. In: Coombes S, Bressloff P, editors. The Genesis of Rhythm in the Nervous System. New Jersey: World Scientific Press; 2005. pp. 19–48. [Google Scholar]
- Butera R, Rinzel J, Smith J. Models of repiratory rhythm generation in the pre-Bötzinger complex. I. Bursting pacemaker neurons. J. Neurophysiol. 1999;80:382–397. doi: 10.1152/jn.1999.82.1.382. [DOI] [PubMed] [Google Scholar]
- Chay T, Keizer J. Minimal model for membrane oscillations in the pancreatic β-cell. Biophys. J. 1983;42:181–190. doi: 10.1016/S0006-3495(83)84384-7. [DOI] [PMC free article] [PubMed] [Google Scholar]
- Cook D, Porte D, Crill W. Voltage dependence of rhythmic plateau potentials of pancreatic islet cells. Am. J. Physiol. 1981;240:E290–E296. doi: 10.1152/ajpendo.1981.240.3.E290. [DOI] [PubMed] [Google Scholar]
- Coombes S, Bressloff P, editors. Bursting: The genesis of rhythm in the nervous system. World Scientific Publishing Co.; 2005. [Google Scholar]
- Ermentrout B. Simulating, analyzing, and animating dynamical systems: A guide to XPPAUT for researchers and students. Philadelphia: SIAM; 2002. [Google Scholar]
- Pedersen MG. Phantom bursting is highly sensitive to noise and unlikely to account for slow bursting in β-cells: considerations in favor of metabolically driven oscillations. J. Theor. Biol. 2007;248:391–400. doi: 10.1016/j.jtbi.2007.05.034. [DOI] [PubMed] [Google Scholar]
- Rinzel J. A formal classification of bursting mechanisms in excitable systems. In: Teramoto E, Yamaguti M, editors. Mathematical Topics in Population Biology, Morphogenesis, and Neurosciences, Lecture Notes in Biomathematics. Berlin: Springer; 1987. pp. 267–281. [Google Scholar]
- Rinzel J, Ermentrout GB. Analysis of neural excitability and oscillations. In: C K, I S, editors. Methods in Neuronal Modeling: From Ions to Networks. second ed. Cambridge MA: MIT Press; 1989. pp. 251–291. [Google Scholar]
- Rinzel J, Lee Y. Dissection of a model for neuronal parabolic bursting. J. Math. Biol. 1987;25:653–675. doi: 10.1007/BF00275501. [DOI] [PubMed] [Google Scholar]
- Smolen P, Sherman A. Phase independent resetting in relaxation and bursting oscillators. J. Theor. Biol. 1994;169:339–348. doi: 10.1006/jtbi.1994.1156. [DOI] [PubMed] [Google Scholar]
- Zimliki C, Sherman A, Mears D. Glucose-induced oscillations: Understanding the phase dependence discrepancy with noise. Diabetes, Suppl. 2003;52:A369. [Google Scholar]


