Abstract
S K-edge X-ray absorption spectroscopy on the resting oxidized and the S-adenosyl-L-methionine (SAM) bound forms of pyruvate formate-lyase activating enzyme are reported. The data show an increase in pre-edge intensity which is due to additional contributions from sulfide and thiolate of the Fe4S4 cluster into the C-S σ* orbital. This experimentally demonstrates that there is a backbonding interaction between the Fe4S4 cluster and C-S σ* orbitals of SAM in this inner sphere complex. DFT calculations that reproduce the data indicate that this backbonding is enhanced in the reduced form and that this configurational interaction between the donor and acceptor orbitals facilitates the electron transfer from the cluster to the SAM, that otherwise has a large outer sphere electron transfer barrier. The energy of the reductive cleavage of the C-S bond is sensitive to the dielectric of the protein in the immediate vicinity of the site as a high dielectric stabilizes the more charge separated reactant increasing the reaction barrier. This may provide a mechanism for generation of the 5′-deoxyadenosyl radical upon substrate binding.
Introduction
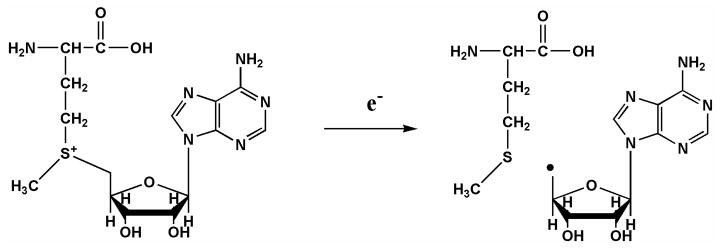
S-Adonesyl-L-methionine (SAM)-dependent FeS enzymes are involved in key biological processes including rearrangement reactions (lysine 2,3-aminomutase, LAM), DNA repair (spore photoproduct lyase), biotin synthesis (biotin synthase), complex metal cluster biosynthesis (the FeMoco of nitrogenase and the H-cluster of hydrogenase), and glycyl radical formation (the glycyl radical activating enzymes), among others.1, 2 These so-called radical SAM enzymes all employ radical-mediated catalysis that is initiated by a SAM-derived 5′-deoxyadenosyl radical (Scheme 1). This radical is generated by the reductive cleavage of the adenosyl 5′-carbon to sulfonium sulfur bond (CAdo-S), with the electron provided by a Fe4S4 cluster.3
Scheme 1.
Reductive Cleavage Reaction of SAM Initiated by the Fe4S4 Cluster.
Pyruvate formate-lyase activating enzyme (PFL-AE) is a radical SAM enzyme that utilizes a SAM-bound Fe4S4 site-differentiated cluster to generate a stable glycyl radical on G734 of pyruvate formate-lyase (PFL).3–7 PFL utilizes this glycyl radical to convert pyruvate and coenzyme A to formate and acetyl-CoA in a key step in anaerobic glucose metabolism in bacteria.8 The glycyl radical is generated by direct and stereospecific H-atom abstraction at PFL G734 by the deoxyadenosyl radical generated at the PFL-AE active site. Although G734 is buried 8 Å from the PFL surface in the resting state of the enzyme,9 the evidence for direct H-atom abstraction suggests that G734 binds in the PFL-AE active site during activation. The X-ray crystal structure of PFL-AE with a heptamer peptide substrate bound in the active site supports this idea.10 Recent studies have provided evidence that the PFL structure is dynamic, adopting a more open conformation in which G734 is available to bind in the PFL-AE active site, as well as the closed conformation observed crystallographically, in which the gly radical would be protected from quenching.11
As is the case with most other members of the radical SAM superfamily, the Fe4S4 cluster of PFL-AE is coordinated by a conserved CXXXCXXC sequence that is distinct from the highly conserved CXXCXXC sequence in bacterial ferredoxins.1 This radical SAM cysteine motif coordinates a site-differentiated Fe4S4 cluster in these enzymes, with the fourth iron coordinated in a bidentate fashion by the amino and carboxylate groups of SAM.7, 12–15 The previously unprecedented coordination of SAM to the unique iron of a Fe4S4 cluster was initially demonstrated using electron-nuclear double resonance (ENDOR) techniques with PFL-AE and LAM12–15 and has now been observed for these and several other superfamily members by X-ray crystallography.10, 16–21 The seminal ENDOR studies of PFL-AE also demonstrated the presence of direct orbital overlap between the sulfonium sulfur of SAM and the iron-sulfur cluster, and this was interpreted as arising either through overlap with a bridging sulfur or with the unique iron of the cluster.12, 15 The PFL-AE crystal structure reveals that the sulfonium sulfur of the SAM is within 4 Å of the unique Fe and a bridging sulfide of the cluster; similar distances were observed in other radical SAM enzyme crystal structures as well.10, 16–21 Based on these distances, the sulfonium sulfur has been proposed to interact directly with the unique Fe of the Fe4S4 cluster,10 consistent with a similar proposal supported by Se EXAFS data on LAM.22 Recently, Nicolet et. al. have provided computational evidence that the electron transfer between the Fe4S4 cluster of the radical SAM enzyme HydE and bound SAM is mediated by direct interaction between the unique Fe of the cluster and the C-S σ* orbital of SAM.16 A cleavage barrier of 13 Kcal/mol was estimated and is comparable to experimental estimates. The reductive cleavage of sulfonium ions has previously been shown to be facile in synthetic models incorporating site-differentiated Fe4S4 clusters.23 S K-ege X-ray absorption spectroscopy (XAS) is a powerful technique which is now widely used to quantify metal-ligand bond covalency.24 The K-edge involves S1s ionization, however since the sulfur 1s→np transition is electric dipole allowed, transition to any bound state lower in energy than the edge with S3p mixing will contribute to the pre-edge. In the case of transition metal complexes, the transition from S1s to M3d gains intensity due to mixing of S3p character into the M3d wavefunction due to covalency. The intensity of the 1s→3d transition is directly proportional to the amount of ligand character in these acceptor orbitals (α2):
| (1) |
In equation 1, I(1s→L3p) is the intensity of a purely ligand based 1s→3p transition, which depends on the Zeff of the ligand.25, 26 Thus the pre-edge intensity provides an experimental value of ligand-metal bond covalency. This method has been used to study the electronic structures of a series of FeS active sites in nature.27–29 Furthermore, the S K-edge XAS energies are sensitive to the charge and oxidation state of the ligand, as well as the Zeff, spin state and the ligand field of the metal.30 In addition, the pre-edge energy and intensity are sensitive to perturbations in covalency due to hydrogen bonding (both from the protein backbone and the solvent).31, 32
In this study we use S K-edge XAS to directly probe the effect of SAM binding to the oxidized FeS cluster in PFL-AE. These data are then computationally reproduced and these calculations are further extended to describe the nature of interaction between SAM and the cluster. Potential Energy Surfaces (PES) are calculated to understand the role of this cluster in the reductive cleavage of the C5′-S bond.
Experimental Details
Materials and Methods
PFL-AE was purified as published.12, 33 The purified protein contains DTT in the medium for maintaining a reducing environment. However this jeopardizes S K-edge experiments as the DTT S signal will overwhelm the signal from the cluster. So the purified PFL-AE was buffer exchanged into an anaerobic ascorbic acid containing pH 7.0 buffer, concentrated up to 3–4mM and frozen prior to shipment in liq. N2 for XAS measurements. S-adenosylmethionine was prepared according to published procedures.12, 15 Three equivalents of SAM were added to the resting PFL-AE to prepare the PFL-AE bound SAM samples. The PFL-AE protein samples were thawed in a He filled glove bag at the beam line. The protein was loaded via a syringe into a Pt-plated Al block sample holder sealed using a 6.3 μm polypropylene window. The Al block was placed into a shroud sealed with another polypropylene window and purged with He gas during measurement. The sample was maintained at a constant temperature of 4 °C during data collection using a controlled flow of N2 gas, pre-cooled by liq. N2, passing through an internal channel in the Al block.
Data Collection and Reduction
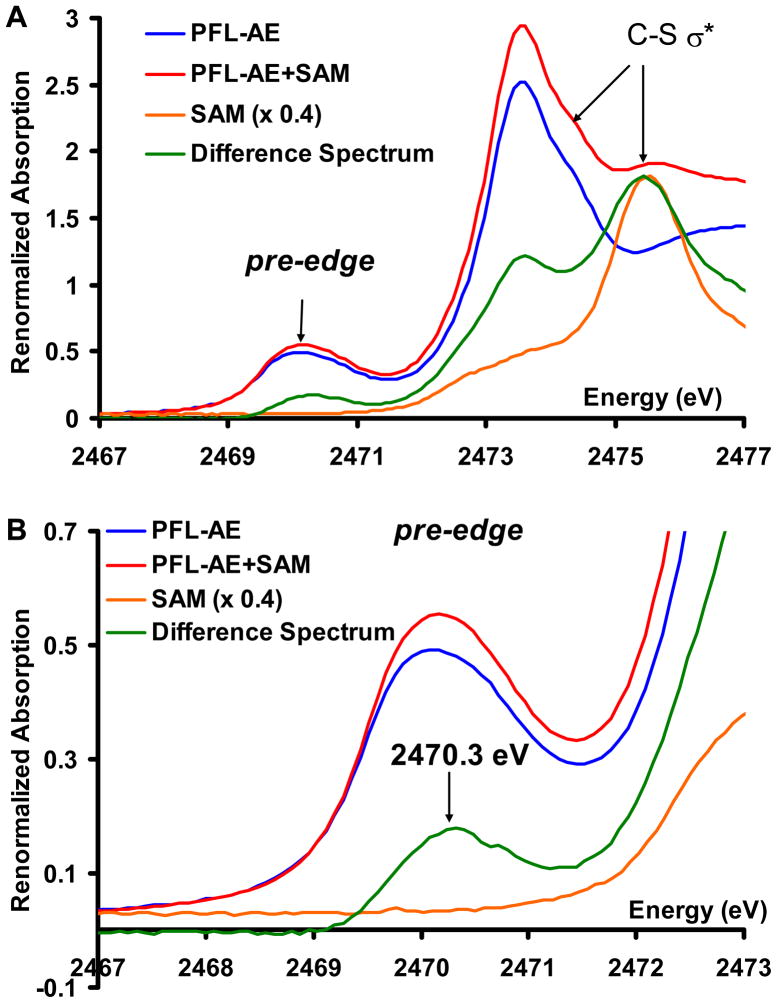
XAS data were measured at the Stanford Synchrotron Radiation Light source using the 54-pole wiggler beam line 6-2. Details of the experimental configuration for low energy studies have been described previously.34 The energy calibration was performed by setting the pre-edge peak of Na2S2O3 at 2472 eV. The raw data is normalized by fitting a flattened second-order polynomial to the post-edge region and normalizing to an edge jump of 1.0 at 2490.0 eV for the S K-edges using the PySpline package.35 Further details of data reduction and error analysis follow the methods described earlier.30 The normalized spectrum of both resting PFL-AE and SAM bound PFL-AE (Fig. S1 in SI) shows matching post-edge background over a large energy range. The pre-edge region shows higher intensity for the resting PFL-AE sample relative to the SAM bound PFL-AE sample. It also shows increased intensity at 2475.5 eV corresponding to a S1s→C-S σ* transition of SAM. PFL-AE contains a total of 19 sulfur atoms out of which only 7 are coordinated to the cluster (4 μ3-Ssulfide and 3 Scys) and contribute to the pre-edge region. To ensure SAM binding, three equivalents of SAM were added. Thus in the PFL-AE + SAM samples, 7 out of 22 S atoms are bound to the cluster (4 μ3-Ssulfide and 3 Scys, the transitions from SAM S are at higher energies (by 2 eV) due to the positive charge on the Sulfonium S and do not contribute to the pre-edge). The normalized spectra are renormalized to account for the above differences in the fraction of the co-ordinated S atoms between the resting and SAM bound PFL-AE samples. These renormalized spectra were used for analysis in this study.
Computational Details
All calculations were performed using an Intel Xeon cluster. The geometries were optimized using the ADF package with the BP86 functional and a triple zeta basis set. The electronic structures were calculated using Gaussian 03 ver C0236 with the BP8637, 38 functional and 6–311+g* basis set. The PES were obtained by optimizing the reduced structures with fixed C-S distances using Gaussian 03 and a mixed basis set (6–311g* on Fe, S, N and O atoms and 6–31g* on C and H atoms). The final energies were obtained using the 6–311+g* basis set and a PCM model39 with an ε of 4 or 20 and solvent radii of 1.4 Å.
Results and Analysis
1. XAS data
The S K-edge XAS data on the PFL-AE show an intense pre-edge transition at ~2470 eV characteristic of an [Fe4S4]2+ cluster (Fig. 2A, blue). This broad feature is an envelope of transitions to all the un-occupied Fe3d based orbitals from the 1s orbitals of four μ3Ssulfide and three Sthiolate ligands.24 The rising-edge (at 2473.5 eV) is comprised of 1s to C-S σ* transitions of all bound and unbound cysteines and methionines present in the protein. The unbound cysteines and methionines add intensity to the C-S σ* transitions at 2473–2474 eV region but do not contribute to the pre-edge region. The S K-edge XAS data on the SAM bound form (Fig. 2A, red) show an increase in the intensity of the pre-edge feature as well as the rising edge feature relative to resting PFL-AE (Fig. 2A, blue). There is also a new feature visible at 2475.5 eV in the SAM bound PFL-AE. These changes are clearer in the difference spectrum (Fig. 2A, green, SAM bound PFL-AE – resting PFL-AE) which shows increases in intensity at 2470.3 eV, 2473.7 eV and 2475.5 eV. The XAS spectrum of free SAM shows the S1s→ C-S σ* transition at 2475.5 eV (Fig. 2A, orange) and some weak intensity in the 2473–2474 eV region. Thus the increase in intensity at 2475.5 eV in the difference spectrum (Fig. 2A, green) is due to the S1s→C-S σ* of SAM added to PFL-AE to generate the SAM bound form (Fig. 2A, red). However the XAS data of free SAM do not have any intensity in the 2470.3 eV region (Fig. 2B, orange). Thus the increase in the pre-edge intensity in PFL-AE + SAM (Fig. 2B, red) relative to PFL-AE (Fig. 2B, blue) must result from SAM binding to the cluster. Note that the sulfonium S1s→C-S σ* of SAM is shifted to 2475.5 eV, ~2 eV higher than S1s→C-S σ* transition reported for cysteine (Fig. 2A, envelope at 2473.5 eV). This reflects the stabilization of S1s energy of the sulfonium S atom present in SAM due to its positive charge. Thus any contribution from the S center of SAM to the Fe-S antibonding orbitals will be shifted up in energy from the pre-edge region by 2 eV and overlap the rising edge. This means that the increase in the pre-edge intensity due to SAM binding (Fig. 2B, green) solely reflects an increase in the S3p character from the μ3Ssulfide and Sthiolate atoms of the cluster in the antibonding orbitals.
Figure 2.
A) Figure 2: A) S K-edge XAS data of the resting PFL-AE enzyme (blue), SAM bound PFL-AE (red), the difference spectrum (green, representing the difference between SAM bound and resting PFL-AE) and free SAM in solution (orange). B) Pre-edge energy region of the XAS data of the resting PFL-AE enzyme (blue), SAM bound PFL-AE (red), the difference spectrum (green) and free SAM in solution (orange). Expanded pre-edge region shown in SI
2. DFT Calculations
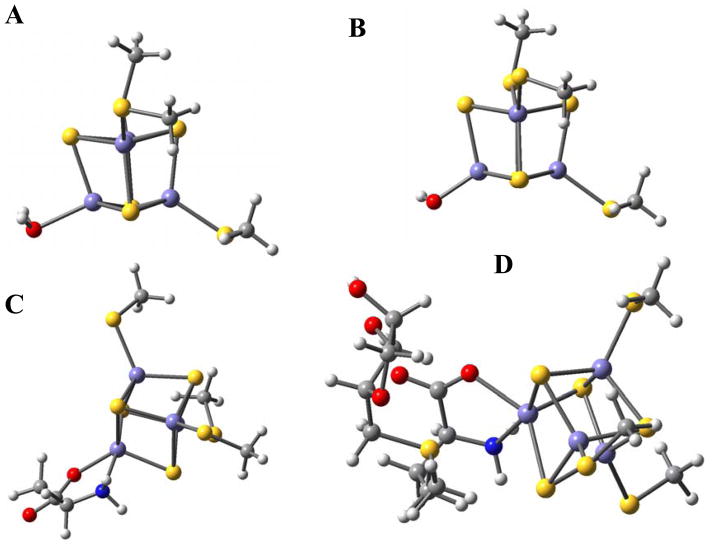
DFT calculations were performed on several possible active site models (Fig. 3). While the unique iron in the resting site is most likely bound to an anionic hydroxide as is the case for aconitase40 and several other members of the hydrolase family41, both the anionic hydroxide (model B) and neutral aquo (model A) ligands were considered as potential models for the resting cluster. The SAM bound cluster was modeled using an S-ribose methionine where the adenosine of SAM has been eliminated (model D). Since SAM binds the unique iron in PFL-AE as a bidentate ligand, the active site with a bidentate ligand similar to SAM but without the sulfonium group was modeled as well (model C).
Figure 3.
Computational models considered in this study.
A) Correlation to Crystal Structures and Spectroscopy
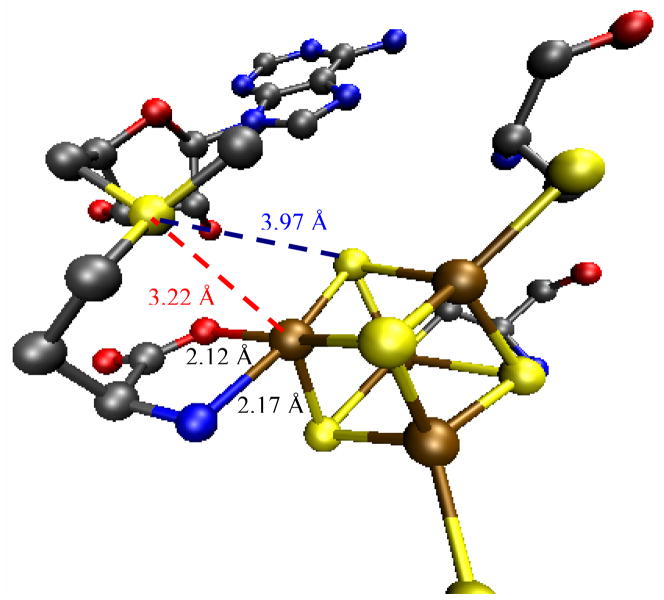
The optimized geometry of the SAM bound cluster shows a normal compressed [Fe4S4]2+ cubane geometry. The distances reproduce the crystallographic parameters reasonably well. The calculated Fe-N and the Fe-O distances of the unique Fe are longer (0.1–0.2 Å) than the observed distances in the PFL-AE crystal structure (2.77 Å resolution),10 but are quite close to those reported for the higher resolution structure of HydE (1.62Å), another radical SAM enzyme.16 Given the resolution of both structures, the calculated distances can be considered to be within error. In particular, the S atom of the SAM is closer to the unique Fe (SSAM-Fe = 3.45 Å, Table 1) than to the μ3Ssulfide (SSAM-μ3Ssulfide = 3.78 Å, Table 1) consistent with the shorter SSAM-Fe bond length observed in the crystal structure (SSAM-Fe = 3.22 Å, SSAM-μ3Ssulfide = 3.97 Å).10 The distances of the methyl C and the methyl H from the Fe are 4.5 Å and 3.75 Å, respectively, in the computational model, consistent with published ENDOR indicating distances of 4–5 Å and 3–3.8 Å, respectively.12, 15
Table 1.
Optimized Bondlengths of the Calculated Models (Å)a
| Fe-μ3Ssulfide | Fe-Sthiolate | Fe-O | Fe-N | SSAM-Fe | SSAM-μ3Ssulfide | |
|---|---|---|---|---|---|---|
| Model A | 2.28 | 2.24 | 2.21 | |||
| Model B | 2.29 | 2.28 | 1.87 | |||
| Model C | 2.30 | 2.28 | 2.06 | 2.32 | ||
| Model D | 2.31 | 2.24 | 2.22 | 2.34 | 3.45 | 3.78 |
| X-Ray | ||||||
| PFL-AE10 (2.77 Å) | (2.30) | (2.27) | (2.12) | (2.17) | (3.22) | (3.97) |
| HydE16 (1.62 Å) | (2.30) | (2.29) | (2.25) | (2.33) | (3.25) | (3.90) |
These theoretical active site models represent unconstrained geometry minima. Thus the optimized parameters are compared to both high and low resolution structures of SAM bound cluster. The higher resolution of the HydE structure justifies the comparison of the bond lengths up to two decimal places.
The binding of SAM to the unique site of the Fe4S4 cluster, which presumably occurs by displacement of a bound H2O or HO−, results in a clear increase of pre-edge intensity in the experimental XAS data (Fig. 2B). The OH− bound form (model B) is calculated to have 369% μ3Ssulfide and 90% Sthiolate 3p character (Table 2) mixed in to the unoccupied Fe3d antibonding orbitals (18 unoccupied orbitals, 9α + 9β, each orbital wavefunction is normalized, thus these S3p characters are out of 1800%). The H2O bound model A has 380% μ3Ssulfide and 121% Sthiolate 3p mixing. The higher S3p mixing into the Fe-S antibonding orbitals in the H2O bound model A relative to that of the OH− bound model B indicates a more covalent Fe-S interaction in the former. The weak donation by the H2O ligand in model A is compensated by the increased donation, particularly by the Sthiolate ligands. Note that this calculated increase in Fe-Sthiolate covalency in model A relative to model B is consistent with 0.04 Å shorter Fe-Sthiolate bondlengths calculated for model A (Table 1).
Table 2.
% S3p Mixing in the Calculated Models
| S3p Mixing in unoccupied manifold | |||
|---|---|---|---|
| Fe-μ3Ssulfide | Fe-Sthiolate | Total | |
| Model A | 380 | 121 | 501 |
| Model B | 369 | 90 | 459 |
| Model C | 377 | 84 | 461 |
| Model D | 369 | 111 | 480 |
The SAM bound model D is calculated to have 369% μ3Ssulfide and 111% Sthiolate mixed into the antibonding orbitals. The calculations indicate that in addition to the S3p mixing into the 18 Fe-S antibonding orbitals (9α+9β) there is significant thiolate and μ3Ssulfide S3p mixing into the low-lying C-S σ* orbitals of SAM. Normally, as observed in our XAS experiments for cysteine and methionine, the C-S σ* orbitals (rising edge transitions) are 2–3 eV higher in energy than the Fe-S antibonding manifold (pre-edge transitions). The positive charge on the sulfonium center stabilizes the C-S σ* orbitals of the SAM and lowers their energy into the Fe-S anti-bonding manifold. Thus the transitions from the cluster μ3Ssulfide and Sthiolate 1s orbitals to the C-S σ* orbitals of SAM have energies similar to the S1s → Fe3d pre-edge transitions of the Fe4S4 cube and contribute to the pre-edge intensity. Note that while the C-S σ* orbitals of SAM also contain S3p of the sulfonium sulfur, this does not contribute due to the stabilization of the sulfonium S1s orbital. The total S3p contributions to the unoccupied Fe3d based anti-bonding molecular orbitals and the C-S σ* orbitals add up to 480% (thiolate and sulfide). This is significantly higher than the 459% calculated for hydroxide bound model B but much lower than the value calculated for the H2O bound model A (501%). Thus replacement of an OH− ligand by SAM is consistent with the experimentally observed increase edge intensity upon SAM binding (Fig. 2, B). Note that the calculated %S3p the bidentate ligand model C (table 2) does not show a change relative to the OH model B. Thus the increase of S3p character upon SAM binding has contribution from the bidentate co-ordination of SAM.
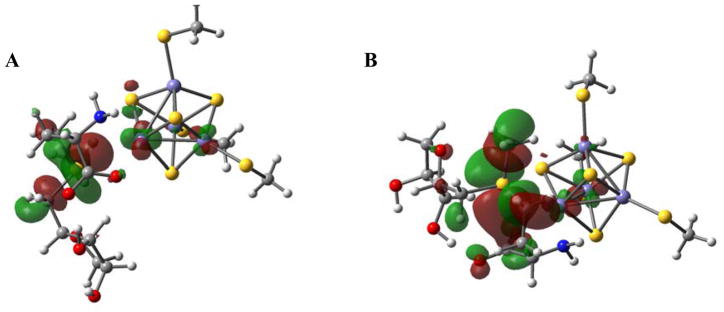
The DFT calculations reproduce the experimentally observed increase in pre-edge intensity upon SAM binding to the Fe4S4 cluster of PFL-AE. This is due to S3p character of cluster μ3Ssulfide and Sthiolate ligands mixed into the low-lying C-S σ* orbitals of SAM. The contours of the C-S σ* orbitals indicate that; 1) the S3p mixing is maximum in the CS σ* orbital of S-ribose (Fig. 4A) and minimal in the other two C-S σ* orbitals of SAM (Fig. 4B), and 2) the mixing is through the unique Fe of the cubane which is at 3.45 Å distance from the sulfonium center of SAM. This direct backbonding interaction of the unique Fe with the C-S σ* orbital of S-ribose reflects its orientation. This provides the charge transfer pathway from the cluster μ3Ssulfide and Sthiolate ligands into the specific S-ribose C-S σ* orbital without affecting the other C-S σ* orbitals of SAM. This is direct experimental verification of the configurational interaction (CI) that is present between the Fe4S4 cluster and the C-S σ* bond of SAM. This direct interaction has been proposed to play a major role in lowering the reductive cleavage barrier.16, 42
Figure 4.
C- S σ* orbitals. A) CAdo-S σ* orbital showing direct interaction with the unique Fe and B) The CMetthione-S σ* orbital with minimal interaction with the unique Fe.
B. Correlation to Reactivity
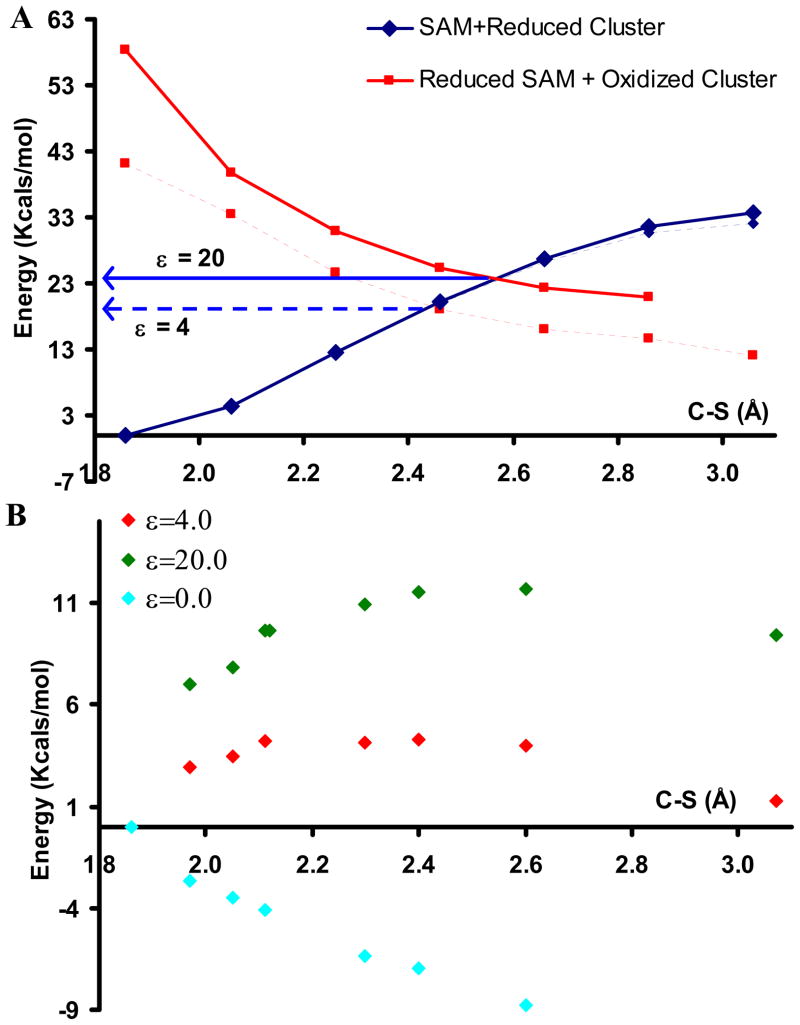
Reductive cleavage of SAM by most radical SAM enzymes occurs specifically at the CAdo-S bond. This could occur by an outer sphere process involving transfer of an electron from a reduced isolated SAM-bound Fe4S4 cluster (Dred) to an isolated SAM molecule (ΔEET) followed by a reductive cleavage of reduced SAM (ΔERC) to form methionine (Met) and a deoxyadenosyl radical (Ado·). Alternatively, an inner-sphere process can be envisioned in which the SAM undergoing reductive cleavage is directly bound to the cluster providing the electron. Potential energy surfaces (PES) of the outer-sphere and inner-sphere (i.e. SAM bound directly to the Fe4S4 cluster) reactions were evaluated. The results for the outer sphere process with a PCM model having ε=4.0 show that the reactant surface (SAM + Reduced Cluster, dashed blue in Fig. 5A) is gradually destabilized as the C-S bond is cleaved. The highest point on this surface (32 Kcal/mol) is at the dissociative limit. The product surface, where the electron is transferred from the cluster to the SAM and the C-S bond is sequentially elongated, (Reduced SAM + Oxidized Cluster, Fig. 6A, dashed red) is stabilized along the reaction coordinate. These surfaces cross at a C-S bond length of 2.45 Å which yields a barrier of 18 Kcal/mol for ε=4.0. This outer sphere electron transfer process has a calculated total energy of ΔEout = 3 Kcal/mol when a PCM solvation model with an ε = 4.0 is used (extrapolated from ε=4 curve in Fig. 5A). However the initial ΔEET is + 40 Kcal/mol (vertical energy separation between the reactant and product surface as C-S =1.85 Å) which is too high for this reaction to proceed at a reasonable rate at room temperature.
Figure 5.
A) Potential Energy Surface of C-S bond cleavage in the outer-sphere model with an ε=4.0 (dashed lines) and ε=20.0 (bold lines). The blue line indicates the reactant surface and the red line indicates the product surface. B) The potential energy surface of the C-S bond cleavage in the inner-sphere model in gas phase (cyan), ε=4.0 (red) and ε=20 (green).
Figure 6.
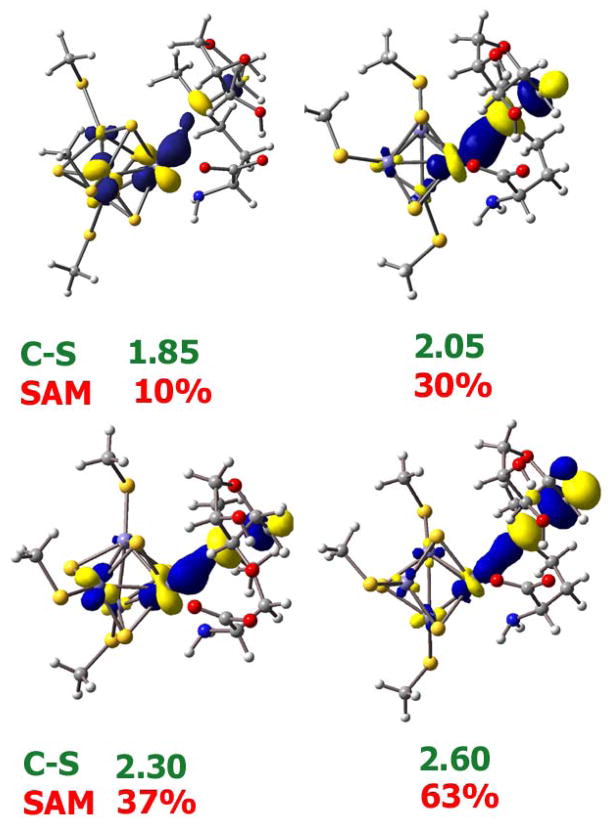
Plot of HOMO along the C-S bond cleavage pathway for the inner-sphere model D. The C-S bond length (in Å) are in green and the %C-S σ* character in the HOMO is given in red.
These results are consistent with the values obtained by Saveant et al.43 However these surfaces are sensitive to the polarity of the medium. This is illustrated by the PES obtained by using a PCM model with an ε = 20.0. The product surface (Fig. 5A, bold red) is significantly destabilized relative to that for the ε=4.0 surface (Fig. 5A, dashed red). As a result the crossing point (i.e. the barrier for reductive cleavage) is now shifted 7 Kcal/mol higher in energy to 25 Kcal/mol. This is because the reactant surface, with the −2 charged cluster and +1 charge SAM, has more charge separation than the product surface which has a −1 cluster and neutral Ado·. Thus a polar medium stabilizes the reactant increasing the reaction barrier.
Similar PES calculations for the inner sphere ET model, where the SAM undergoing reductive cleavage is bound to the cluster, show that the reductive cleavage of the CAdo-S bond is dissociative in the gas phase (Fig. 5B, cyan). This indicates that the CAdo-S bond should spontaneously cleave once SAM is bound to the cluster and the cluster is reduced. This is because of the efficient CI between the Fe and the CAdo-S σ* orbitals. However when solvation is introduced in these calculations, the surface shows barriers. The barrier height increases with increasing ε of the PCM model. On including solvation with ε of 4.0 and 20.0 the barrier increases to 4 Kcal/mol (Fig. 5B, red) and 12 Kcal/mol (Fig. 5B, green), respectively. This is in the range of experimental as well as recent theoretical estimates of 13–14 Kcal/mol for the Fe4S4 substrate complex.16
Discussion
S K-edge XAS on the SAM bound Fe4S4 cluster of PFL-AE shows an increase in pre-edge intensity relative to the resting cluster (Fig. 2). XAS data on free SAM indicate that this increase in pre-edge intensity is not due to free SAM in solution. Thus this pre-edge intensity increase provides direct experimental evidence that the electronic structure of the Fe4S4 cluster is significantly perturbed on SAM binding. DFT calculations reproduce this increase in pre-edge intensity and indicate that it is due to backbonding from the occupied orbitals (having both sulfide and thiolate character) of the cluster into the CAdo-S σ* orbital. These orbitals are at a much lower energy relative to the C-S σ* orbitals of a thiolate or thioether due to the positive charge on the sulfonium ion. The pathway for the backbonding interaction involves the unique Fe of the cube (Fig. 4A) and the sulfonium S of SAM, separated by 3.45 Å in the optimized structure vs 3.22 Å in the crystal structure; this unique iron → sulfonium sulfur pathway is consistent with recent reports.16 The orientation of CAdo-S bond trans to the Fe-SSAM bond specifically shifts charge density from the cluster into the CAdo-S σ* orbital, thereby activating it for cleavage.
This backbonding interaction is significantly increased for the reduced cluster as the energy of the occupied Fe3d manifold is elevated and closer to that of the CAdo-S σ* orbital. This leads to strong CI between the Fe and the SAM (Fig. 6, C-S =1.85 Å). As the CAdo-S bond is elongated along the reaction coordinate, the CAdo-S σ* orbital is lowered in energy which further enhances the CI (Fig. 6). This efficient CI between the [Fe4S4]+ donor and the C-S σ* acceptor orbitals allows facile cleavage of the CAdo-S bond. In the case of an unbound SAM the reaction has a large barrier due to unfavorable electron transfer from cluster to SAM, as there is no CI between the cluster and the CAdo-S σ* orbital to lower the energy for ET (Fig. 5A). Interestingly, perusal of the literature reveals a direct correlation between the Fe-SSAM distances reported in several radical SAM enzyme crystal structures and their corresponding rates of uncoupled cleavage (reductive cleavage of SAM in the absence of substrate): as the Fe-SSAM distance gets shorter, the rate of reductive SAM cleavage is increased (Table 3). This is consistent with better CI interactions between Fe and SSAM at shorter Fe-SSAM distances.
Table 3.
Crystallographic parameters and rates of uncoupled cleavage of several AdoMet dependent Fe-S proteins
| Structure PDB id: | Resolution | Fe-N | Fe-O | Fe-SSAM | S-SSam | Rate |
|---|---|---|---|---|---|---|
| MoaA 1TV8 | 2.20 | 2.30 | 1.97 | 3.19 | 3.45 | 0.3 min−1 [44] |
| PFL-AE 3CB8 | 2.77 | 2.17 | 2.12 | 3.22 | 3.97 | 0.03 min−1 [a] |
| HydE 3IIZ | 1.62 | 2.33 | 2.25 | 3.25 | 3.90 | 0.015 min−1 [45] |
| HemN 1OLT | 2.07 | 2.55 | 2.24 | 3.49 | 3.70 | 0.0007 min−1 [46] |
| BioB 1R30 | 3.40 | 2.48 | 3.19 | 3.75 | 4.16 | nd [47, b] |
Unpublished data,
Too slow to determine..
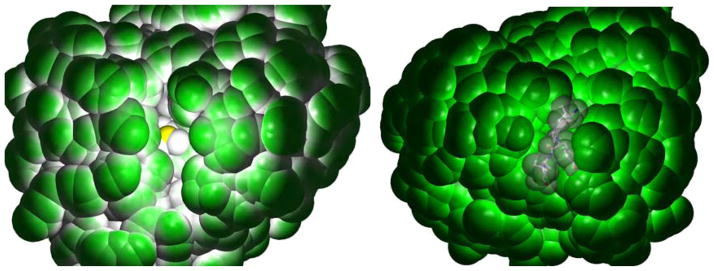
An important finding in this study is the role of the polarity of the medium in tuning the barrier for reductive cleavage of the C-S bond. This is clearly reflected in the reductive cleavage surface (Fig. 5), where the reaction barrier increases with increasing polarity for both the outer-sphere and inner-sphere models. Note that the inner-sphere reaction surface is dissociative in the gas phase. This may play a role in tuning reactivity of these SAM dependent enzymes. Recent crystallographic data on the SAM dependent PFL-AE show that in the absence of substrate, the SAM binding cavity is solvent exposed and the sulfonium sulfur is visible from the surface (Fig. 7, left, yellow atom in the center). However, on docking, the polypeptide substrate blocks the solvent accessibility to the active site of PFL-AE (Fig. 8, right, substrate in the center). This could lower the dielectric near the active site which, from Fig. 5B, will lead to lowering of the reductive cleavage barrier. This is consistent with the fact that substrate is required to lower the barrier for the reductive cleavage of the SAM bound cluster. Note that the lowering of dielectric near the Fe-S cluster has been related to lowering of its Eo.31 This is because lowering the polarity of the cluster environment will tend to stabilize the 2- charged oxidized state more than the 3- charged reduced state. In fact in the radical SAM enzyme LAM, the binding of substrate lysine is found to lower the Eo of the Fe-S cluster by >150 mV.48 In the crystal structures of other SAM bound proteins like MoaA and HemN, the substrate binding site is filled with solvent.19, 20 Upon substrate binding one may expect these water molecules to be replaced (similar to the case for PFL-AE) and the pocket to become more hydrophobic as the substrate (generally bearing an organic backbone) is non-polar relative to water. The DFT calculations show that the lowering of dielectric of the medium lowers the barrier of reductive cleavage of SAM. Thus the lowering of dielectric upon substrate binding may provide a trigger that initiates reductive cleavage of SAM by the radical SAM enzymes.
Figure 7.
Space filling model of the crystal structure of the SAM bound substrate free (pdb id: 3C8F, left) and the SAM and peptide substrate bound (pdb id: 3CB8, right) PFL-AE.
In summary, S K-edge XAS provides direct experimental evidence for the interaction of the FeS cluster in PFL-AE with SAM in the resting oxidized state. DFT calculations that reproduce the experimental data indicate that this is due to a backbonding interaction between the occupied cluster orbitals and the C-S σ* orbitals of the SAM. The results suggest that that presence of this backbonding between the cluster and SAM is key in overcoming large outer-sphere barrier of electron transfer from the cluster to the SAM. The reductive cleavage of the C-S bond is however calculated to be sensitive to the dielectric around the active site and this sensitivity may provide a mechanism for triggering this reactivity upon substrate binding to avoid generation of Ado radical in the absence of substrate.
Supplementary Material
Figure 1.
A view of the SAM-cluster interaction based on the crystal structure of PFL-AE with SAM bound (pdb id: 3CB8). Fe (brown), S (yellow), N (blue), O (red) and C (black).
Acknowledgments
This research was supported by NIH Grants 0446304 (E.I.S.), RR-001209 (K.O.H.), GM54608 (J.B.B.). SSRL operations are supported by the Department of Energy, Office of Basic Energy Sciences. The SSRL Structural Molecular Biology Program is supported by the National Institutes of Health, National Center for Research Resources, Biomedical Technology Program (5 P41 RR001209), and by the Department of Energy, Office of Biological and Environmental Research.
Footnotes
Supporting Information Available. The optimized co-ordinates of the models and the full reference for Gaussian 03 are available at the World Wide Web at http://pubs.acs.org.
References
- 1.Frey PA, Hegeman AD, Ruzicka FJ. Crit Rev Biochem Mol Biol. 2008;43(1):63–88. doi: 10.1080/10409230701829169. [DOI] [PubMed] [Google Scholar]
- 2.Shepard EM, Boyd ES, Broderick JB, Peters JW. Curr Opin Chem Biol. doi: 10.1016/j.cbpa.2011.02.012. In Press, Corrected Proof. [DOI] [PubMed] [Google Scholar]
- 3.Henshaw TF, Cheek J, Broderick JB. J Am Chem Soc. 2000;122(34):8331–8332. [Google Scholar]
- 4.Knappe J, Neugebauer FA, Blaschkowski HP, Gänzler M. Proc Natl Acad Sci U S A. 1984;81:1332. doi: 10.1073/pnas.81.5.1332. [DOI] [PMC free article] [PubMed] [Google Scholar]
- 5.Wagner AFV, Frey M, Neugebauer FA, Schäfer W, Knappe J. Proc Natl Acad Sci U S A. 1992;89:996. doi: 10.1073/pnas.89.3.996. [DOI] [PMC free article] [PubMed] [Google Scholar]
- 6.Frey M, Rothe M, Wagner AFV, Knappe J. J Biol Chem. 1994;269:12432. [PubMed] [Google Scholar]
- 7.Krebs C, Broderick WE, Henshaw TF, Broderick JB, Huynh BH. J Am Chem Soc. 2002;124(6):912–913. doi: 10.1021/ja017562i. [DOI] [PubMed] [Google Scholar]
- 8.Knappe J, Sawers G. FEMS Microbiol Rev. 1990;75:383. doi: 10.1111/j.1574-6968.1990.tb04108.x. [DOI] [PubMed] [Google Scholar]
- 9.Becker A, Fritz-Wolf K, Kabsch W, Knappe J, Schultz S, Wagner AFV. Nat Struct Mol Biol. 1999;6:969. doi: 10.1038/13341. [DOI] [PubMed] [Google Scholar]
- 10.Vey JL, Yang J, Li M, Broderick WE, Broderick JB, Drennan CL. Proc Natl Acad Sci U S A. 2008;105(42):16137–16141. doi: 10.1073/pnas.0806640105. [DOI] [PMC free article] [PubMed] [Google Scholar]
- 11.Peng Y, Veneziano SE, Gillispie GD, Broderick JB. J Biol Chem. 2010;285:27224. doi: 10.1074/jbc.M109.096875. [DOI] [PMC free article] [PubMed] [Google Scholar]
- 12.Walsby CJ, Hong W, Broderick WE, Cheek J, Ortillo D, Broderick JB, Hoffman BM. J Am Chem Soc. 2002;124(12):3143–3151. doi: 10.1021/ja012034s. [DOI] [PubMed] [Google Scholar]
- 13.Walsby CJ, Ortillo D, Yang J, Nnyepi MR, Broderick WE, Hoffman BM, Broderick JB. Inorg Chem. 2005;44(4):727–741. doi: 10.1021/ic0484811. [DOI] [PubMed] [Google Scholar]
- 14.Chen D, Walsby C, Hoffman BM, Frey PA. J Am Chem Soc. 2003;125(39):11788–11789. doi: 10.1021/ja036120z. [DOI] [PubMed] [Google Scholar]
- 15.Walsby CJ, Ortillo D, Broderick WE, Broderick JB, Hoffman BM. J Am Chem Soc. 2002;124(38):11270–11271. doi: 10.1021/ja027078v. [DOI] [PubMed] [Google Scholar]
- 16.Nicolet Y, Amara P, Mouesca JM, Fontecilla-Camps JC. Proc Natl Acad Sci U S A. 2009;106(35):14867–14871. doi: 10.1073/pnas.0904385106. [DOI] [PMC free article] [PubMed] [Google Scholar]
- 17.Lepore BW, Ruzicka FJ, Frey PA, Ringe D. Proc Natl Acad Sci U S A. 2005;102(39):13819–13824. doi: 10.1073/pnas.0505726102. [DOI] [PMC free article] [PubMed] [Google Scholar]
- 18.Berkovitch F, Nicolet Y, Wan JT, Jarrett JT, Drennan CL. Science (Washington, DC, U S) 2004;303:76–79. doi: 10.1126/science.1088493. [DOI] [PMC free article] [PubMed] [Google Scholar]
- 19.Hanzelmann P, Schindelin H. Proc Natl Acad Sci U S A. 2004;101:12870–12875. doi: 10.1073/pnas.0404624101. [DOI] [PMC free article] [PubMed] [Google Scholar]
- 20.Layer G, Moser J, Heinz DW, Jahn D, Schubert WD. EMBO J. 2003;22:6214. doi: 10.1093/emboj/cdg598. [DOI] [PMC free article] [PubMed] [Google Scholar]
- 21.Nicolet Y, Rubach JK, Posewitz MC, Amara P, Mathevon C, Atta M, Fontecave M, Fontecilla-Camps JC. J Biol Chem. 2008;283:18861. doi: 10.1074/jbc.M801161200. [DOI] [PubMed] [Google Scholar]
- 22.Cosper NJ, Booker SJ, Frey PA, Scott RA. Biochemistry (Moscow) 2000;39:15668. doi: 10.1021/bi0022184. [DOI] [PubMed] [Google Scholar]
- 23.Daley CJA, Holm RH. Inorg Chem. 2001;40(12):2785–2793. doi: 10.1021/ic010039k. [DOI] [PubMed] [Google Scholar]
- 24.Solomon EI, Hedman B, Hodgson KO, Dey A, Szilagyi RK. Coord Chem Rev. 2005;249(1–2):97–129. [Google Scholar]
- 25.Neese F, Hedman B, Hodgson KO, Solomon EI. Inorg Chem. 1999;38(21):4854–4860. doi: 10.1021/ic990461p. [DOI] [PubMed] [Google Scholar]
- 26.Sarangi R, DeBeer George S, Rudd DJ, Szilagyi RK, Ribas X, Rovira C, Almeida M, Hodgson KO, Hedman B, Solomon EI. J Am Chem Soc. 2007;129(8):2316–2326. doi: 10.1021/ja0665949. [DOI] [PMC free article] [PubMed] [Google Scholar]
- 27.Glaser T, Hedman B, Hodgson KO, Solomon EI. Acc Chem Res. 2000;33(12):859–868. doi: 10.1021/ar990125c. [DOI] [PubMed] [Google Scholar]
- 28.Rose K, Shadle SE, Eidsness MK, Kurtz DM, Scott RA, Hedman B, Hodgson KO, Solomon EI. J Am Chem Soc. 1998;120(41):10743–10747. [Google Scholar]
- 29.Rose K, Shadle SE, Glaser T, de Vries S, Cherepanov A, Canters GW, Hedman B, Hodgson KO, Solomon EI. J Am Chem Soc. 1999;121(11):2353–2363. [Google Scholar]
- 30.Shadle SE, Hedman B, Hodgson KO, Solomon EI. Inorg Chem. 1994;33(19):4235–4244. [Google Scholar]
- 31.Dey A, Jenney FEJ, Adams MWW, Babini E, Takahashi Y, Fukuyama K, OHK, Hedman B, Solomon EI. Science. 2007;318:1464–1468. doi: 10.1126/science.1147753. [DOI] [PubMed] [Google Scholar]
- 32.Sun N, Dey A, Xiao Z, Wedd AG, Hodgson KO, Hedman B, Solomon EI. J Am Chem Soc. 2010;132(36):12639–12647. doi: 10.1021/ja102807x. [DOI] [PMC free article] [PubMed] [Google Scholar]
- 33.Broderick JB, Henshaw TH, Cheek J, Wojtuszewski K, Smith SR, Trojan MR, McGhan RM, Kopf A, Kibbey M, Broderick WE. Biochem Biophys Res Commun. 2000;269:451–456. doi: 10.1006/bbrc.2000.2313. [DOI] [PubMed] [Google Scholar]
- 34.Hedman B, Frank P, Gheller SF, Roe AL, Newton WE, Hodgson KO. J Am Chem Soc. 1988;110(12):3798–3805. [Google Scholar]
- 35.Tenderholt A. Pyspline. 2007 [Google Scholar]
- 36.Frisch M. [Google Scholar]
- 37.Perdew JP. Physical Review B (Condensed Matter) 1986;33(12):8822–8824. doi: 10.1103/physrevb.33.8822. [DOI] [PubMed] [Google Scholar]
- 38.Becke AD. Phys Rev A. 1988;38(6):3098–3100. doi: 10.1103/physreva.38.3098. [DOI] [PubMed] [Google Scholar]
- 39.Miertus S, Scrocco E, Tomasi J. Chem Phys. 1981;55(1):117–129. [Google Scholar]
- 40.Beinert H, Kennedy MC, Stout CD. Chem Rev. 1996;96(7):2335–2374. doi: 10.1021/cr950040z. [DOI] [PubMed] [Google Scholar]
- 41.Flint DH, Allen RM. Chem Rev. 1996;96(7):2315–2334. doi: 10.1021/cr950041r. [DOI] [PubMed] [Google Scholar]
- 42.Kamachi T, Kouno T, Doitomi K, Yoshizawa K. J Inorg Biochem. 2010;105(6):850–857. doi: 10.1016/j.jinorgbio.2011.03.013. [DOI] [PubMed] [Google Scholar]
- 43.Andrieux CP, Robert M, Saeva FD, Saveant JM. J Am Chem Soc. 1994;116(17):7864–7871. [Google Scholar]
- 44.Lees NS, Hänzelmann P, Hernandez HL, Subramanian S, Schindelin H, Johnson MK, Hoffman BM. J Am Chem Soc. 2009;131:9184. doi: 10.1021/ja903978u. [DOI] [PMC free article] [PubMed] [Google Scholar]
- 45.Rubach JK, Brazzolotto X, Gaillard J, Fontecave M. FEBS Lett. 2005;579:5055. doi: 10.1016/j.febslet.2005.07.092. [DOI] [PubMed] [Google Scholar]
- 46.Layer G, Grage K, Teschner T, Schünemann V, Breckau D, Masoumi A, Jahn M, Heathcote P, Trautwein AX, Jahn D. J Biol Chem. 2005;280:29038. doi: 10.1074/jbc.M501275200. [DOI] [PubMed] [Google Scholar]
- 47.Taylor AM, Farrar C, Jarrett JT. Biochemistry. 2008;47:9309. doi: 10.1021/bi801035b. [DOI] [PMC free article] [PubMed] [Google Scholar]
- 48.Hinckley GT, Frey PA. Biochemistry. 2006;45(10):3219–3225. doi: 10.1021/bi0519497. [DOI] [PMC free article] [PubMed] [Google Scholar]
Associated Data
This section collects any data citations, data availability statements, or supplementary materials included in this article.


