

Abstract
Cancer gene fusions that encode a chimeric protein are often characterized by an intragenic discontinuity in the RNA expression levels of the exons that are 5′ or 3′ to the fusion point in one or both of the fusion partners due to differences in the levels of activation of their respective promoters. Based on this, we developed an unbiased, genome-wide bioinformatic screen for gene fusions using Affymetrix Exon array expression data. Using a training set of 46 samples with different known gene fusions, we developed a data analysis pipeline, the “Fusion Score (FS) model”, to score and rank genes for intragenic changes in expression. In a separate discovery set of 41 tumor samples with possible unknown gene fusions, the FS model generated a list of 552 candidate genes. The transcription factor gene NCOA2 was one of the candidates identified in a mesenchymal chondrosarcoma. A novel HEY1-NCOA2 fusion was identified by 5′ RACE, representing an in-frame fusion of HEY1 exon 4 to NCOA2 exon 13. RT-PCR or FISH evidence of this HEY1-NCOA2 fusion was present in all additional mesenchymal chondrosarcomas tested with a definitive histologic diagnosis and adequate material for analysis (n=9) but was absent in 15 samples of other subtypes of chondrosarcomas. We also identified a NUP107-LGR5 fusion in a dedifferentiated liposarcoma but analysis of 17 additional samples did not confirm it as a recurrent event in this sarcoma type. The novel HEY1-NCOA2 fusion appears to be the defining and diagnostic gene fusion in mesenchymal chondrosarcomas.
INTRODUCTION
Several hundred specific gene fusions have been identified in human cancers, and many of these have emerged as diagnostic or prognostic markers, and some, as therapeutic targets (Mitelman et al., 2007). Sarcomas are a broad and heterogeneous group of cancers, of which at least 50 different histological subtypes have been described. Genetic studies have defined characteristic genetic changes in many sarcoma types, a majority of which were specific gene fusions. Indeed, recurrent, tumor-type specific gene fusions have been identified in about one third of sarcoma histological subtypes (Mitelman et al., 2007; Mertens et al., 2009). In contrast, in the remaining two thirds of sarcomas, no characteristic genetic aberrations have been identified.
Historically, the identification of fusion genes has largely been dependent on the detection of structural chromosomal abnormalities by conventional cytogenetic analysis. In recent years, novel gene fusions have been identified based on the detection of cryptic genomic aberrations using new genome-wide screening approaches accompanied by powerful computational data analysis method (Tomlins et al., 2005; Soda et al., 2007; Ozawa et al., 2010).
The Affymetrix GeneChip® Human Exon 1.0 ST Array consists of 1.4 million probe sets targeting more than one million exon clusters across the entire genome. This array design enables two complementary levels of analysis: “gene-level” expression analysis and “exon-level” expression analysis. The “exon-level” analysis allows to distinguish between different isoforms of gene transcripts. The fundamental rationale for exon-level expression profiling in the detection of fusion genes is based on the observation that most gene fusions that lead to the formation of a chimeric fusion protein cause an intragenic discontinuity in the RNA expression level of the exons that are 5′ or 3′ to the fusion point in one or both of the fusion partners. This is attributable to the differences in the strength or activity of the promoters of the two translocation partner genes. Additionally, in some cases, the non-oncogenic, reciprocal fusion gene may be lost due to an unbalanced translocation event. Therefore, in the present study, we developed a genome-wide screen for gene fusions using Affymetrix Exon array expression data to study a variety of tumor samples with poorly understood genetics, of which the majority were mesenchymal or embryonal tumors. We demonstrate the successful application of this approach in detection of gene fusions without prior knowledge of the genetic background of a given case, and describe the identification of a novel, recurrent HEY1-NCOA2 fusion in mesenchymal chondrosarcoma.
MATERIALS AND METHODS
Samples
Exon Array profiling was performed on 87 samples from 13 tumor cell lines and 74 primary tumor tissues, including 46 samples with different known gene fusions previously confirmed by RT-PCR. Tables 1 summarize the samples subjected to the Exon array-based analysis in this study. Detail information of all the 87 samples is available from supplementary Table 2. For HEY1-NCOA2 fusion screening, 14 cases histologically diagnosed as definite or probable mesenchymal chondrosarcoma were collected, including 11 FFPE tissues and 3 RNA samples. The histologic diagnosis in each case is listed in Table 3. FFPE tissues of 11 cases from Memorial Sloan-Kettering Cancer Center (MSK_1 to MSK_11) were tested by RT-PCR and FISH. In addition, three RNA samples (L1, L2, L3) isolated from frozen tumors of patients diagnosed at Leiden University Medical Center (Leiden, The Netherlands) were subjected to RT-PCR only.
TABLE 1.
List of Samples Subjected to the Exon Array-Based Analysis in Alphabetic Order of Tumor Type (Test Samples are Highlighted in Bold Along with the Given IDs)
| Tumor (ID for test samples) | Fusion gene | Number of samples | ||
|---|---|---|---|---|
| Tissue | Cell line | Total | ||
| Adamantinoma (UF9) | - | 1 | - | 1 |
| Alveolar rhabdomyosarcoma | PAX3-FKHR | 2 | 1 | 3 |
| Alveolar soft part sarcoma | ASPL-TFE3 | 3 | 1 | 4 |
| Anaplastic Oligodendroglioma (UF11) | - | 1 | - | 1 |
| Chondroblastoma (UF18) | - | 1 | - | 1 |
| Chondromyxoid fibroma (UF1) | - | 1 | - | 1 |
| Chronic Myelogenous leukemia | BCR-ABL | 2 | - | 2 |
| Clear cell sarcoma | EWS-ATF1 | 2 | 1 | 3 |
| Clear Cell Sarcoma _ Kidney (UF12) | - | 1 | - | 1 |
| Dedifferentiated liposarcoma (UF2) | - | 1 | - | 1 |
| Desmoplastic small round cell tumor | EWS-WT1 | 3 | 1 | 4 |
| Embryonal rhabdomyosarcoma (UF10) | - | 1 | - | 1 |
| Ewing’s sarcoma | EWS-FLI1 type1 | 3 | 2 | 5 |
| EWS-FLI1 type2 | 1 | - | 1 | |
| EWS-FLI1 10-5 | 2 | - | 2 | |
| EWS-ERG | 2 | 1 | 3 | |
| Extraskeletal Myxoid Chondrosarcoma | EWS-CHN | 2 | - | 2 |
|
Gastrointestinal Stromal tumor,
KIT/PDGFRA-neg (UF25-32) |
- | 8 | - | 8 |
| Hodgkin Lymphoma (UF19-20) | - | - | 2 | 2 |
| Immature Teratoma (UF15) | - | 1 | - | 1 |
| Infantile Fibrosarcoma (UF8) | - | 1 | - | 1 |
| Liposarcoma (UF13) | - | 1 | - | 1 |
| Lung Adenocarcinoma | EML4-ALK | - | 1 | 1 |
| Lung adenocarcinoma (UF33-36) | - | 4 | - | 4 |
| Malignant Ectomesenchymoma (UF4) | - | 1 | - | 1 |
| Mesenchymal Chondrosarcoma (UF5) | - | 1 | - | 1 |
| Myxoid Liposarcoma (UF14) | - | 1 | - | 1 |
| Myxoid liposarcoma | TLS-CHOP | 1 | - | 1 |
| Oncocytoma (UF16-17) | - | 2 | - | 2 |
| Prostate cancer | TMPRSS2-ERG | 6 | - | 6 |
| Renal Medullary Carcinoma (UF42) | - | 1 | - | 1 |
| Sarcomas (unclassifiable) (UF21-24) | - | 4 | - | 4 |
| Solitary fibrous tumor (UF6-7) | - | 2 | - | 2 |
| Synovial sarcoma | SYT-SSX1 | 3 | 1 | 4 |
| SYT-SSX2 | 3 | 2 | 5 | |
| Wilms tumor | - | 5 | - | 5 |
| Total | 74 | 13 | 87 | |
TABLE 3.
Summary of Samples Tested for HEY1-NCOA2 Fusion in the Present Study
| ID #* | FISH (% of positive cells) | RT-PCR | Histology diagnosis |
|---|---|---|---|
| UF5 | N/A | positive | Mesenchymal CS |
| MSK_1 | positive (77.5%) | failure | Mesenchymal CS |
| MSK_2 | positive (75%) | failure | Mesenchymal CS |
| MSK_3 | positive (76%) | ? weak positive | Mesenchymal CS |
| MSK_4 | positive (76%) | failure | Mesenchymal CS |
| MSK_5 | positive (72%) | positive | Mesenchymal CS |
| MSK_6 | positive (78%) | positive | Mesenchymal CS |
| MSK_7 | failure due to decal | failure | Mesenchymal CS |
| MSK_8 | positive? (15%) | negative | Mesenchymal CS (biopsy with scant tumor ) |
| MSK_9 | failure | failure | Mesenchymal CS, post-treatment |
| MSK_10 | failure due to decal | failure | Mesenchymal CS |
| MSK_11 | positive (82%) | failure | Mesenchymal CS |
| L_1 | N/A | positive | Mesenchymal CS |
| L_2 | N/A | negative | ? Differential MCS or small cell osteosarcoma |
| L_3 | N/A | positive | Mesenchymal CS |
Samples with both sufficient tumor for pathologic diagnosis and molecular analysis and adequate nucleic acid quality are shown in bold.
Affymetrix Exon Array
For Exon Array analysis, total RNAs were isolated from frozen tissues and tumor cell lines using Trizol reagent (Invitrogene, Carlsbad, CA). RNA quality was assessed on the Agilent 2100 Bioanalyzer (Agilent Technologies, Santa Clara, CA). RNA labeling and hybridization were done using WT Sense Target Labeling Assay (Affymetrix, Santa Clara, CA). Samples were hybridized to Human Exon 1.0 ST array (Affymetrix) following the manufacturer’s protocol. Post-hybridization arrays were washed and stained using the Fluidics station 450; signal was scanned on the Gene Chip Scanner 3000 (Affymetrix).
Fusion Detection using Affymetrix Exon Arrays
The fundamental signal pattern of a cancer gene fusion is a sharp change in exon level expression moving from the 5′ to the 3′ end of one or sometimes both of the translocation partner genes. In order to detect this change, we first normalized the individual exon probe signals to a consistent scale. We used two different methods to compute fusion scores. The first one is based on a Z-score-like transformation, and the other one uses a log transformation of the probes ranks. The first score normalized the probes for a given gene by applying the following
to the log of the probes signal (si=log(expSig)) where mean is the mean of the log signal level for all other samples except the one currently being examined and sigma is the standard deviation. The second method used the ranking of the signal levels for the probes using the following transformation
where si is the signal level of sample i and N is the number of samples. These two normalized signal levels were then used to compute the Fusion Score, which employed the following statistic, inspired from the CBS algorithm [Olshen et al, 2004]:
Here, the Fusion Score is the maximum value of the weighted difference means from 5′ to 3′ along the gene of either the Z or P score. k is the cut point along the 5′ 3′ axis of the gene. This gave two Fusion Scores with slightly different characteristics that were then used for subsequent model learning from training set and fitting.
A non-linear logistic model was fitted to the training set using R package for generalized linear models, glm. The training set included the known EWSR1-FLI1 and EWSR1-WT1-positive cases (using the genes FLl1 and WT1) in 8 tumor samples TM_HuEx_1_JN_DSCRT, TM_HuEx_1_ExDS1, TM_HuEx_1_ExDS2, TM_HuEx_1_ExDS3, LW_Exon1_SK_PN_DW, TM_HuEx_1_ExES4, TM_HuEx_1_ExES6, and TM_HuEx_1_ExES7 for which the fusion outcome was set to 1 (or 1-ε , where ε is a small number) and 32 normal samples for which the fusion outcome was set to zero (or ε ). To maximize the predictive power we learned the model using both independent fusion scores:
Here FS1 and FS2 stand for two fusion scores as defined above, rescaled between 0 and 1, for each sample. The probability of each gene to be involved in a gene fusion in each sample was then computed using the learned model. Genes with high model Fusion Scores in normal tissues were excluded from further consideration as their high scores were likely due to alternative splicing events. Equally, genes that have high Fusion Scores in a large number of unrelated tumor samples were also excluded. We focused on genes that have low scores in the majority of samples, but high scores in samples that belong to one tumor type.
Rapid Amplification of cDNA Ends (RACE)
RACE was performed using the 5′ RACE system from Invitrogen (Carlsbad, CA). In brief, first-strand cDNA synthesis was initiated with a NCOA2-specific reverse primer from exon 13 (NCOA2_E13-R1). After the first-strand cDNA synthesis, the original mRNA template was destroyed with RNase H. The cDNA was purified followed by tailing with dCTP using TdT. The dC-tailed cDNA was then subjected to PCR amplification using the manufacturer’s Abridged Anchor Primer (AAP) as forward primer and another NCOA2-specific reverse primer from exon 13 (NCOA2_E13-R2). To increase the specificity of the process, a semi-nested PCR was performed after the first round PCR, using the manufacturer’s Abridged Universal Anchor Primer (AUAP) as the forward primer and a nested NCOA2-specific reverse primer which also primes from exon 13 of NCOA2 (NCOA2_E13-R3). One ul of a 1:10 dilution of the first-round PCR product was used as the template for the second-round PCR. For both PCR steps, the HotStarTaq polymerase (Qiagen, Valencia, CA) was used. The product of the semi-nested PCR were cloned using the pGEM-T Easy AT-cloning vector system (Promega, Madison, WI), and multiple clones were selected and sequenced on an Applied Biosystems (Foster City, CA) automated sequencer using the dideoxy dye terminator method. Table 2 lists the primer sequences.
TABLE 2.
Primer Sequences for 5′RACE as well as for HEY1-NCOA2 and NUP107-LGR5 Fusion Transcripts
| Primers | Sequences (5′-3′) |
|---|---|
| NCOA2_E13-R1 | CTATCATCCCTTGATTAC |
| NCOA2_E13-R2 | TCCTGGCTGAGGTATCAC |
| NCOA2_E13-R3 | AGTTGGGCTTTGCAATGTGA |
| HEY1_F1 | CGAGGTGGAGAAGGAGAGTG |
| HEY1_F2 | ACCGGATCAATAACAGTTTG |
| LGR5_E14-R1 | ATAATAGCAATTTTGTTC |
| LGR5_E13-R2 LGR5_E12-R3 | TAAGCAACTGCTGGAAAGTG ATGTCTTAGGTCAATTTTCTGAAGC |
| NUP107_E1-F | GCCAACTTTGGTTGTGTGTG |
| LGR5_E13-RV | GATCGGAGGCTAAGCAACTG |
RT-PCR for HEY1-NCOA2
To confirm the presence of the HEY1-NCOA2 fusion transcript detected by 5′RACE, we performed RT-PCR using two independent sets of HEY1 forward and NCOA2 reverse primers, HEY1-F1/NCOA2-R3 and HEY1-F2/NCOA2-R2 (Table 2 lists primer sequences). The primer pair HEY1-F1/NCOA2-R3 was also used for screening for HEY1-NCOA2 fusion transcripts in a set of 14 cases diagnosed histologically as mesenchymal chondrosarcoma. RT-PCR was performed following the protocol described previously (Wang et al., 2007).
Fluorescence In Situ Hybridization
Locus-specific FISH probes were developed using bacterial artificial chromosomes (BAC) clones based on the UCSC Genome Browser database (http://genome.ucsc.edu/). BAC clones were ordered from the Children’s Hospital Oakland Research Institute (Oakland, CA). BAC DNAs were extracted using BACMAX™ DNA purification kit (Epicentre Biotechnologies, Madison, WI) and labeled with either SpectrumOrange-dUTP (red) or SpectrumGreen-dUTP (green) using the nick-translation kit (Vysis/Abbott Molecular, Des Plaines, IL). NCOA2 probe, a combination of BAC clones RP11-126F11 and RP11-152C15, was labeled in green; HEY1 probe, BAC clone RP11-888F10 was labeled in red. The genomic localization of each BAC clone is illustrated in Figure 5A.
Figure 5.
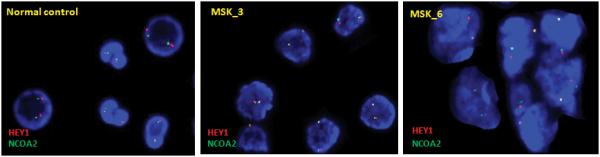
Interphase FISH detection of HEY1-NCOA2 fusion in mesenchymal chondrosarcomas. A, the schema of FISH-probe design. B, representative HEY1-NCOA2 dual-color FISH pictures. Signal pattern in normal cells was shown in the left panel. In contrast, fused signals (visible as one yellow dot, instead of green dot/red dot side by side) were seen in cells of RT-PCR positive cases MSK_3 (middle) and MSK_6 (right).
Four micron (4 μm) FFPE (formalin-fixed paraffin-embedded) sections generated from FFPE blocks of tumor specimens were pretreated by deparaffinizing in xylene and dehydrating in ethanol. Dual-color FISH was performed according to the protocol for FFPE sections from Vysis/Abbott Molecular with a few modifications. FISH analysis and signal capture were performed o n a fluorescence microscope (Zeiss) coupled with ISIS FISH Imaging System (Metasystems). One hundred interphase nuclei from each tumor specimen were analyzed.
RESULTS
Computational Identification of NCOA2 as a Possible Translocation Partner Gene in a Mesenchymal Chondrosarcoma
The raw score-measure algorithms were first validated on cases with known fusions. For many of these, there was a clear disparity in the expression levels of 5′ and 3′ exons of the 3′ fusion partner gene, and the position of the change point of each particular gene was concordant with the known fusion structure in that sample detected by RT-PCR. For instance, this was the case for most or all samples with EWSR1-WT1, EWSR1-FLI1, SYT-SSX1, TMPRSS2-ERG and EML4-ALK fusions. Representative exon expression plots are shown in Figure 1.
Figure 1.
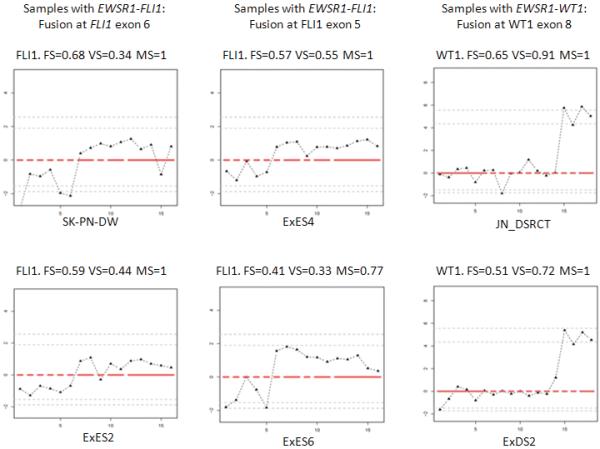
Representative exon expression plots of samples with known fusions for validation of the data analysis pipeline. To visualize the exon level expression data, the normalized relative expression level of each exon (Y axis) was plotted along exons of a given gene from 5′ to 3′ (X axis). Red lines indicated possible exon clusters of the given gene, and solid black triangle indicated each corresponding probe set. Four plots on the left were FLI1 exon expression plots in four different samples with EWSR1-FLI1 fusion. Tumor cell line SK-PN-DW (upper left) and patient sample ES2 (lower left) had EWSR1-FLI1 type I fusion (fusion at FLI1 exon 6); Patient samples ES4 (upper middle) and ES6 (lower middle) had EWSR1-FLI1 type II fusion (fusion at FLI1 exon 5). Two plots on the right were WT1 exon expression plots in two different samples with EWSR1-WT1 fusion. Tumor cell line JN-DSRCT (upper right) and patient sample DS2 (lower right) both show evidence of fusion at WT1 exon 8.
For the 41 tumor samples with possible unknown gene fusions, the bioinformatics data analysis algorithm generated a list of 552 candidate genes showing significant intragenic discontinuity in exon-level expression in one or more samples of a given histology, which were not seen in reference samples for that gene (normal control samples or samples with other known fusions) or in more than two samples of other histologic categories. This list of candidate genes was cross-referenced with a list of genes previously known being involved in cancer gene fusions or belonging to the same gene families. Common genes in both lists which had high FS in only one histology group are listed in supplementary Table 1. For each gene, we also reviewed all the alternative transcripts for that gene in the UCSC database (http://genome.ucsc.edu/), to exclude those candidates where the discontinuity in exon-level expression was likely due to alternative splicing. Finally, additional steps were taken to prioritize candidate genes further based on biological plausibility, including mapping of the predicted breakpoint of each gene to its protein domains. As a result, only a few genes were highly prioritized and selected for experimental validation.
The nuclear receptor transcriptional co-activator gene, NCOA2, was one of the candidates identified in a mesenchymal chondrosarcoma case (sample UF5). The exon expression plot of NCOA2 in case UF5 showed dramatic intragenic discontinuity with the change point mapped between NCOA2 exon 12 and exon 13 (Fig. 2). This pattern was not seen in any other tumor sample or in control normal tissues.
Figure 2.
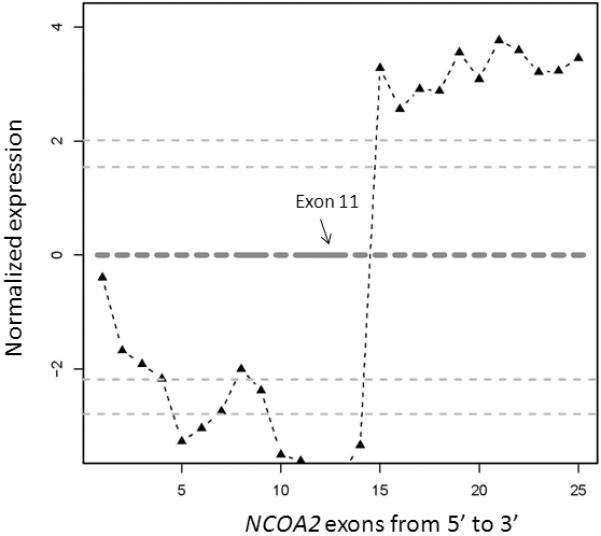
Exon expression plot of NCOA2 in the mesenchymal chondrosarcoma sample UF5, showing the intragenic change in NCOA2 expression. The change point was mapped between exon 12 and exon 13. This exon expression pattern was not seen in any other tumor samples or in normal control tissues.
Identification of a Novel Fusion Transcript, HEY1-NCOA2
Based on the computationally inferred fusion point within the NCOA2 transcript, we performed a 5′RACE procedure to reveal the 5′ fusion partner. Sequence analysis of the NCOA2 5′-RACE products revealed a fusion transcript showing HEY1 exon 4 fused in-frame to NCOA2 exon13 (Fig. 3A). Subsequent RT-PCR testing of this index case using two independent sets of HEY1 forward and NCOA2 reverse primers, HEY1-F1/NCOA2-R3 and HEY1-F2/NCOA2-R2, confirmed the presence of the HEY1-NCOA2 fusion transcript (Fig. 3B). The reciprocal fusion transcript NCOA2-HEY1 was not detected.
Figure 3.
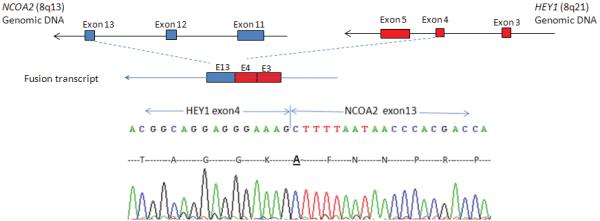
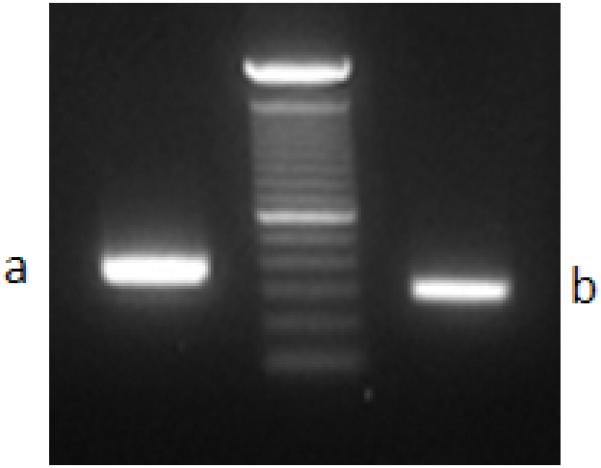
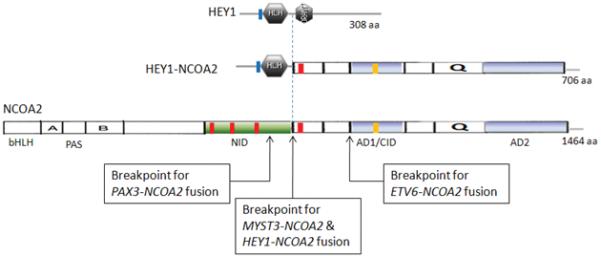
Identification of the novel HEY1-NCOA2 fusion in the mesenchymal chondrosarcoma case UF5. A, Upper: partial schema of HEY1 and NCOA2 gene structures in relation to the formation of HEY1-NCOA2 fusion transcript; Lower: Partial sequence of the HEY1-NCOA2 fusion transcript along with predicted amino acid sequence. The transcript is an in-frame fusion of HEY1 exon 4 to NCOA2 exon 13. B, RT-PCR detection of HEY1-NCOA2 fusion. The presence of HEY1-NCOA2 fusion transcript was confirmed by RT-PCR using two independent sets of HEY1 forward and NCOA2 reverse primers, HEY1-F1/NCOA2-R3 and HEY1-F2/NCOA2-R2. Sequencing of bands a and b confirmed the HEY1-NCOA2 in-frame fusion transcript. Size marker is 100bp DNA ladder (Invitrogen, Carlsbad, CA). C, Schematic diagrams of HEY1, NCOA2 and the predicted HEY1-NCOA2 chimeric proteins as well as mapping of NCOA2 breakpoints of four different fusions in protein level. Symbols and abbreviations for the diagram of HEY1: blue bar stands for the basic motif; HLH, helix-loop-helix domain. Symbols and abbreviations for the diagram of NCOA2: bHLH, basic helix-loop-helix domain; PAS, Per/ARN/Sim homologous domain; NID, nuclear receptor interaction domain; AD1/CID, transcriptional activation domain 1/CBP/p300 interaction domain; AD2, transcriptional activation domain 2; Q, glutamine rich region; red bars stand for LXXLL motifs; orange bar indicates the LLXXLXXXL motif.
HEY1 and NCOA2 are about 10 Mb apart on genomic DNA, respectively mapping to 8q21.1 and 8q13.3, and both are on the reverse strand of chromosome 8. To study whether or not the HEY1-NCOA2 fusion resulted from an interstitial deletion in this sample, we performed SNP6.0 array on genomic DNA from case UF5. A small deletion of the 5′ portion of NCOA2 gene, spanning from 5′UTR to exon 12, was detected (data not show), but further work on additional positive cases will be needed to define the typical genomic mechanism of this fusion.
The predicted HEY1-NCOA2 fusion protein consist of a N-terminal basic helix-loop-helix (bHLH) DNA-binding/protein dimerization domain from HEY1 and C-terminal two transcriptional activation domains (AD1/CID and AD2) provided by NCOA2 (Iso et al., 2003; Xu and Li 2003) (Fig. 3C). The C-terminal portion of NCOA2 retained in the HEY1-NCOA2 fusion protein is exactly identical to that preserved in the MYST3-NCOA2 fusion (Carapeti et al., 1998).
RT-PCR Detection of the HEY1-NCOA2 Fusion in Mesenchymal Chondrosarcomas
To assess whether the novel HEY1-NCOA2 fusion transcript is recurrent in the mesenchymal chondrosarcoma subtype, we screened a collection of patient samples, including 11 FFPE specimens and 3 RNA samples isolated from frozen tissues. RT-PCR was performed using HEY1 forward primer HEY1-F1 and NCOA2 reverse primer NCOA2-R3. RT-PCR for PGK transcript was run on all samples in parallel for RNA quality control. Among these samples, the identical HEY1-NCOA2 fusion transcript was detected in 5/7 cases (MSK_3, MSK_5, MSK_6, L1 and L3) with adequate RNA quality. Two cases, MSK_8 and L2, were negative for HEY1-NCOA2 fusion by RT-PCR test but the former had very low tumor content and the latter had insufficient material for a firm histologic diagnosis (Table 3). As for the remaining 7 cases, all from FFPE tissue, RT-PCR was uninformative due to severe RNA degradation. Figure 4 presents the RT-PCR results of 10 FFPE samples (MSK_1 to MSK_10) and 3 frozen samples (L1 to L3). The RT-PCR products of cases MSK_5 and MSK_6 were subjected to sequencing, and the identical HEY1-NCOA2 fusion sequence as observed in the index case UF5 was observed in both samples.
Figure 4.
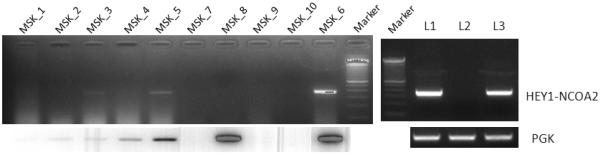
RT-PCR detection of the HEY1-NCOA2 fusion in additional mesenchymal chondrosarcoma cases. Upper panel: RT-PCR performed using HEY1 forward primer HEY1-F1 and NCOA2 reverse primer NCOA2-R3. Lower panel: RT-PCR for PGK transcript. MSK_1 to MSK_10 were 10 FFPE samples and L1~L3 were frozen samples. The identical HEY1-NCOA2 fusion transcript was detected in cases MSK_3 (weak positive due to the very poor quality of RNA), MSK_5, MSK_6, L1 and L3. Size marker is 100bp DNA ladder (Invitrogen, Carlsbad, CA).
Interphase FISH Detection of HEY1-NCOA2 Fusion in Mesenchymal Chondrosarcomas
To evaluate further the HEY1-NCOA2 fusion in FFPE cases with poor RNA quality, we developed a FISH assay. As shown in Figure 5A, the NCOA2 probe, labeled in green, covers the entire 3′ part of the NCOA2 gene which is retained in the HEY1-NCOA2 fusion. As BAC clone RP11-888F10, spanning sequences upstream of HEY1, was labeled in red, fused green/red (yellow) signals were expected in HEY1-NCOA2 fusion cases. HEY1-NCOA2 dual-color FISH was performed on normal bone marrow nucleated cells first. Representative signal patterns of HEY1-NCOA2 dual-color FISH on normal cells are shown in Figure 5B. Considering that HEY1 and NCOA2 are only 10 Mb apart, stringent signal scoring criteria were applied: 1) only fused signals (must be visible as one yellow dot, instead of green dot/red dot side by side) were interpreted positive for HEY1-NCOA2 fusion; 2) signals were scored in about 100 informative cells to calculate the percentage of positive cells; 3) only cases with >20% of cells with a fused signal were interpreted as a positive. Although the percentage of overlapping signals (“fused” by chance) in normal bone marrow cells is about 5%, our long-term FISH experience with similar probes suggests that the upper level variation on negative FFPE samples may be as high as 10-15%. Indeed, in the RT-PCR negative case MSK_8, fused signals were detected in 15% of cells. Therefore, conservatively, only samples with >20% of nuclei with overlapping red-green signals were interpreted as positive in the present study.
HEY1-NCOA2 dual-color FISH was performed on all 11 FFPE-tissue cases (MSK_1 to MSK_11). The HEY1-NCOA2 fusion was detected in 7 cases, including the three RT-PCR positive cases MSK_3, MSK_5, and MSK_6. Representative HEY1-NCOA2 fusion FISH results are shown in Figure 5B. Case MSK_8 was slightly below the cutoff for positivity by FISH assay but contained scant tumor; it is further discussed below. There were also 3 cases that were not analyzable by FISH, in two cases due to decalcification of the tissue and in the remaining one, due to extensive necrosis of tumor tissue after treatment.
HEY1-NCOA2 is the Prevalent and Characteristic Fusion in Mesenchymal Chondrosarcoma
Table 3 summarizes the samples tested for the HEY1-NCOA2 fusion, including FISH results, RT-PCR results and histology diagnoses. The histology of each case was reviewed by M.H. and M.L. (MSKCC cases MSK_1 to MSK_14) or P.C.H. and J.M.B. (Leiden University Medical Center cases L1 to L3). In Case MSK_8, the histological diagnosis of mesenchymal chondrosarcoma was confirmed on another sample but the biopsy available for analysis contained only scant tumor material. This sample was negative by RT-PCR and FISH detected fusion signals in only 15% of cells, below the cut-off set conservatively for a positive FISH in this study. Case L_2 was a small biopsy showing an undifferentiated small round cell tumor without chondroid formation with mesenchymal chondrosarcoma as a possible but not definite diagnosis. In summary, it is notable that, including the index case, the HEY1-NCOA2 fusion was present in all 10 cases with a definitive diagnosis of mesenchymal chondrosarcoma and adequate material for analysis. The morphology of four HEY1-NCOA2 positive mesenchymal chondrosarcoma cases is shown in Figure 6, showing the typical histological features of this chondrosarcoma subtype.
Figure 6.
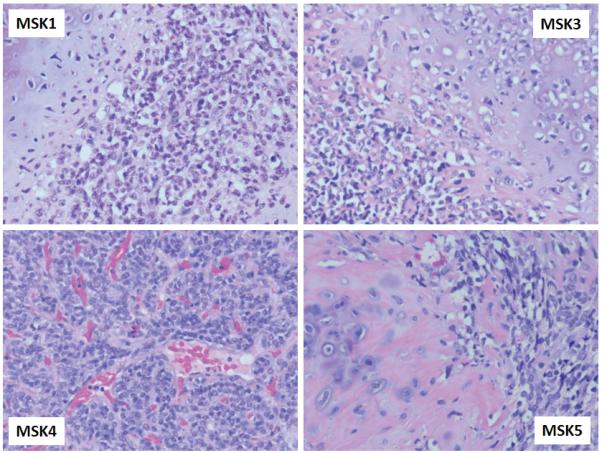
Morphology of four HEY1-NCOA2 positive mesenchymal chondrosarcoma cases showing richly cellular fields of small round or slightly spindled cells and islands of chondroid matrix.
In addition, 15 frozen tumor samples with the histologic diagnosis of other types of chondrosarcoma, i n c l u d i n g 9 conventional chondrosarcomas, 4 dedifferentiated chondrosarcomas and 2 spindle chondrosarcomas, were tested for the presence of this HEY1-NCOA2 fusion. None of the 15 samples was positive (data not show).
Identification of a NUP107-LGR5 Fusion in a Dedifferentiated Liposarcoma
Like NCOA2, LGR5 was another 3′ fusion candidate identified by our exon array data analysis pipeline and was prioritized for further validation. The exon expression plot of LGR5 in dedifferentiated liposarcoma case UF2 is shown in Figure 7A. The change point was mapped between exon 11 and exon 12 of LGR5 and 5′ RACE was performed using primers listed in Table 2. Sequence analysis of the LGR5 5′RACE products revealed a fusion transcript consisting of NUP107 exon 1 fused in frame to LGR5 exon 12 (Fig. 7B). Subsequent RT-PCR using NUP107 forward and LGR5 reverse primers (NUP107-E1-F, LGR5-E13-RV; see Table 2 for primer sequences) confirmed the presence of the NUP107-LGR5 fusion transcript in case UF2 (Fig. 7C). However, an RT-PCR screen of another 17 RNA samples of dedifferentiated liposarcomas for the NUP107-LGR5 fusion was completely negative (data not show). Notably, NUP107 is approximately 100 kb centromeric to MDM2 and therefore lies in a common boundary for 12q amplicons in dedifferentiated liposarcomas. Its involvement in a fusion with LGR5, located 2.8 Mb telomeric to NUP107 on 12q, may represent a bystander event in the rearrangements associated with 12q amplicon formation in this case of dedifferentiated liposarcoma.
Figure 7.
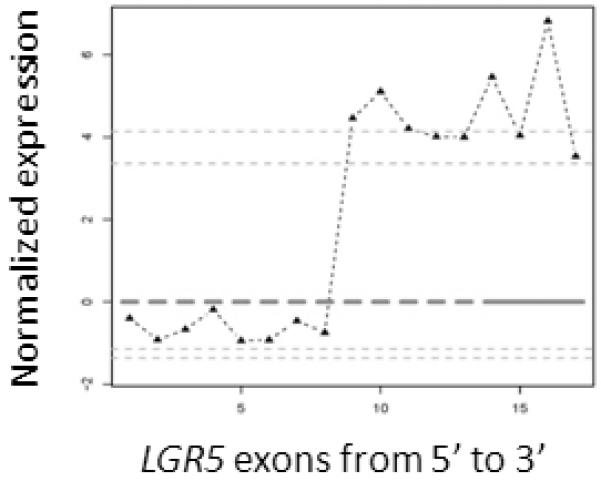
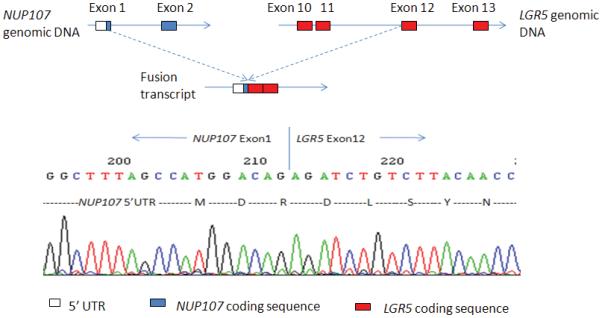
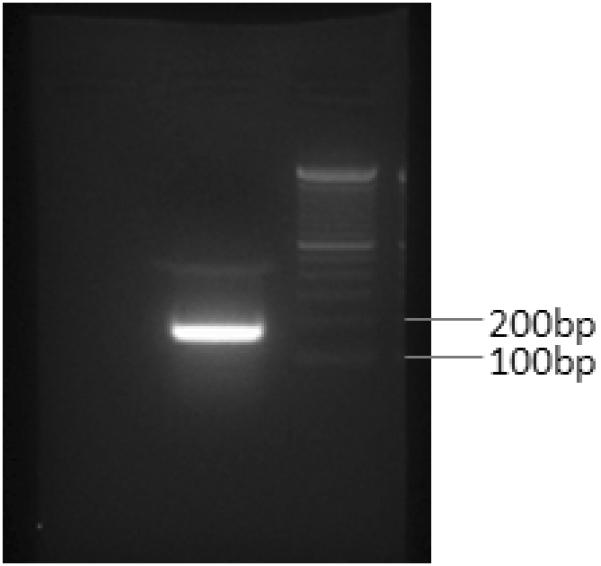
Identification of the novel NUP107-LGR5 fusion in a dedifferentiated liposarcoma case (UF2). A, Exon expression plot of LGR5 in sample UF2, showing the intragenic change in LGR5 expression. The change point was mapped between exon 11 and exon 12. This exon expression pattern was not seen in any other tumor samples or in normal control tissues. B, Upper: The schema of NUP107 and LGR5 partial gene structures as well as the formation of NUP107-LGR5 fusion transcript; Lower: Partial sequence of the NUP107-LGR5 fusion transcript along with predicted amino acid sequence. The transcript is an in-frame fusion of NUP107 exon 1 to LGR5 exon 12. C, RT-PCR detection of NUP107-LGR5 fusion. The presence of NUP107-LGR5 fusion transcript was verified by RT-PCR using NUP107 forward and LGR5 reverse primers (NUP107-E1-F, LGR5-E13-RV). Sequencing of the RT-PCR product confirmed the NUP107-LGR5 in-frame fusion transcript. Size marker is 100bp DNA ladder (Invitrogen, Carlsbad, CA).
DISCUSSION
We have reported here the identification of a novel, recurrent HEY1-NCOA2 gene fusion in mesenchymal chondrosarcoma based on a genome-wide screen of exon-level expression data from Affymetrix Exon Arrays. In addition, we also identified a novel but non-recurrent NUP107-LGR5 fusion in a dedifferentiated liposarcoma case with the same approach. These results demonstrate that our approach using exon-level expression data accompanied by a custom bioinformatics data analysis algorithm is able to identify fusion transcripts without prior knowledge of the genetics of a given case. Our approach builds on previous studies that had shown that Affymetrix Exon Arrays can be used to detect known gene fusions. Specifically, Jhavar et al. (2008) have reported the detection of the TMPRS22-ERG fusion in prostate cancer and Lin et al. (2009) demonstrated the detection of the EML4-ALK fusion in lung cancers by exon expression profiling using Affymetrix Human Exon 1.0 ST Arrays. Our study further confirms the utility of Exon Array data in genome-wide screens for fusion genes. In addition, the custom bioinformatics data analysis algorithm developed in this study is also applicable to exon-level expression data obtained by short read next generation sequencing of whole transcriptomes.
The novel HEY1-NCOA2 fusion reported here is the first recurrent gene fusion identified in mesenchymal chondrosarcoma. Mesenchymal chondrosarcoma was originally described by Lichtenstein and Bernstein (1959). This is a small round cell sarcoma with focal cartilaginous differentiation, often with a pericytomatous vascular pattern (Saito and Unni, 2005). Morphologically, mesenchymal chondrosarcoma has two characteristic components, a population of malignant round or slightly spindled cells and islands of chondroid matrix. The non-cartilaginous components are often predominant, and such lesions can be confused with other small cell neoplasms. Cytogenetic studies of mesenchymal chondrosarcoma are limited and only a few cases have been described with identifiable changes (Guccion et al., 1973; Chidambaram and Sanville, 2000; Aziz et al., 2002; Muller et al., 2005). Given that HEY1 and NCOA2 are only about 10 Mb apart, respectively mapping to 8q21.1 and 8q13.3, and both are on the reverse strand, this fusion could arise most simply from a small interstitial deletion, del(8)(q13.3q21.1), which would be cryptic in most conventional banding preparations. Clinically, mesenchymal chondrosarcoma is most often diagnosed between the ages of 10 and 20 and is noted for late distant recurrences and frequently poor outcomes.
The consistent detection of the HEY1-NCOA2 fusion in mesenchymal chondrosarcomas and the absence of this fusion in other types of chondrosarcoma identifies it as a characteristic molecular marker for this sarcoma, which should aid in the diagnosis of mesenchymal chondrosarcomas and help us better delineate this entity morphologically and clinically. It may also help us understand its pathogenesis. NCOA2 is a member of the p160 nuclear hormone receptor transcriptional co-activator family (Xu and Li, 2003). Figure 9 shows a schematic diagram of the NCOA2 protein. NCOA2 interacts with ligand-bound nuclear receptors through its nuclear receptor interaction domain (NID), and its C-terminal transcriptional activation domains, AD1/CID and AD2, respectively recruit histone acetyltransferases (CBP/p300) and histone methyltransferases to specific enhancer/promoter regions, thereby facilitating chromatin remodeling and transcription of nuclear receptor target genes. Its N-terminal contains a bHLH/PAS domain that is involved in DNA-binding and dimerization with proteins containing the same motif (Voegel et al., 1998).
HEY1-NCOA2 is the fourth NCOA2 fusion identified in human cancers. MYST3-NCOA2 was the first NCOA2 fusion identified, being found in a rare subset of AML (acute myeloid leukemia) patients with the chromosome rearrangement inv(8)(p11q13) (Carapeti et al., 1998). ETV6-NCOA2 has been reported in a few acute leukemia cases with t(8;12)(q13;p13), and PAX3-NCOA2, resulting from a t(2;8)(q35;q13), was discovered as a rare variant fusion in alveolar rhabdomyosarcoma (Strehl et al., 2008; Sumegi et al., 2010). A comparison of the domain structures of all four NCOA2 fusion proteins shows that the NCOA2 breakpoints are clustered in a small region between the NID and AD1 domains (Fig. 3). Therefore, in terms of NCOA2 fusions, only the C-terminal AD1/CID and AD2 domains are consistently preserved in the fusion proteins. The transforming activities of the MYST3-NCOA2 and PAX3-NCOA2 fusions have been demonstrated experimentally (Deguchi et al., 2003; Sumegi et al., 2010). Both studies found that an intact NCOA2 AD1/CID domain was required for transformation by NCOA2 fusion proteins. The involvement of the same functional domains of NCOA2 in various cancer gene fusions support a model in which the C-terminal transcriptional activation domains (AD1/CID and AD2) of NCOA2 are aberrantly targeted by the DNA-binding domain contributed by the N-terminal fusion partner .
HEY1, the 5′ partner of the HEY1-NCOA2 fusion, is a downstream effector of Notch signaling (Iso et al., 2003). Notch signaling activates the expression of HEY1 gene. Recent studies in mouse models have demonstrated that the Hey1 gene may also be a direct target of the BMP9-induced Smad signaling pathway (Sharff et al., 2009). Hey1 interacts with Runx2 and plays an important role in regulating BMP9-induced osteoblast lineage differentiation of mesenchymal stem cells in mice. HEY1 proteins bind to specific DNA sequences in the promoter regions of target genes as a dimer, recruiting co-repressors to repress the target genes of Notch signaling.
The HEY1-NCOA2 fusion replaces the C-terminal portion of HEY1 by the NCOA2 AD1/CID and AD2 domains, while retaining the HEY1 bHLH DNA-binding /dimerization domain. Therefore, we hypothesize that the HEY1-NCOA2 fusion protein, instead of recruiting co-repressors, may recruit co-activators through its NCOA2 part to some Notch/HEY1 target genes. Future studies will determine whether the pathogenesis of mesenchymal chondrosarcoma is due in part to aberrant or ectopic activation of Notch target genes by the HEY1-NCOA2 fusion protein.
In conclusion, the novel HEY1-NCOA2 fusion is the first recurrent gene fusion identified in mesenchymal chondrosarcomas. The consistent detection of the HEY1-NCOA2 fusion in this primitive sarcoma identifies it as a marker of potential clinical utility to add to the list of fusion-gene based molecular diagnostic markers in sarcomas. The HEY1-NCOA2 fusion will need to be evaluated in a larger cohort of tumors to establish more precisely the specificity and sensitivity of this fusion for the diagnosis of mesenchymal chondrosarcomas and the spectrum of possible fusion variants. Furthermore, given the recent discovery of IDH1 or IDH2 point mutations in approximately 50% of conventional central and periosteal chondromas and chondrosarcomas (Amary et al., 2011), it will be interesting to now assess whether such mutations co-exist with the HEY1-NCOA2 fusion in mesenchymal chondrosarcomas. Finally, functional studies of the HEY1-NCOA2 fusion protein may help us understand the pathogenesis of this often lethal malignancy, and develop new therapeutic approaches.
Supplementary Material
ACKNOWLEDGMENTS
We would like to thank Kristina Wang for technical assistance with FFPE FISH procedures Agnes Viale and the personnel of the Genomics Core Facility (MSKCC) for microarray hybridizations, and Alex Lash in the MSKCC Bioinformatics Core Facility for providing a listing of genes involved in cancer gene fusions and related similar genes. We would also like to thank Elisabeth J. Rushing and Julie Fanburg-Smith for their willingness to contribute case materials. This project was initiated under the Affymetrix Cancer Collaborations program. The Exon expression microarray data for the 87 samples in this study are available at http://cbio.mskcc.org/Public/sarcoma_array_data/.
Supported by: L.W. was supported in part by NIH P01 CA106450 (to M.L.) and T.M. was supported in part by NIH P01 CA47179 (to M.L.)
REFERENCES
- Amary MF, Bacsi K, Maggiani F, Damato S, Halai D, Berisha F, Pollock R, O’Donnell P, Grigoriadis A, Diss T, Eskandarpour M, Presneau N, Hogendoorn PCW, Futreal A, Tirabosco R, Flanagan AM. IDH1 and IDH2 mutations are frequent events in central chondrosarcoma and central and periosteal chondromas but not in other mesenchymal tumours. J Pathol. 2011;224:334–343. doi: 10.1002/path.2913. [DOI] [PubMed] [Google Scholar]
- Aziz SR, Miremadi AR, McCabe JC. Mesenchymal chondrosarcoma of the maxilla with diffuse metastasis: case report and literature review. J Oral Maxillofac Surg. 2002;60:931–935. doi: 10.1053/joms.2002.33865. [DOI] [PubMed] [Google Scholar]
- Carapeti M, Aguiar RC, Goldman JM, Cross NC. A novel fusion between MOZ and the nuclear receptor coactivator TIF2 in acute myeloid leukemia. Blood. 1998;91:3127–3133. [PubMed] [Google Scholar]
- Chidambaram A, Sanville P. Mesenchymal chondrosarcoma of the maxilla. J Laryngol Otol. 2000;114:536–539. doi: 10.1258/0022215001906084. [DOI] [PubMed] [Google Scholar]
- Deguchi K, Ayton PM, Carapeti M, Kutok JL, Snyder CS, Williams IR, Cross NC, Glass CK, Cleary ML, Gilliland DG. MOZ-TIF2-induced acute myeloid leukemia requires the MOZ nucleosome binding motif and TIF2-mediated recruitment of CBP. Cancer Cell. 2003;3:259–271. doi: 10.1016/s1535-6108(03)00051-5. [DOI] [PubMed] [Google Scholar]
- Guccion JG, Font RL, Enzinger FM, Zimmerman LE. Extraskeletal mesenchymal chondrosarcoma. Arch Pathol. 1973;95:336–340. [PubMed] [Google Scholar]
- Iso T, Kedes L, Hamamori Y. HES and HERP families: multiple effectors of the Notch signaling pathway. J Cell Physiol. 2003;194:237–255. doi: 10.1002/jcp.10208. [DOI] [PubMed] [Google Scholar]
- Jhavar S, Reid A, Clark J, Kote-Jarai Z, Christmas T, Thompson A, Woodhouse C, Ogden C, Fisher C, Corbishley C, De-Bono J, Eeles R, Brewer D, Cooper C. Detection of TMPRSS2-ERG translocations in human prostate cancer by expression profiling using GeneChip Human Exon 1.0 ST arrays. J Mol Diagn. 2008;10:50–57. doi: 10.2353/jmoldx.2008.070085. [DOI] [PMC free article] [PubMed] [Google Scholar]
- Lichtenstein L, Bernstein D. Unusual benign and malignant chondroid tumors of bone. A survey of some mesenchymal cartilage tumors and malignant chondroblastic tumors, including a few multicentric ones, as well as many atypical benign chondroblastomas and chondromyxiod fibromas. Cancer. 1959;12:1142–1157. doi: 10.1002/1097-0142(195911/12)12:6<1142::aid-cncr2820120610>3.0.co;2-d. [DOI] [PubMed] [Google Scholar]
- Lin E, Li L, Guan Y, Soriano R, Rivers CS, Mohan S, Pandita A, Tang J, Modrusan Z. Exon array profiling detects EML4-ALK fusion in breast, colorectal, and non-small cell lung cancers. Mol Cancer Res. 2009;7:1466–1476. doi: 10.1158/1541-7786.MCR-08-0522. [DOI] [PubMed] [Google Scholar]
- Mertens F, Antonescu CR, Hohenberger P, Ladanyi M, Modena P, D’Incalci M, Casali PG, Aglietta M, Alvegård T. Translocation-related sarcomas. Semin Oncol. 2009;36:312–323. doi: 10.1053/j.seminoncol.2009.06.004. [DOI] [PubMed] [Google Scholar]
- Mitelman F, Johansson B, Mertens F. The impact of translocations and gene fusions on cancer causation. Nat Rev Cancer. 2007;7:233–245. doi: 10.1038/nrc2091. [DOI] [PubMed] [Google Scholar]
- Muller S, Soder S, Oliveira AM, Inwards CY, Aigner T. Type II collagen as specific marker for mesenchymal chondrosarcomas compared to other small cell sarcomas of the skeleton. Mod Pathol. 2005;18:1088–1094. doi: 10.1038/modpathol.3800391. [DOI] [PubMed] [Google Scholar]
- Olshen AB, Venkatraman ES, Lucito R, Wigler M. Circular binary segmentation for the analysis of array-based DNA copy number data. Biostatistics. 2004;5:557–572. doi: 10.1093/biostatistics/kxh008. [DOI] [PubMed] [Google Scholar]
- Ozawa T, Brennan CW, Wang L, Squatrito M, Sasayama T, Nakada M, Huse JT, Pedraza A, Utsuki S, Yasui Y, Tandon A, Fomchenko EI, Oka H, Levine RL, Fujii K, Ladanyi M, Holland EC. PDGFRA gene rearrangements are frequent genetic events in PDGFRA-amplified glioblastomas. Genes Dev. 2010;24:2205–2218. doi: 10.1101/gad.1972310. [DOI] [PMC free article] [PubMed] [Google Scholar]
- Saito K, Unni KK. Malignant tumours of bone and cartilage. In: Barnes L, Eveson JW, Reichart P, Sidransky D, editors. Pathology and genetics of head and neck tumours. World Health Organization classification of tumours. IARC Press; Lyon: 2005. pp. 51–52. [Google Scholar]
- Sharff KA, Song WX, Luo X, Tang N, Luo J, Chen J, Bi Y, He BC, Huang J, Li X, Jiang W, Zhu GH, Su Y, He Y, Shen J, Wang Y, Chen L, Zuo GW, Liu B, Pan X, Reid RR, Luu HH, Haydon RC, He TC. Hey1 basic helix-loop-helix protein plays an important role in mediating BMP9-induced osteogenic differentiation of mesenchymal progenitor cells. J Biol Chem. 2009;284:649–659. doi: 10.1074/jbc.M806389200. [DOI] [PMC free article] [PubMed] [Google Scholar]
- Soda M, Choi YL, Enomoto M, Takada S, Yamashita Y, Ishikawa S, Fujiwara S, Watanabe H, Kurashina K, Hatanaka H, Bando M, Ohno S, Ishikawa Y, Aburatani H, Niki T, Sohara Y, Sugiyama Y, Mano H. Identification of the transforming EML4-ALK fusion gene in non-small-cell lung cancer. Nature. 2007;448:561–566. doi: 10.1038/nature05945. [DOI] [PubMed] [Google Scholar]
- Strehl S, Nebral K, König M, Harbott J, Strobl H, Ratei R, Struski S, Bielorai B, Lessard M, Zimmermann M, Haas OA, Izraeli S. ETV6-NCOA2: a novel fusion gene in acute leukemia associated with coexpression of T-lymphoid and myeloid markers and frequent NOTCH1 mutations. Clin Cancer Res. 2008;14:977–983. doi: 10.1158/1078-0432.CCR-07-4022. [DOI] [PubMed] [Google Scholar]
- Sumegi J, Streblow R, Frayer RW, Dal Cin P, Rosenberg A, Meloni-Ehrig A, Bridge JA. Recurrent t(2;2) and t(2;8) translocations in rhabdomyosarcoma without the canonical PAX-FOXO1 fuse PAX3 to members of the nuclear receptor transcriptional coactivator family. Genes Chromosomes Cancer. 2010;49:224–236. doi: 10.1002/gcc.20731. [DOI] [PMC free article] [PubMed] [Google Scholar]
- Tomlins SA, Rhodes DR, Perner S, Dhanasekaran SM, Mehra R, Sun XW, Varambally S, Cao X, Tchinda J, Kuefer R, Lee C, Montie JE, Shah RB, Pienta KJ, Rubin MA, Chinnaiyan AM. Recurrent fusion of TMPRSS2 and ETS transcription factor genes in prostate cancer. Science. 2005;310:644–648. doi: 10.1126/science.1117679. [DOI] [PubMed] [Google Scholar]
- Voegel JJ, Heine MJ, Tini M, Vivat V, Chambon P, Gronemeyer H. The coactivator TIF2 contains three nuclear receptor-binding motifs and mediates transactivation through CBP binding-dependent and -independent pathways. EMBO J. 1998;17:507–519. doi: 10.1093/emboj/17.2.507. [DOI] [PMC free article] [PubMed] [Google Scholar]
- Wang L, Bhargava R, Zheng T, Wexler L, Collins MH, Roulston D, Ladanyi M. Undifferentiated small round cell sarcomas with rare EWS gene fusions: identification of a novel EWS-SP3 fusion and of additional cases with the EWS-ETV1 and EWS-FEV fusions. J Mol Diagn. 2007;9:498–509. doi: 10.2353/jmoldx.2007.070053. [DOI] [PMC free article] [PubMed] [Google Scholar]
- Xu J, Li Q. Review of the in vivo functions of the p160 steroid receptor coactivator family. Mol Endocrinol. 2003;17:1681–1692. doi: 10.1210/me.2003-0116. [DOI] [PubMed] [Google Scholar]
Associated Data
This section collects any data citations, data availability statements, or supplementary materials included in this article.