

Abstract
The serotonin (5-hydroxytryptamine, 5-HT) transporter (SERT) protein plays a central role in terminating 5-HT neurotransmission and is the most important therapeutic target for the treatment of major depression and anxiety disorders. We report an innovative, versatile, and target-selective quantum dot (QD) labeling approach for SERT in single Xenopus oocytes that can be adopted as a drug-screening platform. Our labeling approach employs a custom-made, QD-tagged indoleamine derivative ligand, IDT318, that is structurally similar to 5-HT and that accesses the primary binding site with enhanced human SERT selectivity. Incubating QD-labeled oocytes with paroxetine (Paxil®), a high affinity SERT-specific inhibitor, showed a concentration- and time-dependent decrease in QD fluorescence, demonstrating the utility of our approach for the identification of SERT modulators. Further, with the development of ligands aiming at other pharmacologically relevant targets, our approach may potentially form the basis for a multi-target drug discovery platform.
Major depression occurs in 2–5% of the U. S. population and is the most common mental illness in modern society.1 Depression is not only devastating, but is a financial burden, costing the U.S. an estimated 100 billion dollars annually.1b Selective serotonin reuptake inhibitors (SSRIs) that block the serotonin transporter (SERT) at brain synapses are, by far, the most frequently prescribed drugs for the management of depression.1a, 2 A well-known major drawback of current SSRIs is their slow onset of antidepressant activity, requiring 3–6 weeks of administration to produce a significant therapeutic benefit.3
To develop faster acting antidepressants, it was proposed that a multi-target strategy,3 where antagonists are designed for several pharmacologically relevant targets. Several studies indicate that dual-acting antidepressants such as Desvenlafaxine,4 a serotonin and norepinephrine reuptake inhibitor (SNRI), and SB-649915-B,5 a 5-HT1A/B receptor antagonist and SSRI, may provide a faster onset of antidepressant action. Another emerging area in antidepressant drug discovery exploits allosteric antagonists.6 In this approach, drug candidates can be engineered to act at a site of the transporter distinct from the high-affinity primary binding site, consequently mediating conformational changes of a substrate binding pocket and attenuating neurotransmitter uptake. No crystal structure of any neurotransmitter transporter is presently available, which makes it difficult to validate the allosteric antagonism. Several high-affinity SSRIs have been previously proposed as allosteric modulators for SERT, including paroxetine, (Paxil®), a high-affinity SERT-specific inhibitor and FDA-approved SSRI.7
Recently, several new multi-target antagonists and allosteric modulators have shown improved efficacy and success in clinical trials. However, progress in next-generation antidepressant drug discovery has been largely delayed by the lack of appropriate screening platforms.3 At present, methods used to investigate transporter binding/activity rely on conventional biochemical methods such as in vitro phosphorylation assay, electrophysiology,8 or radio-labeled substrate uptake assay.8 These methods are labor-intensive, time-consuming, and in the latter case, require isotope use.
Alternatively, fluorescent probes can be used for target-selective drug screening. However, when using common fluorophores, the two major limiting features are photostability and sensitivity. In recent years, QD development has achieved promising results that overcome the disadvantages associated with conventional biolabeling fluorophores.9 Previously, we have demonstrated the use of ligand-conjugated QDs for visualization of SERT, GABAC receptor, and most recently, the dopamine transporter.10 In this report, we advance the ligand-conjugated QD labeling approach as an antidepressant drug screening platform in single, living oocytes.
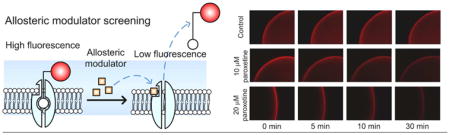
Figure 1 illustrates two modes by which ligand-conjugated QD displacement can occur. The first mode is by preventing the ligand re-association with the primary (orthosteric) binding site (left); and the second mode is through an allosteric mechanism that shifts the primary binding site conformation, dissociating the ligand (right).
Figure 1.

Fluorescence displacement assay based on ligand-conjugated QDs for antidepressant drug discovery. Target proteins (transporters or receptors) bind to the QD-tagged ligands, forming complexes that increase fluorescent signal along the membrane. When exposed to a potential drug which competes with the binding (left) or induces a conformational change in the binding site (right), the QD-tagged ligands are displaced resulting in a decrease in fluorescence intensity. The blue shadow area indicates the imaging focal plane while processing the assay.
The structure of the IDT318 ligand used in this study is depicted in Figure 2A. The synthesis details have been previously described.11 As indicated, IDT318 ligand is composed of four components. Ligand design was based on comprehensive screening of trypamine derivatives.12 5-methoxy-3-(1,2,5,6-tetrahydro-4-pyridinyl)-1H-indole (RU24969), which retains the tryptamine moiety for a putative common 5-HT binding site and features enhanced selectivity for human serotonin transporter (hSERT),12 is readily adapted as a tethered ligand for hSERT binding13 (component I). The alkyl spacer serves to enhance the ligand binding through the interaction of the hydrophobic residues in the transmembrane domains of membrane channels or transporters (component II, see also Figure S1). The polyethylene glycol (PEG) chain is used to increase water solubility of the ligand and decrease steric hindrance from the bulky QD (component III). The biotin group (component IV) allows for specific binding to the streptavidin-conjugated QD (SA-QD). In addition, only surface pegylated, streptavidin conjugated QDs were used for their ultra-low nonspecific binding property.14
Figure 2.

Target-selective QD-SERT labeling via IDT318. (A) The structure of IDT318 ligand used in the study (see text for details of each component) (B) Column 1: Incubation of hSERT oocyte with 1 μM IDT318 ligand prior to 2.5 nM SA-QD treatment. The observed QD fluorescence forms a sharp halo correlating to the membrane of hSERT expressing oocyte. Column 2: Control experiment where the buffer-injected oocyte was treated under the same conditions as in column 1. Column 3: hSERT expressing oocyte was incubated with paroxetine (1 μM), subsequently exposed to the ligand/paroxetine mixture (1 μM/1 μM) prior to 2.5 nM SA-QD treatment. Column 4: hSERT expressing oocyte was pre-incubated with 5-HT (1 mM), subsequently exposed to the ligand/5-HT mixture (1 μM/mM) prior to 2.5 nM SA-QD treatment. The halo was dimmer but not completely blocked, indicating a competitive binding mechanism. Upper panel: DIC image; Lower panel: fluorescent image. Scale bar = 0.5 mm. The results are representative micrographs from at least 3 independent experiments.
To visualize the hSERT distribution in our oocyte model, a two-step labeling approach was implemented in which a hSERT-expressing oocyte was incubated with IDT318 followed by incubation with SA-QDs. As shown in Figure 2B (Column 1), the QD fluorescence forms a sharp halo correlating to the membrane of the hSERT expressing oocyte, whereas incubation with non-expressing control oocyte shows no sign of labeling (Column 2). Ligand binding specificity was demonstrated using a QD-based pre-incubation affinity assay where the hSERT-expressing oocyte is pre-incubated with paroxetine prior to the two-step QD labeling. As can be seen in Column 3, paroxetine effectively blocked the QD labeling, demonstrating the binding specificity of IDT318 to hSERT. In comparison, preincubation of a hSERT-expressing oocyte with 0.1 mM 5-HT prior to the two-step QD labeling only shows reduced QD fluorescence intensity (Column 4). This reduced QD labeling could be the result of incomplete saturation of hSERT binding with 5-HT; however, this is unlikely since the 5-HT concentration was 120 times greater than the reported Ki value against hSERT.12 A more likely explanation is the reversible binding mode, in which IDT318 competes with 5-HT for the primary binding site. This rationale is also consistent with our previous finding indicating that tryptamine analogs including RU24969 shares, a common substrate binding site at hSERT.12 Importantly, the influence of IDT318 on hSERT activity was further characterized with an oocyte electrophysiological assay (Figure S1), indicating the role of IDT318 as a hSERT antagonist.
The potential utility of our labeling model for SSRI screening was explored utilizing paroxetine. In order for the drug candidate to rapidly displace the fluorophore-tagged ligand at a reasonable drug concentration, a ligand with an affinity in the μM range is required.15 As indicated in Figure S2, the IDT318 shows the desired μM affinity. In our displacement assay, a 30 minute time-course imaging at 1 minute intervals was carried out immediately after paroxetine incubation (see Supplement for details). QD fluorescence intensity was measured and normalized to Ft/F0, where F0 is the initial fluorescent signal and the Ft is the fluorescent signal at time t. Representative time-lapse fluorescent images and fluorescence intensity traces are shown in Figure 3A and 3B, respectively. Time- and concentration-dependent fluorescence intensity reduction is apparent in the presence of paroxetine. In contrast, when using 5-HT as the displacing drug, the dramatic QD fluorescent reduction as seen with paroxetine treatment vanished (Figure S4). Note that there was less than a 10 % reduction in fluorescence intensity observed after 30 minutes of buffer incubation (Figure 3B), indicating that the effect of QD quenching and spontaneous ligand dissociation minimally contributes to the results. Furthermore, the log plot of Ft/F0 as a function of time is linear in the first 10 minutes, indicating first-order dissociation kinetics (Figure 3C). Analysis of the 10 μM paroxetine displacement trace yields an apparent dissociation rate constant of kapp = (5.0 ± 0.4) ×10−4 s−1. Doubling the paroxetine concentration results in a nearly proportional increase in kapp = (1.08 ± 0.05) ×10−3 s−1 (see Supplement for fitting details). Hence, this displacement platform exhibits necessary sensitivity for SSRI screening. Importantly, the dissociation kinetics shown in Figure 3C indicate that the time-series displacement can be performed in less than 10 minutes. From a technological perspective, the throughput of our QD-based displacement assays can be increased more than 100 fold if used with a commercially available automated multiwell plate high throughput screening imaging system.
Figure 3.
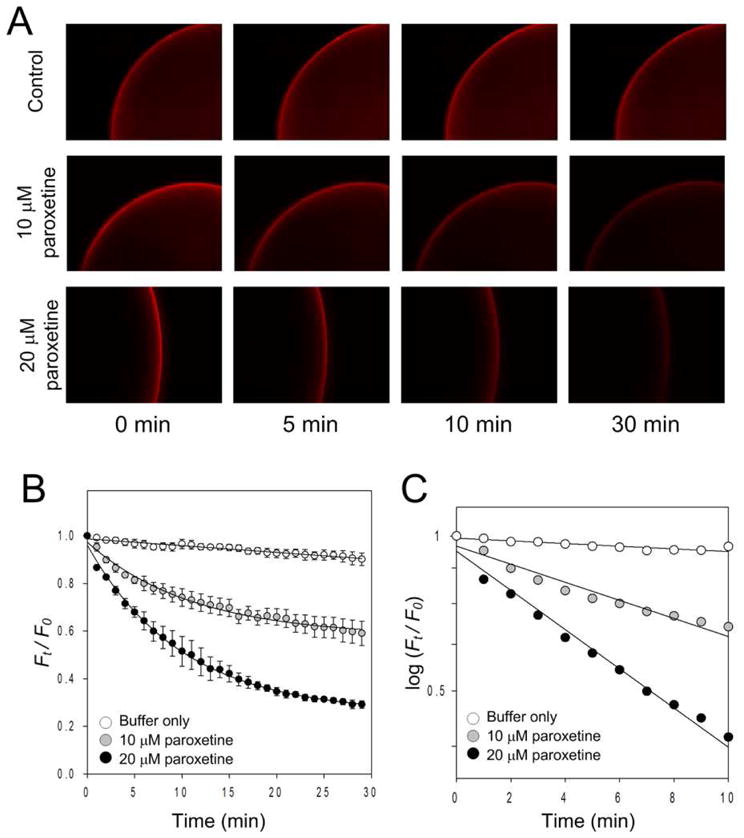
Displacement analysis of the QD-ligand labeled hSERT with paroxetine. Representative time-lapse Qdot fluorescent images (A), time-dependent relative fluorescent intensity plot (B), and kinetic analysis (C) show the effect of paroxetine on ligand-SERT displacement in the presence of PBS buffer (control), 10 μM, and 20 μM paroxetine. Solid lines in (B) reflect best fits (see suppl for detail). A log scale plot of the displacement curves is fit to a linear function (C), indicating first-order dissociation kinetics. Each data point in (B) and (C) represents the mean of three independent measurements. Data points in (B) are given as mean ± standard deviation. Results in A are representative micrographs from at least 3 independent experiments.
The ability of paroxetine to displace IDT318 at SERT is most likely to be a non-competitive, allosteric mode of interaction of the antidepressant with the transporter, as opposed to a simple competition for an orthosteric binding site.7, 16 Recently, it was shown that mutations at the major antidepressant binding site of SERT do not impact paroxetine, also suggesting a non-competitive mode of interaction.13 Additionally, non-competitive dissociation of ligands from binding sites is expected to follow first-order dissociation kinetics, as in the case of S-citalopram,17 an SSRI frequently proposed to interact with SERT via an allosteric mechanism.
In conclusion, we have demostrated a fluorescence displacement assay for antidepressant drug discovery based on ligand conjugated QDs. Furthermore, our method is the first target-selective drug discovery platform that utilizes fluorescent QDs. This system may aid in mapping allosteric mechanisms of SERT modulation and potentially form the basis for a multi-target drug discovery platform employing ligand-conjugated QDs that selectively bind to other pharmacologically relevant proteins, such as dopamine transporter10c and norepinephrine transporter. Ultimately, this platform may provide more insight into the effects of different structural features on the binding kinetics of any ligand-protein interaction and therefore serve as a generalized approach for the development of drugs beyond antidepressants.
Supplementary Material
Acknowledgments
This work was supported by grants from the National Institutes of Health (RO1EB003728-02 and GM72048-02). The authors thank Zachary Glaser, Steven Combs, and Dr. Jens Meiler for helpful discussion with ligand binding mechanisms.
Footnotes
Supporting Information Available: Experimental section and supplemental figures are available free of charge via the Internet at http://pubs.acs.org.
References
- 1.(a) Nestler EJ, Barrot M, DiLeone RJ, Eisch AJ, Gold SJ, Monteggia LM. Neuron. 2002;34:13–25. doi: 10.1016/s0896-6273(02)00653-0. [DOI] [PubMed] [Google Scholar]; (b) Duric V, Banasr M, Licznerski P, Schmidt HD, Stockmeier CA, Simen AA, Newton SS, Duman RS. Nat Med. 2010;16:1328–1332. doi: 10.1038/nm.2219. [DOI] [PMC free article] [PubMed] [Google Scholar]
- 2.(a) Henry LK, DeFelice LJ, Blakely RD. Neuron. 2006;49:791–796. doi: 10.1016/j.neuron.2006.03.002. [DOI] [PubMed] [Google Scholar]; (b) Ramamoorthy S, Blakely RD. Science. 1999;285:763–766. doi: 10.1126/science.285.5428.763. [DOI] [PubMed] [Google Scholar]; (c) Carneiro AM, Airey DC, Thompson B, Zhu CB, Lu L, Chesler EJ, Erikson KM, Blakely RD. Proc Natl Acad Sci USA. 2009;106:2047–2052. doi: 10.1073/pnas.0809449106. [DOI] [PMC free article] [PubMed] [Google Scholar]; (d) Kroenke K, West SL, Swindle R, Gilsenan A, Eckert GJ, Dolor R, Stang P, Zhou XH, Hays R, Weinberger M. JAMA-J Am Med Assoc. 2001;286:2947–2955. doi: 10.1001/jama.286.23.2947. [DOI] [PubMed] [Google Scholar]
- 3.Milian MJ. Pharmacol Ther. 2006;110:135–370. doi: 10.1016/j.pharmthera.2005.11.006. [DOI] [PubMed] [Google Scholar]
- 4.Dolder C, Nelson M, Stump A. Drugs Aging. 2010;27:625–640. doi: 10.2165/11537140-000000000-00000. [DOI] [PubMed] [Google Scholar]
- 5.Starr KR, Price GW, Watson JM, Atkinson PJ, Arban R, Melotto S, Dawson LA, Hagan JJ, Upton N, Duxon MS. Neuropsychopharmacology. 2007;32:2163–2172. doi: 10.1038/sj.npp.1301341. [DOI] [PubMed] [Google Scholar]
- 6.Sanchez C. Drug Discov Today: Ther Strategies. 2006;3:483–488. [Google Scholar]
- 7.Akunne HC, de Costa BR, Jacobson AE, Rice KC, Rothman RB. Neurochem Res. 1992;17:1275–1283. doi: 10.1007/BF00968412. [DOI] [PubMed] [Google Scholar]
- 8.Ramsey IS, DeFelice LJ. J Biol Chem. 2002;277:14475–14482. doi: 10.1074/jbc.M110783200. [DOI] [PubMed] [Google Scholar]
- 9.(a) Medintz IL, Uyeda HT, Goldman ER, Mattoussi H. Nat Mater. 2005;4:435–446. doi: 10.1038/nmat1390. [DOI] [PubMed] [Google Scholar]; (b) Gao X, Yang L, Petros JA, Marshall FF, Simons JW, Nie S. Curr Opin Biotechnol. 2005;16:63–72. doi: 10.1016/j.copbio.2004.11.003. [DOI] [PubMed] [Google Scholar]; (c) Alivisatos P. Nat Biotechnol. 2004;22:47–52. doi: 10.1038/nbt927. [DOI] [PubMed] [Google Scholar]; (d) Rosenthal SJ, Chang JC, Kovtun O, McBride JR, Tomlinson ID. Chem Biol. 2011;18:10–24. doi: 10.1016/j.chembiol.2010.11.013. [DOI] [PMC free article] [PubMed] [Google Scholar]
- 10.(a) Rosenthal SJ, Tomlinson I, Adkins EM, Schroeter S, Adams S, Swafford L, McBride J, Wang Y, DeFelice LJ, Blakely RD. J Am Chem Soc. 2002;124:4586–4594. doi: 10.1021/ja003486s. [DOI] [PubMed] [Google Scholar]; (b) Gussin HA, Tomlinson ID, Little DM, Warnement MR, Qian HH, Rosenthal SJ, Pepperberg DR. J Am Chem Soc. 2006;128:15701–15713. doi: 10.1021/ja064324k. [DOI] [PMC free article] [PubMed] [Google Scholar]; (c) Kovtun O, Tomlinson ID, Sakrikar DS, Chang JC, Blakely RD, Rosenthal SJ. ACS Chem Neurosci. 2011;2:370–378. doi: 10.1021/cn200032r. [DOI] [PMC free article] [PubMed] [Google Scholar]
- 11.(a) Warnement MR, Tomlinson ID, Chang JC, Schreuder MA, Luckabaugh CM, Rosenthal SJ. Bioconjug Chem. 2008;19:1404–1413. doi: 10.1021/bc800104n. [DOI] [PubMed] [Google Scholar]; (b) Tomlinson ID, Iwamoto H, Blakely RD, Rosenthal SJ. Bioorg Med Chem Lett. 2011;21:1678–1682. doi: 10.1016/j.bmcl.2011.01.102. [DOI] [PMC free article] [PubMed] [Google Scholar]
- 12.Adkins EM, Barker EL, Blakely RD. Mol Pharmacol. 2001;59:514–523. doi: 10.1124/mol.59.3.514. [DOI] [PubMed] [Google Scholar]
- 13.Thompson BJ, Jessen T, Henry LK, Field JR, Gamble KL, Gresch PJ, Carneiro AM, Horton RE, Chisnell PJ, Belova Y, McMahon DG, Daws LC, Blakely RD. Proc Natl Acad Sci USA. 2011;108:3785–3790. doi: 10.1073/pnas.1011920108. [DOI] [PMC free article] [PubMed] [Google Scholar]
- 14.(a) Bentzen EL, Tomlinson ID, Mason J, Gresch P, Warnement MR, Wright D, Sanders-Bush E, Blakely R, Rosenthal SJ. Bioconjug Chem. 2005;16:1488–1494. doi: 10.1021/bc0502006. [DOI] [PubMed] [Google Scholar]; (b) Chattopadhyay PK, Price DA, Harper TF, Betts MR, Yu J, Gostick E, Perfetto SP, Goepfert P, Koup RA, De Rosa SC, Bruchez MP, Roederer M. Nat Med. 2006;12:972–977. doi: 10.1038/nm1371. [DOI] [PubMed] [Google Scholar]
- 15.Zhang S, Chen L, Kumar S, Wu L, Lawrence DS, Zhang ZY. Methods. 2007;42:261–267. doi: 10.1016/j.ymeth.2007.02.008. [DOI] [PMC free article] [PubMed] [Google Scholar]
- 16.Henry LK, Meiler J, Blakely RD. Mol Interv. 2007;7:306–309. doi: 10.1124/mi.7.6.4. [DOI] [PubMed] [Google Scholar]
- 17.(a) Sánchez C, Bøgesø KP, Ebert B, Reines EH, Braestrup C. Psychopharmacology. 2004;174:163–176. doi: 10.1007/s00213-004-1865-z. [DOI] [PubMed] [Google Scholar]; (b) Chen F, Larsen MB, Neubauer HA, Sanchez C, Plenge P, Wiborg O. J Neurochem. 2005;92:21–28. doi: 10.1111/j.1471-4159.2004.02835.x. [DOI] [PubMed] [Google Scholar]
Associated Data
This section collects any data citations, data availability statements, or supplementary materials included in this article.