Abstract
A digital EPR spectrometer was constructed by replacing the traditional bridge with an arbitrary waveform generator (AWG) to produce excitation patterns and a high-speed digitizer for direct detection of the spin system response at the carrier frequency. Digital down-conversion produced baseband signals in quadrature with very precise orthogonality. Real-time resonator tuning was performed by monitoring the Fourier transforms of signals reflected from the resonator during frequency sweeps generated by the AWG. The capabilities of the system were demonstrated by rapid magnetic field scans at 256 MHz carrier frequency, and FID and spin echo experiments at 1 and 10 GHz carrier frequencies. For the rapid scan experiments the leakage through a cross-loop resonator was compensated by adjusting the amplitude and phase of a sinusoid at the carrier frequency that was generated with another AWG channel.
1. Introduction
Exponential growth in processing power and memory capacity of modern digital electronics facilitates transition from the homodyne detection that is commonly used in EPR spectrometers to digital detection either at an intermediate frequency, IF [1–6], or directly at the carrier frequency [7–10]. Digital detection has several advantages. (i) Absorption and dispersion components of the EPR signal can be numerically produced with very precise orthogonality, which is difficult to achieve in hardware [11]. (ii) If the orthogonality of the two channels is precise, combining the two quadrature components improves the rapid-scan signal to noise ratio, SNR, by a factor of √2 [11] relative to a single component. (iii) For sinusoidal deconvolution of rapid scan signals both channels are used and orthogonality is required, (iv) For pulse EPR, precise orthogonality of the two quadrature channels reduces the number of required phase cycles and increases the SNR [2]. (v) Direct detection enables numerical evaluation of multiple harmonics of the continuous wave (CW) modulation frequency [4,6,10,12] which is important for saturation transfer EPR spectroscopy [13,14], and allows reconstruction of the true EPR lineshape from over-modulated EPR signals with improved SNR [10,12,15–18].
Direct detection at 2.5 GHz has been demonstrated for the free induction decay (FID), echo-detected field-swept EPR, and electron spin echo envelope modulation [9]. Digital detection at the carrier frequency produces a large amount of data to be transferred and processed. The amount of data can be reduced by using an IF and/or by sub-sampling at frequency fs below the Nyquist rate [4,6]. At 300 MHz an IF of 50 MHz was used for FID spectroscopy and imaging [1–3]. An IF and sub-sampling have been used for CW, saturation recovery, ELDOR, and FID detection at X-band [4–6]. Direct detection with sub-sampling was used for FID imaging at 300 MHz [7,8] and for CW with multiple harmonics at L-band [19].
The disadvantage of an IF is the increased complexity of the spectrometer design: an additional frequency generator time-locked to the master source is needed to produce the IF, an additional mixer is needed for down-conversion, and an image-rejection filter is required. If sub-sampling to very low frequencies is used, a bandpass filter with demanding characteristics (narrow bandwidth, sharp roll-off, and low insertion loss) is needed to reject noise outside the narrow signal bandwidth. These additional components introduce additional noise and increase the cost of the spectrometer [6,7,9,10].
This paper describes a versatile direct-detection digital EPR spectrometer (Fig.1) that can operate at a wide range of frequencies. The traditional bridge is replaced by an arbitrary waveform generator (AWG), high-speed digitizer, and computer. The AWG can produce excitation patterns for CW, pulse, and rapid scan EPR. The signal is detected at the carrier frequency, and quadrature down-conversion is done in software. For pulse and rapid scan EPR [20,21], where coherent averaging within a relatively short time window is used, the data sets are relatively small and manageable with currently available digital technologies. Rapid scan experiments are demonstrated at 256 MHz carrier frequency, and FID and spin echo experiments are demonstrated at 1 and 10 GHz carrier frequencies. Resonator tuning, suppression of leakage at the carrier frequency, and reduction of the data size for faster transfer and processing of spin echo experiments are discussed.
Fig. 1.
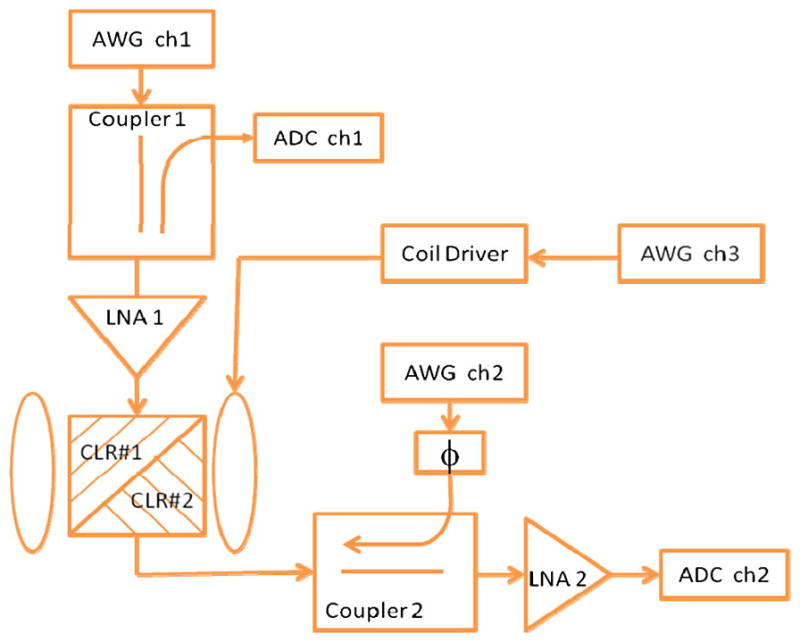
Block diagram of digital spectrometer. AWG ch1 generates the excitation pattern that goes to CLR#1 through optional low noise amplifier (LNA1). The signal from CLR#2 goes through LNA2 to ADC ch2. In tune mode, frequency sweeps for tuning CLR #1 and CLR#2 are generated by AWG ch1 and ch2. Reflected signals for tuning go through couplers 1 and 2 to ADC ch1 and ch2. Background compensation from AWG ch2 can be input through coupler 2. Magnetic field modulation can be generated with AWG ch3 via the coil driver.
2. Spectrometer design
The block diagram of the digital spectrometer is shown in Fig 1. A bimodal cross loop resonator (CLR) separates excitation from detection, which facilitates direct detection. The two modes of the CLR are designated as CLR#1 and CLR#2. AWG ch1 generates the excitation pattern that goes to CLR#1 through an optional low noise power amplifier (LNA1). The signal from CLR#2 goes through LNA2 to ADC ch2. The AWG and digitizer must be time-locked. If the signal is amplified and digitized directly after the resonator with a sampling rate greater than the Nyquist rate, only a low-pass filter is needed to avoid noise aliasing. The analog bandwidth of the digitizer limits the signal bandwidth, but if this filtering is not enough, a low-pass filter that often is built into digitizers can be used. In tune mode, frequency sweeps for simultaneously monitoring CLR#1 and CLR#2 are generated by AWG ch1 and ch2. Reflected signals are detected through couplers 1 and 2 to ADC ch1 and ch2. Background compensation from AWG ch2 can be input through coupler 2. Magnetic field modulation for CW or rapid scan is generated with AWG ch3 via a locally-designed coil driver [22]. Since the frequencies required for magnetic field modulation are lower than for the carrier frequency for spin excitation, a lower-frequency AWG or function generator can be used in place of AWG ch3. Synchronization with data acquisition is controlled by a trigger from a Tektronix AWG7122C marker channel.
If a reflection resonator is used instead of the CLR, coupler 1 is replaced by a circulator, LNA2 is connected to port 2 of the circulator, and only one ADC channel is required. The disadvantages of this simplification of the spectrometer are that the circulator needs to be changed for operation in different frequency bands and the reflected signal at the carrier frequency, which is large relative to the EPR signal, makes digital detection more difficult as discussed in section 2.3.
2.1. Tuning
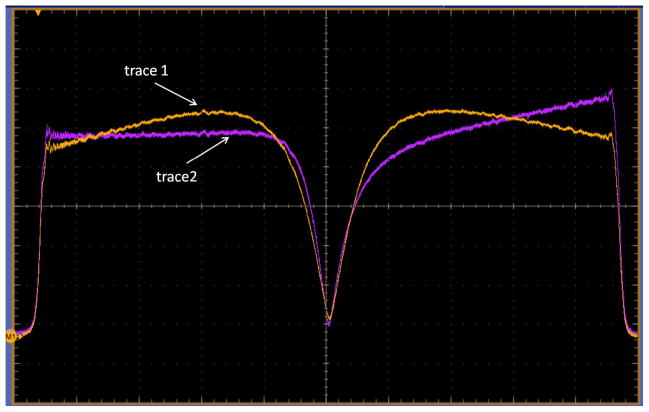
Tuning the CLR requires adjustment of the frequency and coupling for both CLR#1 and CLR#2, which is facilitated by simultaneous real-time sweeps. In the tune mode, AWG ch1 and ch2 generate frequency sweeps that encompass the bandwidths of the resonators. Signals digitized by ADC ch1 and ch2 are Fourier transformed and the absolute values of the result are displayed on the monitor of a computer or digital scope as shown in Fig 2. Representing tuning patterns in the frequency domain rather than in the traditional time domain has three major advantages: (i) The resonance frequencies can be measured and used to set the carrier frequencies for the excitation waveforms, (ii) the pattern is independent of possible time delays in the excitation and detection paths, and (iii) Fourier transformation rejects noise outside the bandwidth of interest.
Fig. 2.
Screen capture of oscilloscope display used for resonator tuning. The Fourier transforms of the responses of CLR#1 (trace 1) and CLR#2 (trace 2) to the frequency sweeps generated by AWG ch1 and ch2 are shown.
2.2. Data processing
To satisfy the Nyquist criterion, the EPR signal was digitized with sampling rate fs that was more than twice the carrier frequency. This produced a discrete signal s(tk) with tk = k/fs, k=1: N, where N is the number of data points transferred to a computer. Digital down-conversion to baseband was performed in three steps. (i) The signal s(tk) was multiplied by the reference signal exp(jωcarriertk, which gives baseband plus the signal at the second harmonic of the carrier. (ii) The data size was reduced by averaging groups of d consecutive points, with d selected based on the bandwidth required to define the signal. For the data reported in this paper d = 8 or 16. The data size reduction decreases the effective sampling rate below Nyquist for the upper sideband and removes the signal at the second harmonic. (iii) A 4th order Butterworth filter was applied. At that point results obtained by digital detection are similar to those that would have been obtained by homodyne detection, so subsequent data analysis is the same as would be the case for a standard bridge-based spectrometer.
2.3 Leakage compensation
For experiments that use continuous excitation and data acquisition such as CW, rapid scan, and saturation recovery, replacing homodyne detection by heterodyne or direct detection requires digitization of a weak EPR signal superimposed on a relatively large-amplitude signal at the carrier frequency. If a reflection resonator is used, this strong carrier frequency signal occurs as a result of deviation from critical coupling between the transmission line and the resonator. The amplitude at the carrier frequency is decreased if a bimodal resonator is used to isolate excitation from detection [23] by 40–60 db. In both cases the presence of intensity at the carrier frequency reduces the efficiency of digital detection due to three major factors. First, high speed digitizers typically have vertical resolution of only 8–10 bits. Thus, if the carrier is much stronger than the EPR signal, the effective vertical resolution for the EPR signal could be less than one bit. Averaging and/or over-sampling [24] in combination with dithering can be used to increase effective resolution, but may be limited by coherent clutter in the digitizer. This problem will be solved when inexpensive high resolution, high speed digitizers become available. Secondly, phase noise of the sampling clock modulates the strong background signal producing additional noise. Thirdly, having a weak EPR signal on top of a strong CW carrier limits the first stage amplification gain. It is therefore useful to examine ways to compensate the leakage.
For the rapid scan experiments the leakage was compensated by introducing a sinusoidal waveform at the carrier frequency, generated by AWG ch2 through coupler 2. The amplitude and phase of the compensation signal were adjusted to minimize the contribution to the digitized signal from leakage at the carrier frequency, which can be done automatically in real time. For a coarse phase adjustment a phase shifter can be used as shown in Fig.1.
3. Experimental
3.1 Samples
LiPc prepared electrochemically following procedures in the literature [25,26] was provided by Prof. Harold M. Swartz, Dartmouth University. Multiple small crystals of LiPc were placed in a 3-mm OD tube. The tubes were extensively evacuated and then flame sealed. Solutions of 0.2 mM Nycomed trityl-CD3 (methyl tris(8-carboxy-2,2,6,6-tetramethyl (d3)-benzo[1,2-d:4,5-d’]bis(1,3)dithiol-4-yl)- tri sodium salt) in water in a 16-mm O.D. quartz tube, 0.2 mM trityl OX63 (methyl tris(8-carboxy-2,2,6,6-tetra(2-hydroxyethyl)-benzo[1,2-d:4,5-d’]bis(1,3)dithiol-4-yl)- tri sodium salt) in water in 4-mm OD quartz tubes or 0.25 mM 15N-mHCTPO-d12 (15N-4-hydro-3-carbamoyl-2,2,5,5-tetramethylpyrrolin-1-yloxy-d12, CDN Isotopes) in water in an 16-mm OD quartz tube were purged extensively with gaseous nitrogen and then flame sealed.
3.2 Rapid field-scan EPR with CLR at 256 MHz
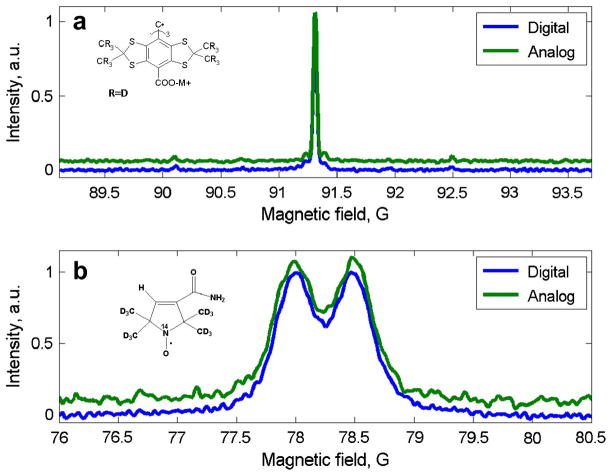
To compare rapid scan EPR spectra obtained using digital detection (Fig.1) and analog homodyne detection with a quadrature mixer, our locally-designed 250 MHz spectrometer [27], coil driver [22], and wire CLR [28] were used. A Tektronix AWG7122C (2.56 GS/s, 8 bit resolution) was used to generate waveforms at the ca. 256 MHz carrier (AWG ch1 and ch2 in Fig.1) and a Tektronix AWG2041 (1 GS/s, 8 bit resolution) was used to generate the triangular waveform for the rapid scans. The EPR signals were digitized with a Tektronix DPO7254 with a sampling rate of 1 GS/s. The following parameters were the same for the digital and analog experiments: excitation power, low-pass filters, number of averages, triangular field scan width of 4.8 G, and scan frequency of 4 kHz. The signal from the detection resonator CLR#2 was amplified by 22 db for homodyne detection and by 44 db for digital detection. The increased gain for direct detection was possible because of the compensation of the leakage. The amplitude and phase of the compensating waveform were manually adjusted to zero the leakage. Rapid scan spectra were deconvolved to obtain the slow scan absorption and dispersion signals [20]. The resulting absorption spectra are shown in Fig. 3 for two samples: 0.2 mM trityl-CD3 (Fig. 3a) and 0. 25 mM mHCTPO (Fig. 3b). The excitation power for the trityl-CD3 sample was 800 μW and the number of averages was 1024. For the mHCTPO sample the power was 2.5 mW and the number of averages was 4096. The powers are in the linear response regime. Butterworth 4th order low pass filters were used with cut-off frequencies of 800 kHz for trityl-CD3 and 500 kHz for mHCTPO. For both samples there is excellent agreement between the lineshapes and relative intensities obtained by the two methods.
Fig. 3.
Rapid scan EPR spectra at 256 MHz. a) 0.2 mM aqueous trityl-CD3; b) low-field nitrogen hyperfine line of 0.25 mM aqueous 15N-mHCTPO. The doublet splitting is due to the single proton at position 4 of the ring.
In addition to the data shown in Fig. 3, multiple comparison data sets were collected for several samples with different sampling rates, first stage amplifier gains, and selection of low-pass filters in the digitizer. The SNR was about the same for digital and analog data acquisition. For some analog data sets, including the one used in Fig. 3b, systematic noise is observed and attributed to an unidentified pickup signal detected in the analog experiment (Fig. 3b). This pickup signal is not correlated with the carrier frequency and partially disappears with averaging. This signal was not observed with digital detection, so it is attributed to pickup in the bridge.
3.3 FID with CLR at L-band
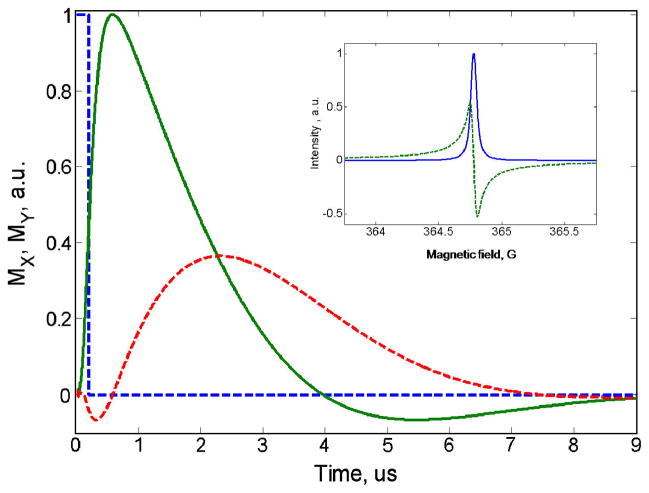
The spin response for LiPc was recorded using direct digital detection at L-band (1037.8 MHz). A Tektronix AWG7122C (ch1 and ch2 in Fig.1) generated excitation waveforms that were amplified by 20 dB prior to the resonator (LNA1 in Fig. 1). EPR signals were amplified by 30 dB before digitization at 4 GS/s rate with an Acqiris U1084A 8-bit digitizer. The cross-loop resonator was analogous, but with modified dimensions, to a previously described L-band resonator [29]. The isolation of about 60 db facilitated digital experiments by significantly reducing the ring-down after the pulse and avoiding saturation of the preamplifier. With a 200 ns 90° pulse, it was possible to subtract the off-resonance background signal, and the evolution of the spin response during the pulse could be characterized (Fig 4) i.e., there was no spectrometer dead time as is normally characteristic of FID measurements. The observation of the EPR signal during a pulse has some precedent in pulsed saturation recovery [30] and observations of Torry oscillations [31], but the signal shown here is the first published example of the full dynamics of the EPR signal during a pulse. The transverse magnetization started rising during the excitation, reached a maximum at about 500 ns and decayed freely thereafter. The observed magnetization profile reflects the time response of B1 in CLR#1, which is determined by quality factor Q1 and the response of the spins in CLR#2, which is determined by quality factor Q2. This profile is consistent with a simulation of the time evolution of the magnetization based on Q1 = Q2 = 250. The ability to measure the entire EPR response to the excitation, even during the time of the pulse, may help in evaluating the resonator Q. Fourier transformation of the FID (starting after the peak of the curve in Fig. 4) gave the absorption and dispersion components of the signal. The FWHM linewidth was 55 mG, which is consistent with measurements of CW lineshape and of Tm by spin echo [32].
Fig. 4.
Digitally recorded spin response for LiPc at L-band obtained with a 200 ns 90° pulse and the spectrum obtained by Fourier transformation. The I and Q channels for the spin response and the absorption (blue solid line) and dispersion (green dashed lines) signals are shown. The square pulse produced by the AWG (dashed blue line) is plotted to demonstrate the effect of resonator Q on the spin response. Time zero is the beginning of the pulse.
3.4 Spin-echo with phase cycling at L-band with CLR
The spin echo experiments were performed with the same resonator, AWG, and digitizer as for the FID. The sample was an aqueous solution of the OX63 trityl radical.
In homodyne detection for pulse EPR, the signal is amplified at the carrier frequency. Quadrature detection involves splitting the signal and reference into two channels that are down-converted with two mixers, and then amplified. The reference channel is shifted by 90°. Imperfection in the phase shifter and differences in amplifier gain between the two channels cause the two components to have different amplitudes and not be orthogonal. Additional phase cycles are used to eliminate the distortion [33], at the cost of partial cancellation of the useful EPR signal due to the degree of nonorthogonality. If digital down-conversation is implemented in software, quadrature channels are 90° apart to within detectable error and have equal weightings, which means that the additional phase cycles are not needed [2]. Thus, digital detection has two advantages: significant reduction of the number of cycles and SNR improvement. For example, for a two pulse spin echo experiment (π/2-τ-π-τ-echo), the 16-step Cyclops sequence can be reduced to four steps. For sequences with three or more pulses the reduction in the number of steps is even larger. Table 1 describes the four-step phase cycling that was used in the spin-echo experiment. The notation +x and −x denotes pulses along the positive and negative x-axes in the rotating frame. Quadrature signals are summed (+a, +b) or subtracted (−a, −b) to cancel unwanted FID signals.
Table 1.
Phase cycling and signal summation for 2-pulse spin echo
| Cycle number | Excitation phase | Detection channel | ||
|---|---|---|---|---|
| Real part | Imaginary part | |||
| 1 | +x | +x | +a | +b |
| 2 | −x | +x | −a | −b |
| 3 | +x | −x | +a | +b |
| 4 | −x | −x | −a | −b |
Use of an AWG7122C with large memory (up to 128 megasamples) permitted performance of an experiment with spin echoes at six τ values and 4-step phase cycling using a single composite excitation pattern. The pattern consisted of 24 consecutive waveforms, each having aπ/2 and a π pulse (360 and 720 ns) separated by different τ values (Fig. 5). The duration of each segment of the waveform (Table 2) was 32.5 μs, which was about 5.4 times the relaxation time for the radical. The total duration of the excitation waveform produced by the AWG was 780 μs. The entire pattern was repeated 327680 times to measure on-resonance signals and 327680 times to measure off-resonance signals for background subtraction. The total acquisition time was about 9 minutes. The marker channel produced a trigger for the digitizer (Acqiris U1084A) after every fourth segment, for a total of 6 triggers. Signals between the triggers were summed in the digitizer forming an array of four segments with 130 μs duration (Table 2), and reducing the size of the data set by a factor of 6. In the first segment were echoes with positive amplitudes and τ = 1, 5, and 9 μs. In the second segment were echoes with negative amplitudes and the same delays. The third and fourth segments had echoes with positive and negative amplitudes and τ = 3, 7, and 11 μs. The time delays in the waveform should be chosen so that successive echoes do not overlap (Fig. 5). The digitized signal was transferred to the computer for down-conversion to baseband. The second segment was then subtracted from the first and the fourth from the third, completing the phase cycling. This is equivalent to performing the cycles in Table 1 for each of the 6 echoes. The result is shown in Fig. 5.
Fig. 5.
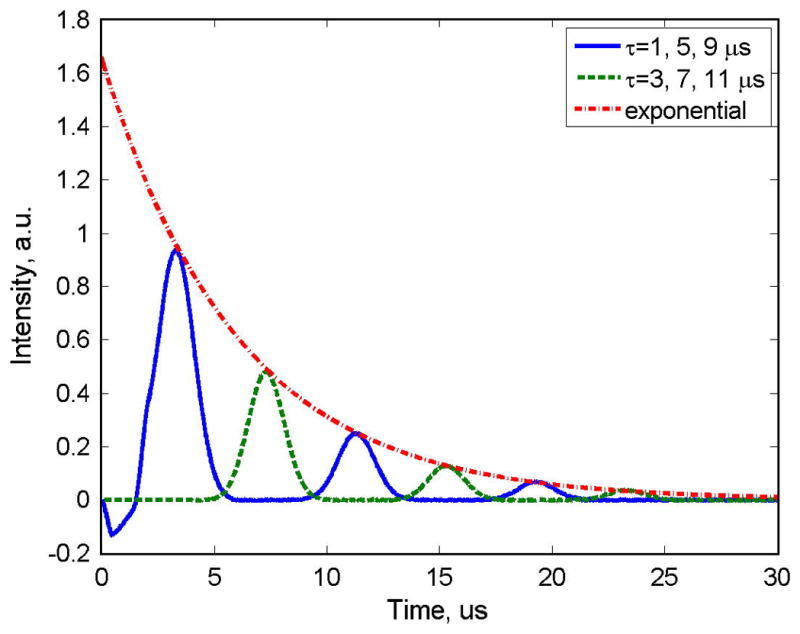
Two-pulse spin echo data for OX63 at L-band, obtained with 4-step phase cycling and the single composite excitation pattern described in Table 2. Time zero is the nominal beginning of the first pulse, uncorrected for time delays in the system.
Table 2.
Composite excitation waveform for detection of echoes at six τ values with 4-step phase cycling
| Segment 1 | Segment 2 | Segment 3 | Segment 4 | |||||||||
|---|---|---|---|---|---|---|---|---|---|---|---|---|
| Trigger | ph1 | ph2 | τ, μs | ph1 | ph2 | τ, μs | ph1 | ph2 | τ, μs | ph1 | ph2 | τ, μs |
| 1 | +x | +x | 1 | −x | +x | 1 | +x | +x | 3 | −x | +x | 3 |
| 2 | +x | −x | 1 | −x | −x | 1 | +x | −x | 3 | −x | −x | 3 |
| 3 | +x | +x | 5 | −x | +x | 5 | +x | +x | 7 | −x | +x | 7 |
| 4 | +x | −x | 5 | −x | −x | 5 | +x | −x | 7 | −x | −x | 7 |
| 5 | +x | +x | 9 | −x | +x | 9 | +x | +x | 11 | −x | +x | 11 |
| 6 | +x | −x | 9 | −x | −x | 9 | +x | −x | 11 | −x | −x | 11 |
Peak-picking or integration of the spin echoes produces an echo-decay curve. Because of the excellent SNR for the data shown in Fig. 5, the peaks of the echoes were fitted with an exponential (dash-dot red line in Fig. 5). The measured relaxation time of 6 μs was in the good agreement with the literature value [34]. To increase the number of data points in the echo decay curve the number of segments could be increased, the increments in time delays could be decreased, or the excitation could be repeated with different values of τ. Measurement of the entire echo signal has the advantage that the integration window can be selected in post-processing to optimize resolution and SNR.
3.5 FID and spin-echo with reflection resonator at X-band
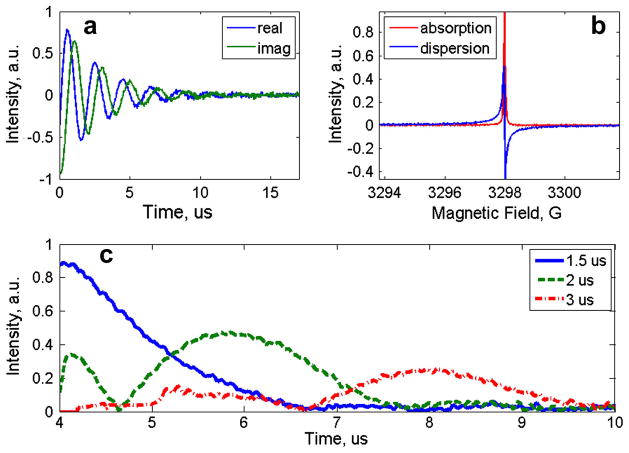
Direct digital detection of the FID (Fig. 6a, b) and spin echoes for LiPc was done at X-band (Fig. 6c). The resonator was a Varian TE102 rectangular cavity. Excitation waveforms were generated using a Tektronix AWG7122C at 9.23 GHz carrier frequency with a sampling clock of 22.16 GS/s, which gave about 2.4 points per microwave cycle. The excitation waveform was amplified by 30 db before the resonator and the signal was amplified by 30 db after the resonator. Data acquisition was done with a Tektronix MSO72004C digital scope with an analog bandwidth of 20 GHz. For FID detection the pulse length was 500 ns, and the sampling rate was 50 GS/s. Fig. 6a shows the result of digital down-conversion of the digitized FID signal to baseband. Since a reflection resonator was used, the reflected ring-down was much more intense than the EPR signal. With the vertical resolution of the digitizer used it was not possible to record the spin evolution during the pulse, as was done when a CLR was used at L-band (Fig. 4). Fourier transformation of the FID produces the absorption and dispersion spectra as shown in Fig. 6b.
Fig. 6.
Digitally detected signals for LiPc at X-band. (a) FID, (b) Fourier transform of the FID, and (c) three spin echoes obtained with 4-step phase cycling and 0.2 G 35 Hz field modulation to cancel the FID. Time zero is the nominal beginning of the first pulse, without correction for time delays in the system.
For spin-echo measurement four-step phase cycling was implemented (Table 1) with π/2 and π pulse lengths of 600 and 1200 ns, and the signal was digitized at 25 GS/s. The echo signals for τ =1.5, 2 and 3μs were measured. The lineshape for LiPc is T2 determined, so inhomogeneity must be added to permit detection of a spin echo. This was done by 35 Hz sinusoidal field modulation with 2 G amplitude, generated by the spectrometer console. This modulation was not sufficient to completely cancel FID components that overlap the echoes so FID contamination is significant for the echo at τ =1.5. Echoes were averaged 5000 times. Three spin-echo signals (Fig. 6c) were obtained by digital down-conversion to baseband. Absolute values are shown in the figure. .
4. Discussion
The experiments reported in this paper and in our recent papers describing the Frank sequence [35,36] and rapid frequency scans [37] demonstrate the feasibility of digital excitation and detection at the carrier frequency for rapid scan and pulse EPR. The traditional bridge is replaced by an AWG, high-speed digitizer, and computer. The same components can be used over a wide range of frequencies, with the upper limit determined by the sampling rates of the AWG and digitizer. The resonator is the component with the narrowest bandwidth. Low noise amplifiers and directional couplers also have limited operating frequency ranges. In some cases amplifiers and couplers may cover both the 250 MHz band (VHF) and L-band in a single unit, but X-band will generally require separate devices. These are small components that conceptually may be combined with the resonator as a frequency specific module. Tuning of the resonator can be done in real-time. Rapid scan and pulse EPR experiment have short excitation periods, and data sizes are manageable with modern digitizers. Composite excitation waveforms can be used to collect multiple echoes within a single acquisition window. Since a large number of averages must be done, it is more practical to use a real time averager rather than a digital scope that typically has a long re-arm time between averages. Scopes also are more expensive, although they provide useful features such as Fourier transform and filtering, so that some preprocessing can be done before data transfer to the host computer.
Direct digital detection at the carrier frequency reduces the number of hardware components in an EPR spectrometer, but increases the amount of data to be transferred to the host computer and processed. The problem with large amounts of data is more acute for standard field-modulated CW EPR with long data acquisition times (tens of seconds or more) than for pulse or rapid-scan experiments (10–100 μs). In the long-term the larger data sizes will be managed with less processing time as computer capability increases. A short-term solution might be step-wise scanning of the external magnetic field and collection of a few modulation cycles at each field position. The signal at each position could be averaged using a real-time digitizer (Acqiris U1084A), thus increasing SNR without loss of experiment time. The data set could then be transferred to a computer for postprocessing and the size significantly reduced by digital down-conversion.
For experiments with continuous excitation, the problem created by the background signal needs to be addressed. Digitization of a weak signal in the presence of a strong background component reduces the effective vertical resolution and limits the gain of the first amplifier. The problem can be partially solved by using high resolution digitizers and by over-sampling. However, it may be more efficient to use the background compensation methods described is this paper. A potential problem with the proposed compensation method might be instability of amplitude and phase of the leakage or reflected signal. Real-time automated adjustment of the amplitude and phase of AWG (ch2) would provide more effective compensation.
Acknowledgments
Funding for this work from NIH NIBIB grant EB000557 (GRE and SSE) and NIH NIBIB P41 EB002034 (Howard J. Halpern, PI) is gratefully acknowledged. Samples of OX63 and OX63-d24 were provided by Howard Halpern, University of Chicago and a sample of LiPc was provided by Prof. Harold M. Swartz, Dartmouth University. The loan of the AWG and oscilloscope from Tektronix and the digitizer card from Agilent Acqiris is gratefully acknowledged.
References
- 1.Pohida TJ, Fredrickson HA, Tschudin RG, Fessler JF, Krishna MC, Bourg J, Harrington F, Subramanian S. High-speed digitizer/averager data-acquisition system for Fourier transform electron paramagnetic resonance spectroscopy. Rev Sci Instrum. 1994;65:2500–2504. [Google Scholar]
- 2.Subramanian S, Murugesan R, Devasahayam N, Cook JA, Afeworki M, Pohida TJ, Tschudin RG, Mitchell JB, Krishna MC. High-speed data acquisition system and receiver configurations for time-domain radiofrequency electron paramagnetic resonance spectroscopy and imaging. J Magn Reson. 1999;137:379–88. doi: 10.1006/jmre.1998.1697. [DOI] [PubMed] [Google Scholar]
- 3.Murugesan R, Afeworki M, Cook JA, Devasahayam N, Tschudin R, Mitchell JB, Subramanian S, Krishna MC. A broadband pulsed radio frequency electron paramagnetic resonance spectrometer for biological applications. Rev Sci Instrum. 1998;69:1869–1876. [Google Scholar]
- 4.Hyde JS, McHaourab HS, Camenisch TG, Ratke JJ, Cox RW, Froncisz W. Electron paramagnetic resonance detection by time-locked subsampling. Rev Sci Instrum. 1998;69:2622–2628. [Google Scholar]
- 5.Froncisz W, Camenisch TG, Ratke JJ, Hyde JS. Pulse saturation recovery, pulse ELDOR, and free induction decay electron paramagnetic resonance detection using time-locked subsampling. Rev Sci Instrum. 2001;72:1837–1842. [Google Scholar]
- 6.Hyde JS, Camenisch TG, Ratke JJ, Strangeway RA, Froncisz W. Digital Detection by Time-Locked Sampling in EPR. Biol Magn Reson. 2005;24:199–222. [Google Scholar]
- 7.Pursley RH, Salem G, Devasahayam N, Subramanian S, Koscielniak J, Krishna MC, Pohida TJ. Integration of digital signal processing technologies with pulsed electron paramagnetic resonance imaging. J Magn Res. 2006;178:220–227. doi: 10.1016/j.jmr.2005.10.001. [DOI] [PMC free article] [PubMed] [Google Scholar]
- 8.Pursley RH, Salem G, Pohida TJ, Devasahayam N, Subramanian S, Krishna MC. Direct detection and time-locked subsampling applied to pulsed electron paramagnetic resonance imaging. Rev Sci Instrum. 2005;76:53709–53715. doi: 10.1063/1.1903163. [DOI] [PMC free article] [PubMed] [Google Scholar]
- 9.Forrer J, Schmutz H, Tschaggelar R, Schweiger A. Direct EPR Detection of Transient and Continuous Wave Signals at 2.5 GHz. J Magn Reson. 2004;166:246–251. doi: 10.1016/j.jmr.2003.10.022. [DOI] [PubMed] [Google Scholar]
- 10.Ahmad R, Som S, Kesselring E, Kuppusamy P, Zweier JL, Potter LC. Digital detection and processing of multiple quadrature harmonics for EPR spectroscopy. J Magn Reson. 2010;207:322–331. doi: 10.1016/j.jmr.2010.09.016. [DOI] [PMC free article] [PubMed] [Google Scholar]
- 11.Tseitlin M, Quine RW, Rinard GA, Eaton SS, Eaton GR. Combining Absorption and Dispersion Signals to Improve Signal-to-noise for Rapid Scan EPR Imaging. J Magn Reson. 2010;203:305–310. doi: 10.1016/j.jmr.2010.01.013. [DOI] [PMC free article] [PubMed] [Google Scholar]
- 12.Tseitlin M, Eaton SS, Eaton GR. Reconstruction of the first derivative EPR spectrum from multiple harmonics of the field-modulated CW signal. J Magn Reson. 2011;209:277–281. doi: 10.1016/j.jmr.2011.01.027. [DOI] [PMC free article] [PubMed] [Google Scholar]
- 13.Marsh D, Horváth LI, Páli T, Livshits V. Saturation Transfer Spectroscopy of Biological Membranes. Biol Magn Reson. 2005;24:309–367. [Google Scholar]
- 14.Perkins RC, Jr, Lionel T, Robinson BH, Dalton LA, Dalton LR. Saturation transfer spectroscopy: signals sensitive to very slow molecular reorientation. Chem Phys. 1976;16:393–404. [Google Scholar]
- 15.Tseitlin MP, Tseitlin OA. Using of digital demodulation of multiharmonic overmodulated EPR signals to improve EPR oximetry reliability Appl. Magn Reson. 2009;36:25–34. [Google Scholar]
- 16.Bikineev VA, Zavatskii EA, Isaev-Ivanov VV, Lavrov VV, Lomakin AV, Fomichev VN, Shabalin KA. Methods of correcting modulation-induced lineshape distortions in electron paramagnetic resonance spectroscopy. Tech Phys. 1995;40:619–625. [Google Scholar]
- 17.Robinson BH, Mailer C, Reese AW. Linewidth analysis of spin labels in liquids. I. Theory and data analysis. J Magn Reson. 1999;138:199–209. doi: 10.1006/jmre.1999.1737. [DOI] [PubMed] [Google Scholar]
- 18.Robinson BH, Mailer C, Reese AW. Linewidth analysis of spin labels in liquids. II. Experimental. J Magn Reson. 1999;138:210–219. doi: 10.1006/jmre.1999.1738. [DOI] [PubMed] [Google Scholar]
- 19.Ahmad R, Kuppusamy P. Theory, Instrumentation, and Applications of Electron Paramagnetic Resonance Oximetry. Chem Rev. 2010;110:3212–3236. doi: 10.1021/cr900396q. [DOI] [PMC free article] [PubMed] [Google Scholar]
- 20.Joshi JP, Ballard JR, Rinard GA, Quine RW, Eaton SS, Eaton GR. Rapid-Scan EPR with Triangular Scans and Fourier Deconvolution to Recover the Slow-Scan Spectrum. J Magn Reson. 2005;175:44–51. doi: 10.1016/j.jmr.2005.03.013. [DOI] [PubMed] [Google Scholar]
- 21.Stoner JW, Szymanski D, Eaton SS, Quine RW, Rinard GA, Eaton GR. Direct-detected rapid-scan EPR at 250 MHz. J Magn Res. 2004;170:127–135. doi: 10.1016/j.jmr.2004.06.008. [DOI] [PubMed] [Google Scholar]
- 22.Quine RW, Czechowski T, Eaton GR. A Linear Magnetic Field Scan Driver. Conc Magn Reson B (Magn Reson Engin) 2009;35B:44–58. doi: 10.1002/cmr.b.20128. [DOI] [PMC free article] [PubMed] [Google Scholar]
- 23.Rinard GA, Quine RW, Ghim BT, Eaton SS, Eaton GR. Easily tunable crossed-loop (bimodal) EPR resonator. J Magn Reson A. 1996;122:50–57. [Google Scholar]
- 24.Orfanidis SP. Introduction to Signal Processing. Prentice Hall: Englewood Cliffs; 1996. [Google Scholar]
- 25.Turek P, Andre JJ, Giraudeau A, Simon J. Preparation and study of a lithium phthalocyanine radical: optical and magnetic properties. Chem Phys Lett. 1987;134:471–476. [Google Scholar]
- 26.Grinberg VO, Smirnov AI, Grinberg OY, Grinberg SA, O'Hara JA, Swartz HM. Practical conditions and limitations for high spatial resolution of multi-site EPR oximetry. Appl Magn Reson. 2005;28:69–78. [Google Scholar]
- 27.Quine RW, Rinard GA, Eaton SS, Eaton GR. A pulsed and continuous wave 250 MHz electron paramagnetic resonance spectrometer. Magn Reson Engineer. 2002;15:59–91. [Google Scholar]
- 28.Rinard GA, Quine RA, Biller JR, Eaton GR. A Wire Crossed-Loop-Resonator for Rapid Scan EPR. Concepts Magn Reson B, Magn Reson Engineer. 2010;37B:86–91. doi: 10.1002/cmr.b.20161. [DOI] [PMC free article] [PubMed] [Google Scholar]
- 29.Rinard GA, Quine RW, Eaton GR. An L-Band crossed-loop (bimodal) EPR resonator. J Magn Reson. 2000;144:85–88. doi: 10.1006/jmre.2000.2014. [DOI] [PubMed] [Google Scholar]
- 30.Nechtschein M, Hyde JS. Pulsed electron-electron double resonance in an S=1/2, I = 1/2 system. Phys Rev Lett. 1970;24:672–674. [Google Scholar]
- 31.Huisjen J, Hyde JS. A pulsed EPR spectrometer. Rev Sci Instrum. 1974;45:669–675. [Google Scholar]
- 32.Sato H, Dalton LA, Ha D, Quine RW, Eaton SS, Eaton GR. Electron Spin Relaxation in x-Lithium Phthalocyanine. J Phys Chem B. 2007;111:7972–7977. doi: 10.1021/jp070810y. [DOI] [PubMed] [Google Scholar]
- 33.Schweiger A, Jeschke G. Principles of Pulse Electron Paramagnetic Resonance. Oxford University Press; Oxford: 2001. [Google Scholar]
- 34.Owenius R, Eaton GR, Eaton SS. Frequency (250 MHz to 9.2 GHz) and Viscosity Dependence of Electron Spin Relaxation of Triarylmethyl Radicals at Room Temperature. J Magn Res. 2005;172:168–175. doi: 10.1016/j.jmr.2004.10.007. [DOI] [PubMed] [Google Scholar]
- 35.Tseitlin M, Quine RW, Eaton SS, Eaton GR, Halpern HJ, Ardenkjaer-Larsen JH. Use of the Frank Sequence in Pulsed EPR. J Magn Reson. 2011;209:306–309. doi: 10.1016/j.jmr.2011.01.032. [DOI] [PMC free article] [PubMed] [Google Scholar]
- 36.Tseitlin M, Quine RW, Eaton SS, Eaton GR. Use of polyphase continuous excitation based on the Frank sequence for EPR. J Magn Reson. 2011;211:221–227. doi: 10.1016/j.jmr.2011.06.005. [DOI] [PMC free article] [PubMed] [Google Scholar]
- 37.Tseitlin M, Rinard GA, Quine RW, Eaton SS, Eaton GR. Rapid Frequency Scan EPR. J Magn Reson. 2011;211:156–161. doi: 10.1016/j.jmr.2011.05.006. [DOI] [PMC free article] [PubMed] [Google Scholar]


