

Abstract
Undifferentiated (anaplastic) thyroid cancer (ATC) is one of the most aggressive human malignancies and no effective therapy is currently available. We show here that PPARγ levels are elevated in cells derived from ATC. Depletion of PPARγ in HTh74 ATC cells resulted in decreased cell growth, cell cycle arrest and a reduction in pRb and cyclin A and B1 levels. We further showed that both flank and orthotopic thyroid tumors derived from PPARγ-depleted cells grew more slowly than PPARγ-expressing cells. When PPARγ was overexpressed in more differentiated thyroid cancer BCPAP cells which lack PPARγ, there was increased growth and raised pRb and cyclin A and B1 levels. Finally, PPARγ depletion in ATC cells decreased their invasive capacity whereas overexpression in PTC cells increased invasiveness. These data suggest that PPARγ may play a detrimental role in thyroid cancer and that targeting it therapeutically may lead to improved treatment of advanced thyroid cancer.
1. Introduction
Thyroid cancer is the most common endocrine malignancy with 44,000 new cases each year and approximately 400,000 Americans are currently living with the disease. While many patients diagnosed with thyroid cancer do very well after standard therapy (surgery, radioiodine, levothyroxine replacement), approximately 1,700 patients with poorly differentiated thyroid cancer die each year and many others suffer from progressive, symptomatic disease. Furthermore, anaplastic thyroid cancer is one of the most lethal cancers, with a 50% survival of only 6 months. A better understanding of how thyroid cancer progresses from differentiated to undifferentiated cancer will help us to develop critical markers of this disease progression and novel therapies to treat patients with advanced thyroid cancer.
Peroxisome proliferator-activated receptors (PPARs) are members of the nuclear hormone receptor superfamily which are ligand-dependent transcription factors that regulate many important physiological processes [1]. PPARs exist as three different isoforms (α, γ, and δ) that play major roles in adipose tissue development and lipid metabolism [2, 3]. In addition to its widely understood role in adipocyte biology, the PPARγ isoform has been implicated in regulating carcinogenesis [4]. Furthermore, PPARγ activators of the thiazolidinedione class (TZDs) such as rosiglitazone have been reported to slow the growth of colon [5] and lung [6, 7] tumors. However, the role of PPARγ in tumorigenesis is controversial, stemming from the discrepancy between the anticancer effects suggested by in vitro studies, and the tumor-promoting capacity reported in mouse models of colon cancer [8]. This could be a consequence of the fact that cells in culture are not subjected to the microenvironment interactions necessary for complex tumor formation in vivo. In addition, many in vitro studies reveal that the antiproliferative effects are seen only when concentrations of PPARγ agonist greatly exceed that needed to saturate the receptor. Growth inhibition by PPARγ ligands has also been reported in cells that do not express PPARγ, questioning a legitimate role for the receptor in mediating this effect [9]. A recent article by Wei et al. [10] reviews these “off-target” mechanisms that underlie the antitumor activity of TZDs specifically and provide evidence that, relative to tumor cells, nonmalignant cells are resistant to these PPARγ-independent antitumor effects. Thus, the anticancer action attributed to PPARγ ligands may not be through classical PPARγ signaling. There is an extensive literature on the effect of PPARγ ligands on growth of thyroid cancer cells in vitro and in mouse xenografted tumors [11–15]. It is not clear if the effects of PPARγ agonists are receptor-dependent or independent [9]. Furthermore, we have discovered that many of the cell lines used in these studies were not of thyroid origin [16]. In fact, one of the most responsive cell lines, which expresses PPARγ, was derived from a melanoma [17, 18]. Finally, clinical trials using PPARγ agonists in advanced thyroid cancer have been disappointing and PPARγ levels were not assessed in most tumors [19, 20]. Clearly, a better understanding of the role of PPARγ in advanced thyroid cancer is needed.
2. Materials and Methods
2.1. Cell Lines and Chemicals
Cell lines were obtained from the primary source or the American Type Culture Collection (ATCC) with the exception of the following. BCPAP cells were kindly provided by Dr. M. Santoro (Medical School, University of Naples Federico II, Naples, Italy). K1 cell lines were provided by Dr. Wynford-Thomas (Cardiff University, Cardiff, UK). C643 and HTh74 cells were from Dr. K. Ain (University of Kentucky, Lexington, KY) with permission from Dr. N. E. Heldin (University Hospital, Uppsala, Sweden), and the TPC1 cells were kindly provided by Dr. S. Jhiang (Ohio State University, Columbus, OH). The cell lines used in this study were analyzed by short tandem repeat profiling and shown to be unique [16]. Cells were grown in RPMI (Invitrogen, Carlsbad, CA) containing 5% FBS (Hy-Clone Laboratories, Logan, UT) and maintained at 37°C in 5% CO2. Rosiglitazone (thiazolidinedione, TZD) was provided by GlaxoSmithKline.
2.2. Viable Cell Proliferation Assays
Cells were plated in duplicate in 6 cm dishes in RPMI containing 5% FBS at 45,000 cells/dish. The medium containing 1 or 10 μM Rosi, or DMSO was replaced every 3 days for 6 days. Cells in the medium were collected, and adherent cells were harvested using Trypsin-EDTA at the time indicated, quenched with RPMI containing 5% serum, and resuspended in 0.5 mL PBS. Viable cells were counted using a Beckman Coulter ViCell cell counter, which counts 100 fields of cells and calculates viable cells using trypan blue exclusion.
2.3. Cell Cycle Analysis
Cells were plated in 6 cm dishes at 1 × 10⁵/well in RPMI containing 0.1% FBS. After 24 h at 37°C to restrict cells to G0, the medium was replaced with RPMI supplemented with 5% FBS. After a further 24 h, cells were collected by trypsinization and washed twice in ice-cold PBS. Cell pellets were resuspended in a saponin/propidium iodide solution (0.3% saponin, 25 mg/mL propidium iodide, 0.1 mM EDTA, and 10 μg/mL RNase A) and incubated at 37°C for 24 h. Cell cycle distribution was determined by flow cytometry using a Beckman Coulter FC500 at the University of Colorado Cancer Center Flow Cytometry Core. ModFit LT (Verity Software House, Topsham, ME) was used for cell cycle modeling and doublet discrimination.
2.4. Western Blot Analysis
Nuclear protein was prepared from cells using a nuclear extract kit supplied by Active Motif (catalog number 400100, Carlsbad, CA). For preparation of whole cell extracts, cells were trypsinized, centrifuged at 1000 rpm for 5 min, and suspended in extraction buffer (EB; 1% Triton X-100, 10 mM Tris HCL, pH 7.4, 5 mM EDTA, 50 mM NaF, 1 mM phenylmethylsulfonyl fluoride, and 2 mM Na3VO4 supplemented with 1x complete protease inhibitors (Roche Diagnostics)). Cell debris was removed by centrifugation at 13,000 rpm for 10 min at 4°C. Protein concentrations were determined using the DC protein assay (Bio-Rad Laboratories, Hercules, CA). Diluted samples containing equal amounts of protein (60 μg) were mixed with 2x Laemmli sample buffer (Bio-Rad Laboratories). Proteins were separated on a 10% SDS-polyacrylamide gel and transferred to a polyvinylidene difluoride membrane (PVD). The membrane was blocked with 1x TBST (20 mmol/L Tris-HCl (pH 7.6), 8.5% NaCl, and 0.1% Tween 20) containing 5% nonfat dry milk at room temperature for 2 h and incubated in the appropriate primary antibody in 1x TBST containing 5% nonfat dry milk at 4°C overnight. The source of primary antibodies was as follows: from Santa Cruz Biotechnology, Santa Cruz, CA, PPARγ (rabbit polyclonal, sc-7196), PPARδ (β) (rabbit polyclonal, sc-7197), cyclin A (rabbit polyclonal, sc-596), cyclin B1 (rabbit polyclonal, sc-752), cyclin D1 (mouse monoclonal, sc-20044), cyclin D2 (rabbit polyclonal, sc-593), and cdc2/cdk1 (rabbit polyclonal, sc 8395); from Cell Signaling Technology, MA, phosphoRb (Ser 807/811) (rabbit monoclonal, 9308S), p21 (rabbit monoclonal, 2947); p27 was from Novus Biologicals (100–1949). Poly (ADPribose) polymerase (PARP-rabbit polyclonal, AA16661, Millipore) and β-actin (mouse monoclonal, A-5441, Sigma) were used as loading controls for nuclear and whole cell extracts, respectively. After washing with 1xTBST, membranes were incubated for one hour at room temperature with either donkey-anti-rabbit or sheep-anti-mouse IgG conjugated to horse-radish peroxidase (HRP) (GE Healthcare, UK) at a dilution of 1 : 1000. SuperSignal West Pico Chemiluminescent Substrate, an enhanced HRP detection reagent from Thermo Scientific (Rockford, IL), was used for immunodetection. Blots were reprobed following stripping with Re-Blot Plus Strong (Millipore).
2.5. Quantitative Reverse Transcription-PCR (qRT-PCR)
Total RNA was isolated from shPPARγ or scrambled HTh74 cells using the RNeasy Mini Kit (Quiagen, Valencia, CA) as per the manufacturer's protocol. The mRNA for PPARγ was measured by real-time quantitative RT-PCR using ABI PRISM7700. The sequences of forward and reverse primers as designed by Primer Express (PE ABI) were 5′-AGT GGA GAC CGC CCA GGT-3′ and 5′-GGG CTT GTA GCA GGT TGT CTT G-3′. The TaqMan fluorogenic probe used was 6FAM-TGC TGA ATG TGA AGC CCA TTG AAG ACA-TAMRA. Amplification reactions, thermal cycling conditions, and generation of a standard curve have been described previously [18].
2.6. PPARγ shRNA Knockdown
We used a lentiviral mediated shRNA system from Sigma (St. Louis, MO) and followed the manufacturer's protocol. Lentiviral particles contain shRNA toward PPARγ-specific sequences as well as a scrambled (scr) sequence that consists of 5 nucleotides that do not match any known gene transcript in both the murine and human genome. The transduced cells are selected by puromycin resistance and then assessed for correct insertion/RNA inhibition by qRT-PCR or western blot for PPARγ. The concentration of puromycin used to select for DNA construct incorporation cells was 0.5 μg/mL.
2.7. PPARγ Overexpression
A plasmid containing the coding region of mouse PPARγ (pCMX-PPARγ) and pQCXIP retroviral expression vector were kindly provided by Dr. L. Jameson (Northwestern University, Chicago) and Dr. S. Nordeen (University of Colorado Denver, Anschutz Medical Campus), respectively. The plasmid pCL-Ampho and the BOSC cell line, a derivative of the HEK-293 cell line, were provided by Dr. H. Ford (University of Colorado Denver, Anschutz Medical Campus). The PPARγ-coding region was PCR amplified from pCMX-PPARγ using primers with terminally engineered Not I and Age I restriction sites and, after shuttling through PCR 2.1, the excised Not I/Age I fragment was gel-purified and directionally inserted into Not I/Age digested pQCXIP to generate the pQCXIP-PPARγ retroviral expression vector. The insert was sequenced in its entirety and no errors were found.
Virus was produced by transfection (Effectene; Qiagen) of BOSC cells with pQCXIP-PPARγ or pQCXIP alone in combination with pCL-Ampho, according to manufacturer's instructions. Briefly, BOSC cells were seeded in 10 cm dishes to be 60–70% confluent the next day. The vectors pCL-Ampho (2 μg) and pQCXIP or pQCXIP-PPARγ (4 μg) were mixed with EC buffer (final volume of 300 μL). Following the addition of 16 μL enhancer and 60 μL effectene, the mixture was incubated at room temperature for 5 minutes and 15 minutes, respectively. The transfection mixture was then combined with 3 mL of BOSC medium and added to BOSC cells, to which 7 mL of fresh BOSC medium had been added. Media containing viral particles was collected 48, 72, and 96 hours after transfection, and each collection was aliquoted and snap-frozen.
BCPAP cells were virally transduced to generate the BCPAP-empty vector, and BCPAP-pQCXIP-PPARγ sublines. Three rounds of transductions were carried out to generate each subline. BCPAP cells were seeded in 10 cm dishes to be 50–70% confluent the next day. For rounds 1 and 2, viral supernatant was mixed with growth media (RPMI supplemented with 10% FBS) at a 1 : 1 ratio (4 mls/10 cm plate; 8 μg/mL polybrene) and incubated with cells for 4 hours at 37°C and 5% CO2. For round 3, viral supernatant was mixed with growth media (RPMI supplemented with 10% FBS) at a 1 : 2 ratio (6 mls/10 cm plate; 8 μg/mL polybrene) and incubated with cells overnight at 37°C and 5% CO2. Selection of cells stably expressing the vector control or PPARγ constructs was initiated 48 h later by treatment with 0.5 μg/mL puromycin (Sigma). The pQCXIP vector ensures that cells resistant to puromycin maintain expression of the PPARγ protein which is cloned upstream of an IRES-puromycin resistance cassette, eliminating the need for clonal selection of stable transfectants.
2.8. Flank Xenograft and Orthotopic Tumor Models
Athymic nude mice were purchased from National Cancer Institute (NCI—NCr-nu/nu 01B74). All mice were male, 6-7 weeks old and weighing 15–30 grams. Mice were handled in accordance with the approval of the UCDHSC Animal Care and Use Committee. HTh74 cells, PPARγ shRNA knockdown and scrambled controls, were grown in RPMI media supplemented with 5% FBS and suspended at 5 × 10⁶ cells/200 μL sterile PBS. Mice were separated into groups of 12 for shRNA and 12 for scrambled controls and after they were anesthetized with an intraperitoneal injection of Avertin (0.5–0.7 cc of 32 mg/mL), 5 × 10⁶ tumor cells (200 μL) were injected subcutaneously on the right flank of each mouse and 5 × 10⁵ cells (20 μL) were introduced directly into the right thyroid lobe of the same mouse, using a Hamilton syringe aided by microscopic visualization; a location that better approximates the characteristics of human thyroid cancer. Mice were observed twice per week and flank tumors were monitored with electronic calipers. Postmortem-excised tumor volume, from both the flank and the thyroid, was estimated using the formula: tumor (length × width × height)/0.5236.
2.9. Invasion Assays
Following serum starvation overnight in medium containing 0.1% FBS, 2 × 10⁵ shPPARγ or scrambled HTh74 cells or 105 BCPAP cells transduced with PPARγ or empty vector were plated in the upper chambers of Matrigel-coated transwell chambers (24-well, 8 μM pore size; BD Biosciences) in 0.35 mL of RPMI medium supplemented with 0.1% FBS. Cells were allowed to invade toward 1 mL of RPMI containing 10% FBS added to the lower chamber for 24 h (BCPAP) or 48 h (HTh74). Noninvading cells on the top chamber were removed by scraping with a cotton swab, and invading cells on the lower surface were fixed with 100% methanol and stained with 3 μg/mL 4′,6-diamidino-2-phenylindole (DAPI; Invitrogen). Invasive capacity of the cells was quantitated by counting DAPI-stained nuclei in five microscopic fields under 10x magnification using Metamorph software attached to a Nikon microscope.
3. Results
3.1. PPARγ Activity and Expression in Authenticated Thyroid Cancer Cells: ATC Cells Overexpress PPARγ
Once our group identified unique differentiated and undifferentiated thyroid cancer cell lines [16], we reexamined the growth effects of the TZD, rosiglitazone on nine authenticated thyroid cancer cell lines (four derived from differentiated and five from undifferentiated cancers). Figure 1 shows that there was a significant, but modest, inhibition of growth with TZD in five of the cell lines, whereas four cell lines were completely resistant to high-dose TZD. Four of the five cell lines required a very high concentration (10 μM) to elicit an inhibitory effect.
Figure 1.

Effect of a PPARγ agonist on in vitro growth of thyroid cancer cell lines. Cells (denoted on the x-axis) were treated with vehicle (DMSO), or Rosi (1 μM or 10 μM) every 3 days for 6 days. The effect of treatment on proliferation was determined by automated viable cell counting. Data is represented as percent viable cells/mL compared to vehicle, which is denoted by the dashed line. Mean ± S.E.M. of at least 3 independent experiments performed in duplicate is reported (*, P < 0.05 when compared to vehicle control).
To determine if growth inhibition by a PPARγ agonist correlated with receptor expression, western blot analysis was performed on the thyroid cancer cell lines (Figure 2(a)). The specificity of antibodies raised against PPARγ is quite variable, and we have tested many different antibodies most of which cross-react with PPARδ, leading to confusing results in many studies. We therefore developed robust controls by overexpressing each receptor isoform (α, γ, and δ) in 293 cells which lack PPAR expression. Using specific antibodies (Santa Cruz, sc-1796), we have demonstrated that PPARα and PPARδ are expressed at high levels in these engineered cells, which makes these important controls for our studies. Western blot analysis of the nine thyroid cancer cell lines showed that this antibody specifically recognizes PPARγ but also detects a nonspecific band migrating just below PPARγ in all cells (Figure 2(a)). We found that only three of five cell lines expressing high PPARγ protein levels demonstrated any growth inhibition with TZD treatment (T238, Hth74, and Cal62). Surprisingly, two of the four cell lines responsive to agonist treatment (FTC-133 and TPC1) lacked detectable PPARγ even after prolonged exposure, indicating that growth inhibition by agonist did not correlate with receptor expression. The most striking finding was the correlation of PPARγ levels with the cancer origin (DTC versus ATC). The undifferentiated thyroid cancer cells all had clearly detectable PPARγ, while the differentiated thyroid cancer cells lacked protein expression of this nuclear receptor even after increased exposure time of the blot (Figure 2(a)). We also measured the PPARγ mRNA levels in the nine cell lines by qRT-PCR (Figure 2(b)). Although the mRNA levels somewhat correlate with the PPARγ protein levels, two DTC cells (FTC and TPC-1), both of which were responsive to agonist treatment (Figure 1), exhibited significant PPARγ mRNA levels approaching a third to a half of that seen in the ATC cells. However, their PPARγ protein levels were still undetectable despite prolonged exposure of the western blot (Figure 2(a)), suggesting that protein levels below the level of detection of our western assay are sufficient to elicit a response to agonist.
Figure 2.

Protein and mRNA levels of PPARγ in thyroid cancer cells. (a) 60 μg of nuclear extract protein from various papillary and anaplastic thyroid cancer cells and 293 cells overexpressing PPARα, γ, or δ was separated on a 10% SDS-PAGE gel and transferred to a PVD membrane.The blot was blocked with 10% nonfat milk and incubated overnight with PPARγ rabbit polyclonal ab (sc-7196, Santa Cruz, CA) at a dilution of 1 : 500. Secondary antibodies were anti-rabbit IgG conjugated to horseradish peroxidase (GE Healthcare UK) at a 1 : 1000 dilution. PARP was quantitated as a loading control. (b) 200 ng of total RNA from the same thyroid cancer cells was subjected to qRT-PCR using an ABI PRISM7700 and the PPARγ-specific oligos and probe described in Section 2.5. PPARγ mRNA levels are shown per ng of 18 s rRNA.
3.2. Depletion of PPARγ in ATC Cells Diminishes the Agonist Response, Reduces Cell Proliferation, and Arrests the Cell Cycle as a Result of Changes in Expression of Specific Cell Cycle Factors
In order to determine the contribution of PPARγ to TZD response and also to examine its role in ATC versus DTC cells, we designed an shRNA strategy to knock down PPARγ levels in agonist responsive HTh74 cells where it is highly expressed. Western blot analysis demonstrated complete loss of PPARγ protein using a PPARγ-specific shRNA when compared with scrambled shRNA control in three independent viral transductions (Figure 3(a)). We confirmed decreased mRNA by qRT-PCR verifying that loss of expression was also occurring at the mRNA level (Figure 3(a)). Figure 3(b) demonstrates that depletion of PPARγ in HTh74 ATC cells blunted, but did not completely abrogate, the modest suppression of growth by 10 μM Rosi, suggesting that a high concentration of agonist has both receptor-dependent as well as receptor-independent effects on growth. Surprisingly, knockdown of PPARγ alone significantly decreased growth of the ATC cells, when compared with scrambled control cells (Figure 4(a)). Flow cytometry analysis showed that this reduced growth rate could be accounted for by a modest but significant cell cycle arrest (G1 occupancy increased, S-phase and G2 /M decreased) (Figure 4(b)). A delayed G1-to-S transition is usually accompanied by a reduction in the phosphorylation state of retinoblastoma (Rb) protein which is indeed what we observed (Figure 4(c)).
Figure 3.

PPARγ shRNA decreases PPARγ mRNA and protein levels and partially abrogates growth inhibition by Rosi. (a) 40 μg of nuclear extract protein from HTh74 cells transduced with either scrambled or PPARγ-specific shRNA (3 independent transductions) was separated on a 10% SDS-PAGE gel, transferred to PVD, and probed with PPARγ antibodies (sc-7196) as described in Figure 2(a). The blot was stripped and reprobed with antibodies to PPARδ (sc-7197). PARP was quantitated as a loading control. Shown above the protein blot are PPARγ RNA levels measured by qRT-PCR as in Figure 2(b). (b) Viable HTh74 cells either untransduced or transduced with scrambled (scr) or PPARγ shRNA were counted after 3 days treatment with 1 μM (white bars) and 10 μM Rosi (black bars). The DMSO vehicle represented by the dotted line is set to 100%. Shown is the % of vehicle control for each cell type (average of 3 different expts. ± SEM. *: significantly lower than vehicle, P < 0.05; **: significantly lower than vehicle but higher than scr (10 μM), P < 0.05).
Figure 4.
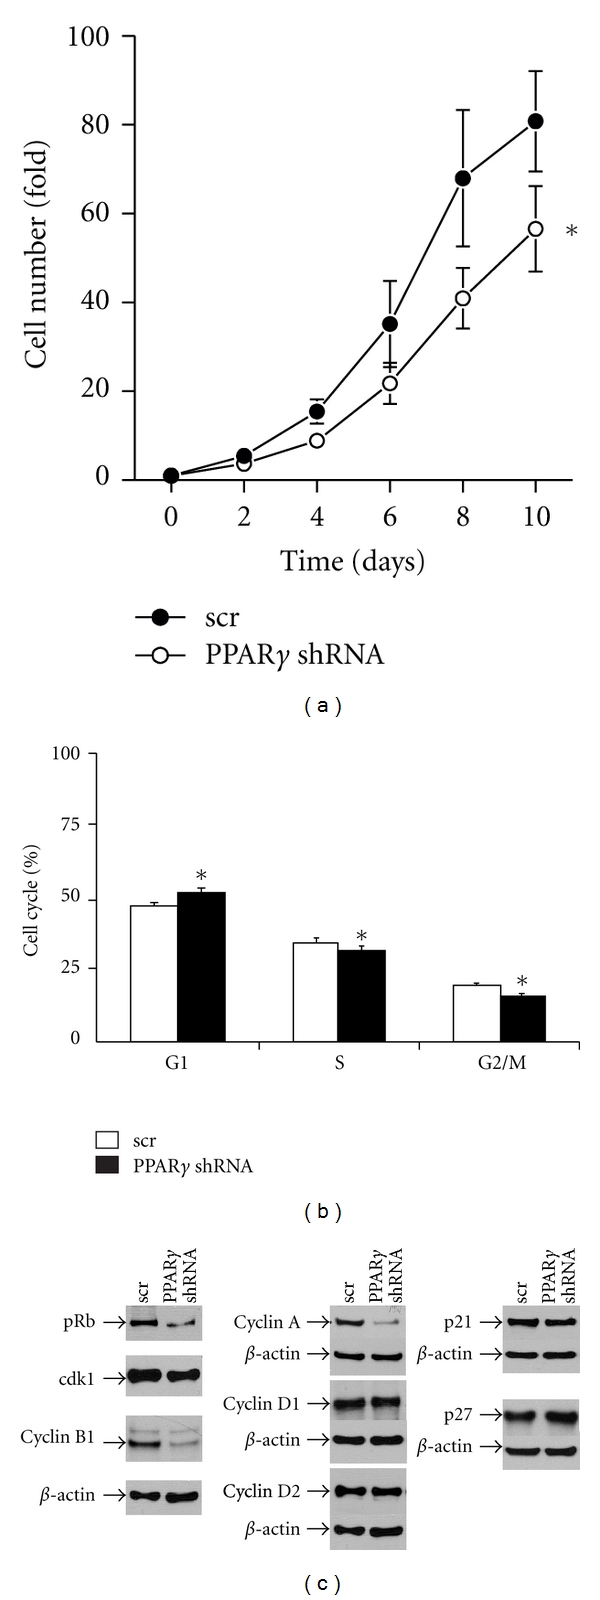
Effect of PPARγ knockdown on the growth characteristics of HTh74 cells. (a) Cell growth rate was assessed by counting viable cells transduced with scrambled (scr) or PPARγ shRNA at 2-day intervals. Data is represented as fold cell number over day 0 (6 expts. ± SEM, *, P = 0.04, 2-way ANOVA calculated over the entire growth curve). (b) scr-(white bars) and PPARγ shRNA-(black bars) transduced HTh74 cells were growth arrested in 0.5% FBS for 24 h and analyzed by flow cytometry 24 h following subsequent growth in 5% FBS. Flow data (3 expts.) was quantitated for % of cells in G1, S, and G2/M phases as shown (*, G1- P < 0.001; S, P = 0.04; G2/M, P < 0.001: paired t-test). (c) 50 μg of total cellular protein from HTh74 cells transduced with either scrambled or PPARγ-specific shRNA was separated on a 10% SDS-PAGE gel, transferred to PVD, and probed with antibodies against the corresponding cell cycle protein whose source is described in Section 2.4 followed by the appropriate secondary antibody. β-actin was quantitated as a loading control.
To determine if the change in phosphorylation state of Rb was a result of changes in kinases, activating cyclins or inhibitors involved in its activation/deactivation, we examined the levels of several relevant cell cycle components by western blotting (Figure 4(c)). Surprisingly, instead of seeing changes in the cyclin D family, which classically activates Rb phosphorylation and G1-to-S transition, we found decreases in cyclin A, which plays a role in S-phase maintenance, and cyclin-dependent kinase 1 (cdk1) and its activating cyclin (B1) which are both associated with G2 /M function. Two previous reports using thyroid cancer cells showed that the cell cycle inhibitors p21 and p27 were increased by agonist activation or overexpression of PPARγ [12, 21]. Figure 4(c) shows that both p21 and p27 levels were unaffected by PPARγ knockdown in HTh74 ATC cells.
3.3. PPARγ Knockdown Results in Decreased Growth of Flank and Orthotopic Xenograft Thyroid Gland ATC Tumors
We next examined the effect of PPARγ depletion on in vivo tumor growth in both flank and orthotopic xenograft mouse models. Figure 5(a) shows that the PPARγ-depleted flank tumors were significantly smaller compared with scrambled controls (7.3 ± 3.7 mm3 versus 21.4 ± 4.7 mm3, P = 0.023, two-tailed t-test). Injecting tumor cells orthotopically directly into the thyroid represents an in vivo site that more closely mimics thyroid cancer in the native environment. Figure 5(b) shows that PPARγ-depleted ATC tumors were also significantly smaller than scrambled controls in this orthotopic model (12.2 ± 5.4 mm3 versus 47.2 ± 11.2 mm3, P = 0.049, two-tailed t-test). Interestingly the eventual size of the orthotopic thyroid tumors was twice that of those grown on the flanks despite being injected with 10-fold fewer cells, suggesting this is a more favorable growth environment for these thyroid cancer cells.
Figure 5.

PPARγ knockdown attenuates both flank and thyroid orthotopic tumor growth of HTh74 anaplastic cancer cells. (a) 5 × 10⁶ HTh74 cells stably expressing a scrambled (scr) control (n = 8) or PPARγ shRNA (n = 10) were injected sc into the right flank of an athymic nude mouse. Tumors were monitored visually and harvested after 8 weeks and measured in 3 dimensions with calipers. Final tumor volume was calculated with the following equation: volume (mm3) = L ∗ W ∗ D ∗ 0.523. Mean ± SEM is reported (*, P = 0.023, two-tailed t-test). (b) 0.5 × 10⁶ HTh74 cells stably expressing a scrambled (scr) control (n = 9) or PPARγ shRNA (n = 8) were injected into the right thyroid lobe of an athymic nude mouse. Tumors were excised after 8 weeks and measured with calipers as before. The mean tumor volume ± SEM is reported (*, P = 0.049, two-tailed t-test).
3.4. Overexpression of PPARγ in DTC Cells Increases Cell Growth and the Levels of Specific Cyclins
Having shown that depletion of PPARγ in ATC cells resulted in decreased growth both in vitro and in vivo, we next examined the effect of overexpressing this nuclear receptor in DTC cells. Figure 6(a) shows successful overexpression of PPARγ in the pQCXIP-PPARγ-transduced BCPAP cells compared with empty vector control. Figure 6(b) demonstrates a 2-fold increased growth rate in these PPARγ-overexpressing DTC cells. PPARγ overexpression resulted in increased pRb as well as cyclin A and B1 levels whereas cyclin D1, p21, and p27 were again unchanged (Figure 6(c)).
Figure 6.

Effect of PPARγ overexpression on the growth characteristics of BCPAP cells. (a) 40 μg of nuclear extract protein from BCPAP cells transfected with either pQCXIP (empty) or pQCXIP-expressing PPARγ was separated on a 10% SDS-PAGE gel, transferred to PVD, probed with PPARγ antibodies (sc-7196), and reprobed with PARP as described in Figure 2(a). (b) Cell growth rate was assessed by counting viable BCPAP cells transfected with pQCXIP (empty) or pQCXIP-expressing PPARγ at 2-day intervals. Data is represented as fold cell number over day 0 (5 expts. ± SEM; *, P < 0.001 at day 6, P < 0.0001 at day 8 by 2-way ANOVA). (c) 50 μg of total cellular protein from BCPAP cells transfected with pQCXIP (empty) or pQCXIP-expressing PPARγ was separated on a 10% SDS-PAGE gel, transferred to PVD, and probed with antibodies against the corresponding cell cycle protein followed by the appropriate secondary antibody as described in Figure 4. β-actin was quantitated as a loading control.
3.5. PPARγ Expression Is Associated with Invasion of Thyroid Cancer Cells
Invasion is a tumor feature associated with aggressive behavior [22]. To determine if PPARγ plays a role in the invasive capacity of thyroid cancer cells, we depleted ATC cells of PPARγ and compared this with its overexpression in DTC cells. Figure 7(a) shows that the invasive capacity of HTh74 ATC cells was inhibited by 40% (60% ± 0.05%, P = 0.0015) by depleting PPARγ. In contrast, Figure 7(b) shows that BCPAP DTC cells overexpressing PPARγ exhibited a 25% increase in invasive capacity (125.5% ± 0.08%, P = 0.013) compared with empty vector controls. A representative DAPI-stained field for each experimental situation is shown below the corresponding graph.
Figure 7.

Effect of PPARγ knockdown or overexpression on invasion. (a) HTh74 cells transduced with either scrambled (scr) or PPARγ-specific shRNA were serum starved (0.1% FBS) for 24 h. Cells (2 × 10⁵) were transferred to a Boyden chamber and allowed to invade for 24 h toward medium containing 10% FBS. Cells on the bottom membrane were then stained with DAPI and counted using Metamorph Imaging Software (a representative DAPI-stained field is shown below the graph). Results shown are % inhibition of invading cells per field ± SEM (*, P = 0.0015, n = 4). (b) Empty vector or PPARγ-overexpressing BCPAP cells were subjected to invasion assays as described in (a) (*, P = 0.013, n = 3).
4. Discussion
In this report, we show that PPARγ protein expression is associated with thyroid cancer type (ATC versus DTC) and not with response to agonist treatment. Abundant expression was found in cells derived from more advanced ATC and was virtually absent in cells from more differentiated TC. Thus PPARγ appears to be a marker for tumor aggressiveness and may play a role in the transition from differentiated (good prognosis) to undifferentiated (very poor prognosis) thyroid cancer. On the other hand, this may simply be an association. Studies of primary thyroid tissue using immunohistochemical analyses generally show low levels of PPARγ in normal thyroid tissue and DTC, suggesting a limited role for this receptor in normal thyroid biology and differentiated cancer function [23–25]. In one of the studies [24], 64% of undifferentiated thyroid cancers had a moderate or high expression of PPARγ whereas only 31% of DTC exhibited any PPARγ expression, lending an important tissue correlation with our cell line data. Two earlier reports which examined PPARγ expression in different thyroid cancer cell lines [11, 12] need to be interpreted with caution as the cell lines used differed from those described here and in fact were shown later to be either redundant or not of thyroid origin [16]. However, another study corroborated our finding of higher PPARγ levels in ATC versus PTC [26], but these cell lines have not been validated by STR profiling [16].
In this paper, we have demonstrated that knocking down PPARγ in the ATC cell line HTh74 not only inhibited in vitro cell growth, but also reduced in vivo tumor growth in flank and orthotopic xenografts. At least two previous studies utilized an shRNA strategy to knock down PPARγ in thyroid cancer cells. In the first, the investigators did not report what effect PPARγ depletion had on growth only that it reduced the growth inhibitory response to TZD [14]. The second study which included 3 ATC-derived cells [21] demonstrated that knockdown of PPARγ resulted in loss of response to a non-TZD PPARγ agonist and, although not referred to in the text, revealed a 20% decrease in cell growth by depletion of PPARγ alone, which is confirmed by our studies in this report.
A decrease in growth as a result of PPARγ knockdown is somewhat unexpected, given the accumulated data from numerous studies, mainly with PPARγ agonists, that would characterize PPARγ as a tumor suppressor that mediates many antitumorigenic activities such as induction of differentiation, promotion of cell cycle arrest, antiangiogenic effects, and induction of apoptosis [15]. This has been further supported by studies where PPARγ insufficiency leads to an increased incidence of tumors in the liver [27], intestine [28], and even the thyroid [29]. However, there are several studies which would support a role for PPARγ as a tumor promoter, as our data would suggest, especially in vivo. Transgenic mice that express a constitutively active PPARγ give rise to greatly exacerbated mammary gland tumor development [30], which supported earlier data that PPARγ agonists may promote tumorigenesis in colon epithelium [8]. Furthermore, a recent report by Reddi et al. [31] demonstrated that forced expression of the PAX8-PPARγ fusion protein, a putative dominant-negative form of PPARγ, in a DTC-derived thyroid cancer cell line (WRO), caused a striking 5-fold reduction in tumor progression in a mouse xenograft model.
Having shown that PPARγ expression levels are higher in ATC cells versus DTC cells and that knocking it down in an ATC cell reduced its growth both in culture and in two in vivo xenograft models, we went on to demonstrate that overexpression of PPARγ in a DTC cell line (BCPAP), that lacks detectable PPARγ protein, results in increased cell growth in culture. These combined data would go against the supposed role of PPARγ as a tumor suppressor and suggest that high levels of PPARγ, in the apparent absence of any ligand, may be promoting cancer cell growth. Although to our knowledge no other investigators have done such a direct correlation between PPARγ levels and cell growth, or have manipulated PPARγ expression and assessed its effect on growth, there is evidence in the literature noted earlier that more aggressive tumors [24] or cells derived from such tumors [26] exhibit higher PPARγ levels.
To begin to understand the mechanism whereby PPARγ may be regulating cell growth, we examined cell cycle phase occupancy by flow cytometry and the levels of key cell cycle intermediates that are involved in transit through the cycle. We showed that growth inhibition of ATC cells as a direct consequence of PPARγ knockdown resulted in an increase in G1 phase and a decrease in the S and G2/M phases. This was accompanied by a reduction in phosphorylation of Rb and a concomitant decrease in the critical kinases (cdk1) cyclins (A and B1) but not the D-cyclins. Interestingly, the increase in growth by overexpressing PPARγ in PTC cells was correlated with a corresponding rise in phosphorylated Rb as well as cyclin A and B1 levels but not cyclin D1. Consistent with its role as a key cell cycle regulator, expression of cyclin A is found to be elevated in a variety of tumors [32]. Similarly, the G2/M checkpoint regulators, cdk1 and cyclin B1, have been shown to be expressed at higher levels in more advanced breast cancer lesions [33]. Furthermore, when we examined the levels of two cyclin-dependent kinase inhibitors, p21 and p27, which have been reported to be induced by PPARγ activation in other thyroid cancer cells [12, 21, 34, 35], they were unchanged when PPARγ levels were manipulated. Previous studies on the modulation of the cell cycle by PPARγ have revealed that G1 arrest imposed by PPARγ activation is bypassed in the absence of Rb [36] and is associated with changes in cyclins D3 and E as well as the inhibitor p27. Mechanisms for PPARγ control of the cell cycle involving upregulation of p18 and p21 during adipogenesis [37] or increased p27 but not p21 in pancreatic cancer [38] have also been reported.
Finally, our studies of PPARγ depletion and overexpression show that this receptor increases thyroid cancer cell invasion. In vitro invasion assays are used to gauge the migratory potential of a particular cancer cell and increased invasiveness usually signifies a more aggressive phenotype. Our data suggest that PPARγ may be directly contributing to increased invasive capacity. Previous studies have shown that PPARγ activators decrease the invasive capacity of other neoplastic cells. Liu et al. [39] showed that 25 μM rosiglitazone inhibits the invasive properties of human MDA-MB-231 breast cancer cells. More recently, Yang et al. [40] demonstrated that troglitazone (10–30 μM) inhibited migration and invasiveness of a human ovarian carcinoma ES-2 cells but that PPARγ knockdown by siRNA did not reverse this effect underscoring the idea that the PPARγ agonists may reduce cancer cell invasion by a receptor-independent mechanism. This was further supported by the finding that the PPARγ antagonist GW9662, either alone or in combination with troglitazone, does not affect glioma cell invasiveness in a Boyden chamber assay, suggesting that the effects observed are not mediated by PPARγ [41]. Taken together these data strongly suggest that PPARγ agonists inhibit cancer cell invasion through a PPARγ-independent pathway and that as our data suggests PPARγ itself could in fact be promoting invasive capacity.
In conclusion, our in vitro and in vivo studies show that PPARγ contributes to more aggressive thyroid cancer properties including faster growth rate and increased invasiveness. Therapies directed at PPARγ expression or a downstream target may lead to novel approaches to treat advanced thyroid cancer.
Acknowledgments
This work was supported by NIH/NCI Research Grant R01 CA100560 and the Mary Rossick Kern and Jerome H Kern Endowment for Endocrine Neoplasms Research. Flow cytometry and quantitative RT-PCR studies were performed by respective core facilities in the University of Colorado Cancer Center (P30 CA046934).
References
- 1.Willson TM, Brown PJ, Sternbach DD, Henke BR. The PPARs: from orphan receptors to drug discovery. Journal of Medicinal Chemistry. 2000;43(4):527–550. doi: 10.1021/jm990554g. [DOI] [PubMed] [Google Scholar]
- 2.Wahli W, Braissant O, Desvergne B. Peroxisome proliferator activated receptors: transcriptional regulators of adipogenesis, lipid metabolism and more. Chemistry and Biology. 1995;2(5):261–266. doi: 10.1016/1074-5521(95)90045-4. [DOI] [PubMed] [Google Scholar]
- 3.Grimaldi PA. The roles of PPARs in adipocyte differentiation. Progress in Lipid Research. 2001;40(4):269–281. doi: 10.1016/s0163-7827(01)00005-4. [DOI] [PubMed] [Google Scholar]
- 4.Tontonoz P, Singer S, Forman BM, et al. Terminal differentiation of human liposarcoma cells induced by ligands for peroxisome proliferator-activated receptor γ and the retinoid X receptor. Proceedings of the National Academy of Sciences of the United States of America. 1997;94(1):237–241. doi: 10.1073/pnas.94.1.237. [DOI] [PMC free article] [PubMed] [Google Scholar]
- 5.Sarraf P, Mueller E, Jones D, et al. Differentiation and reversal of malignant changes in colon cancer through PPARγ . Nature Medicine. 1998;4(9):1046–1052. doi: 10.1038/2030. [DOI] [PubMed] [Google Scholar]
- 6.Bren-Mattison Y, Van Putten V, Chan D, Winn R, Geraci MW, Nemenoff RA. Peroxisome proliferator-activated receptor-γ (PPARγ) inhibits tumorigenesis by reversing the undifferentiated phenotype of metastatic non-small-cell lung cancer cells (NSCLC) Oncogene. 2005;24(8):1412–1422. doi: 10.1038/sj.onc.1208333. [DOI] [PubMed] [Google Scholar]
- 7.Keshamouni VG, Reddy RC, Arenberg DA, et al. Peroxisome proliferator-activated receptor-γ activation inhibits tumor progression in non-small-cell lung cancer. Oncogene. 2004;23(1):100–108. doi: 10.1038/sj.onc.1206885. [DOI] [PubMed] [Google Scholar]
- 8.Seed B. PPARγ and colorectal carcinoma: conflicts in a nuclear family. Nature Medicine. 1998;4(9):1004–1005. doi: 10.1038/1990. [DOI] [PubMed] [Google Scholar]
- 9.Abe A, Kiriyama Y, Hirano M, et al. Troglitazone suppresses cell growth of KU812 cells independently of PPARγ . European Journal of Pharmacology. 2002;436(1-2):7–13. doi: 10.1016/s0014-2999(01)01577-1. [DOI] [PubMed] [Google Scholar]
- 10.Wei S, Yang J, Lee SL, Kulp SK, Chen CS. PPARγ-independent antitumor effects of thiazolidinediones. Cancer Letters. 2009;276(2):119–124. doi: 10.1016/j.canlet.2008.08.008. [DOI] [PMC free article] [PubMed] [Google Scholar]
- 11.Ohta K, Endo T, Haraguchi K, Hershman JM, Onaya T. Ligands for peroxisome proliferator-activated receptor γ inhibit growth and induce apoptosis of human papillary thyroid carcinoma cells. Journal of Clinical Endocrinology and Metabolism. 2001;86(5):2170–2177. doi: 10.1210/jcem.86.5.7493. [DOI] [PubMed] [Google Scholar]
- 12.Martelli ML, Iuliano R, Le Pera I, et al. Inhibitory effects of peroxisome proliferator-activated receptor γ on thyroid carcinoma cell growth. Journal of Clinical Endocrinology and Metabolism. 2002;87(10):4728–4735. doi: 10.1210/jc.2001-012054. [DOI] [PubMed] [Google Scholar]
- 13.Park JW, Zarnegar R, Kanauchi H, et al. Troglitazone, the peroxisome proliferator-activated receptor-γ agonist, induces antiproliferation and redifferentiation in human thyroid cancer cell lines. Thyroid. 2005;15(3):222–231. doi: 10.1089/thy.2005.15.222. [DOI] [PubMed] [Google Scholar]
- 14.Aiello A, Pandini G, Frasca F, et al. Peroxisomal proliferator-activated receptor-γ agonists induce partial reversion of epithelial-mesenchymal transition in anaplastic thyroid cancer cells. Endocrinology. 2006;147(9):4463–4475. doi: 10.1210/en.2005-1610. [DOI] [PubMed] [Google Scholar]
- 15.Copland JA, Marlow LA, Kurakata S, et al. Novel high-affinity PPARγ agonist alone and in combination with paclitaxel inhibits human anaplastic thyroid carcinoma tumor growth via p21WAF1/CIP1 . Oncogene. 2006;25(16):2304–2317. doi: 10.1038/sj.onc.1209267. [DOI] [PubMed] [Google Scholar]
- 16.Schweppe RE, Klopper JP, Korch C, et al. Deoxyribonucleic acid profiling analysis of 40 human thyroid cancer cell lines reveals cross-contamination resulting in cell line redundancy and misidentification. Journal of Clinical Endocrinology and Metabolism. 2008;93(11):4331–4341. doi: 10.1210/jc.2008-1102. [DOI] [PMC free article] [PubMed] [Google Scholar]
- 17.Klopper JP, Sharma V, Berenz A, et al. Retinoid and thiazolidinedione therapies in melanoma: an analysis of differential response based on nuclear hormone receptor expression. Molecular Cancer. 2009;8, article 16 doi: 10.1186/1476-4598-8-16. [DOI] [PMC free article] [PubMed] [Google Scholar]
- 18.Klopper JP, Berenz A, Hays WR, et al. In vivo and microarray analysis of rexinoid-responsive anaplastic thyroid carcinoma. Clinical Cancer Research. 2008;14(2):589–596. doi: 10.1158/1078-0432.CCR-07-0269. [DOI] [PubMed] [Google Scholar]
- 19.Kebebew E, Peng M, Reiff E, et al. A phase II trial of rosiglitazone in patients with thyroglobulin-positive and radioiodine-negative differentiated thyroid cancer. Surgery. 2006;140(6):960–966. doi: 10.1016/j.surg.2006.07.038. [DOI] [PubMed] [Google Scholar]
- 20.Philips JC, Petite C, Willi JP, Buchegger F, Meier CA. Effect of peroxisome proliferator-activated receptor γ agonist, rosiglitazone, on dedifferentiated thyroid cancers. Nuclear Medicine Communications. 2004;25(12):1183–1186. doi: 10.1097/00006231-200412000-00005. [DOI] [PubMed] [Google Scholar]
- 21.Marlow LA, Reynolds LA, Cleland AS, et al. Reactivation of suppressed RhoB is a critical step for the inhibition of anaplastic thyroid cancer growth. Cancer Research. 2009;69(4):1536–1544. doi: 10.1158/0008-5472.CAN-08-3718. [DOI] [PMC free article] [PubMed] [Google Scholar]
- 22.Ain KB. Management of undifferentiated thyroid cancer. Baillieres Best Practice and Research: Clinical Endocrinology and Metabolism. 2000;14(4):615–629. doi: 10.1053/beem.2000.0106. [DOI] [PubMed] [Google Scholar]
- 23.Nikiforova MN, Biddinger PW, Caudill CM, Kroll TG, Nikiforov YE. PAX8-PPARγ rearrangement in thyroid tumors: RT-PCR and immunohistochemical analyses. The American Journal of Surgical Pathology. 2002;26(8):1016–1023. doi: 10.1097/00000478-200208000-00006. [DOI] [PubMed] [Google Scholar]
- 24.Aldred MA, Morrison C, Gimm O, et al. Peroxisome proliferator-activated receptor gamma is frequently downregulated in a diversity of sporadic nonmedullary thyroid carcinomas. Oncogene. 2003;22(22):3412–3416. doi: 10.1038/sj.onc.1206400. [DOI] [PubMed] [Google Scholar]
- 25.Karger S, Berger K, Eszlinger M, et al. Evaluation of peroxisome proliferator-activated receptor-γ expression in benign and malignant thyroid pathologies. Thyroid. 2005;15(9):997–1003. doi: 10.1089/thy.2005.15.997. [DOI] [PubMed] [Google Scholar]
- 26.Hayashi N, Nakamori S, Hiraoka N, et al. Antitumor effects of peroxisome proliferator activate receptor gamma ligands on anaplastic thyroid carcinoma. International Journal of Oncology. 2004;24(1):89–95. [PubMed] [Google Scholar]
- 27.Yu J, Shen B, Chu ESH, et al. Inhibitory role of peroxisome proliferator-activated receptor gamma in hepatocarcinogenesis in mice and in vitro . Hepatology. 2010;51(6):2008–2019. doi: 10.1002/hep.23550. [DOI] [PubMed] [Google Scholar]
- 28.McAlpine CA, Barak Y, Matise I, Cormier RT. Intestinal-specific PPARγ deficiency enhances tumorigenesis in ApcMin/+ mice. International Journal of Cancer. 2006;119(10):2339–2346. doi: 10.1002/ijc.22115. [DOI] [PubMed] [Google Scholar]
- 29.Kato Y, Ying H, Zhao L, et al. PPARγ insufficiency promotes follicular thyroid carcinogenesis via activation of the nuclear factor-κB signaling pathway. Oncogene. 2006;25(19):2736–2747. doi: 10.1038/sj.onc.1209299. [DOI] [PubMed] [Google Scholar]
- 30.Saez E, Rosenfeld J, Livolsi A, et al. PPARγ signaling exacerbates mammary gland tumor development. Genes and Development. 2004;18(5):528–540. doi: 10.1101/gad.1167804. [DOI] [PMC free article] [PubMed] [Google Scholar]
- 31.Reddi HV, Madde P, Milosevic D, et al. The putative PAX8/PPARγ fusion oncoprotein exhibits partial tumor suppressor activity through Up-regulation of Micro-RNA-122 and dominant-negative PPARγ activity. Genes & Cancer. 2011;2(1):46–55. doi: 10.1177/1947601911405045. [DOI] [PMC free article] [PubMed] [Google Scholar]
- 32.Yam CH, Fung TK, Poon RYC. Cyclin A in cell cycle control and cancer. Cellular and Molecular Life Sciences. 2002;59(8):1317–1326. doi: 10.1007/s00018-002-8510-y. [DOI] [PMC free article] [PubMed] [Google Scholar]
- 33.Kawamoto H, Koizumi H, Uchikoshi T. Expression of the G2-M checkpoint regulators cyclin B1 and cdc2 in nonmalignant and malignant human breast lesions: immunocytochemical and quantitative image analyses. The American Journal of Pathology. 1997;150(1):15–23. [PMC free article] [PubMed] [Google Scholar]
- 34.Chung SH, Onoda N, Ishikawa T, et al. Peroxisome proliferator-activated receptor gamma activation induces cell cycle arrest via the p53-independent pathway in human anaplastic thyroid cancer cells. Japanese Journal of Cancer Research. 2002;93(12):1358–1365. doi: 10.1111/j.1349-7006.2002.tb01245.x. [DOI] [PMC free article] [PubMed] [Google Scholar]
- 35.Bonofiglio D, Qi H, Gabriele S, et al. Peroxisome proliterator-activated receptor γ inhibits follicular and anaplastic thyroid carcinoma cells growth by upregulating p21Cip1/WAF1 gene in a Sp1-dependent manner. Endocrine-Related Cancer. 2008;15(2):545–557. doi: 10.1677/ERC-07-0272. [DOI] [PubMed] [Google Scholar]
- 36.Fajas L, Egler V, Reiter R, Miard S, Lefebvre AM, Auwerx J. PPARγ controls cell proliferation and apoptosis in an RB-dependent manner. Oncogene. 2003;22(27):4186–4193. doi: 10.1038/sj.onc.1206530. [DOI] [PubMed] [Google Scholar]
- 37.Morrison RF, Farmer SR. Role of PPARγ in regulating a cascade expression of cyclin-dependent kinase inhibitors, p18INK4c and p21Waf1/Cip1, during adipogenesis. Journal of Biological Chemistry. 1999;274(24):17088–17097. doi: 10.1074/jbc.274.24.17088. [DOI] [PubMed] [Google Scholar]
- 38.Itami A, Watanabe G, Shimada Y, et al. Ligands for peroxisome proliferator-activated receptor γ inhibit growth of pancreatic cancers both in vitro and in vivo . International Journal of Cancer. 2001;94(3):370–376. doi: 10.1002/ijc.1488. [DOI] [PubMed] [Google Scholar]
- 39.Liu H, Zang C, Fenner MH, Possinger K, Elstner E. PPARγ ligands and ATRA inhibit the invasion of human breast cancer cells in vitro . Breast Cancer Research and Treatment. 2003;79(1):63–74. doi: 10.1023/a:1023366117157. [DOI] [PubMed] [Google Scholar]
- 40.Yang YC, Ho TC, Chen SL, Lai HY, Wu JW, Tsao YP. Inhibition of cell motility by troglitazone in human ovarian carcinoma cell line. BMC Cancer. 2007;7, article 216 doi: 10.1186/1471-2407-7-216. [DOI] [PMC free article] [PubMed] [Google Scholar]
- 41.Coras R, Hölsken A, Seufert S, et al. The peroxisome proliferator-activated receptor-γ agonist troglitazone inhibits transforming growth factor-β-mediated glioma cell migration and brain invasion. Molecular Cancer Therapeutics. 2007;6(6):1745–1754. doi: 10.1158/1535-7163.MCT-06-0763. [DOI] [PubMed] [Google Scholar]