Abstract
Kinetic solubility measurements using prototypical assay buffer conditions are presented for a ~58,000 member library of small molecules. Analyses of the data based upon physical and calculated properties of each individual molecule were performed and resulting trends were considered in the context of commonly held opinions of how physicochemical properties influence aqueous solubility. We further analyze the data using a decision tree model for solubility prediction and via a multi-dimensional assessment of physicochemical relationships to solubility in the context of specific ‘rule-breakers’ relative to common dogma. The role of solubility as a determinant of assay outcome is also considered based upon each compound’s cross-assay activity score for a collection of publicly available screening results. Further, the role of solubility as a governing factor for colloidal aggregation formation within a specified assay setting is examined and considered as a possible cause of a high cross-assay activity score. The results of this solubility profile should aid chemists during library design and optimization efforts and represents a useful training set for computational solubility prediction.
1. Introduction
Aqueous solubility is a governing principle for how small molecules interact with biomolecules (proteins, nucleic acids, etc) and living systems (cells, tissues and whole organisms). A broader appreciation of aqueous solubility is changing how researchers pursue the drug discovery process from library design to screening to hit optimization. The physicochemical properties of small molecules intended for primary screening and lead development changed greatly as drug discovery approaches evolved in response to the advent of combinatorial chemistry and high-throughput screening (HTS).1–5 The synthesis and screening of hundreds of thousands of small molecules made it difficult and, to some, unnecessary to pay attention to the physicochemical principles of all library members and, as a result, screening hits became increasingly lipophilic in nature. A growing contingent of researchers began to consider the increasing difficulty in transforming screening hits into clinical candidates by asking fundamental questions about the differences between failed lead compounds and approved drugs. Numerous lessons resulted from these analyses including the set of parameters known as the rule of 5 first defined by Lipinski.6 In this analysis, Lipinski and coworkers scrutinized a set of >2000 orally bioavailable clinical agents for physical and calculated properties including molecular weight, H-bond donors, H-bond acceptors and cLogP. The results suggested that the 90th percentile of drug-like compounds with acceptable solubility and permeability possessed a MW under 500, fewer than 5 H-bond donors and 10 H-bond acceptors and a cLogP value less than 5. Subsequent guidelines have been set forth that include other physicochemical descriptors including compound flexibility and polar surface area.2
An additional consequence of the combichem-HTS revolution was the requirement for a carrier solvent for small molecules entering HTS assays. The kinetics of these assays required the rapid aqueous/buffer solvation of each library member and dimethyl sulfoxide (DMSO) was widely adopted as an appropriate solvent for the storage and dispensing of compound libraries into assay wells. This was a sharp departure from experiments that allow an agent to reach aqueous solubility equilibrium over time. The former version of solubility (referred to as kinetic solubility) is considered more appropriate for discovery settings while the latter (referred to as thermodynamic solubility) often takes precedent in formulation and dosing studies.7,8 The differences associated with kinetic and thermodynamic solubilites are often ignored in discovery settings.
Strategies for optimizing libraries for kinetic solubility have greatly aided both assay performance and the ability of screening leads to enter optimization efforts.9,10 Many of these strategies derive from a combination of chemist’s intuition and the critical analyses of existing data sets leading to predictive models of solubility. Unfortunately, the ability to gather true aqueous solubility values at a defined pH on large compound collections has been limited by the technologies and cost of acquiring such data and most data sets are restricted to related analogues being evaluated as part of an optimization effort. These data sets are often compromised due to inadequate structural diversity of the compounds, inconsistencies in methods and bias toward expected outcomes. Despite imperfect training sets, numerous computational tools (commercial and non-commercial) for solubility prediction exist to help during library design and optimization efforts.11–15 Solubility measurements from a large compound collection achieved via a common methodology would be useful in terms of validating current dogma and as a relevant training set for advanced computational models. In 2009, Clark and coworkers reported the kinetic solubilities from a drug-like collection of >700 compounds and provided an analysis of the results in terms of selected physical and calculated descriptors of the library members.16 In 2010, Hill and Young reported an analysis of kinetic solubility of a large compound library (~ 100K) and experimentally derived values of hydrophobicity (logDpH 7.4) for a subset of this library (~ 20K).17 This report provided enlightening lessons on the relationship between calculated and experimentally determined LogD/LogP values and also explored the impact that aromatic ring content had on solubility.
Here, we describe an exploratory analysis of kinetic solubility measurements for 57,857 compounds of the NIH Molecular Libraries Small Molecule Repository (MLSMR). We related the solubility of this library to specific compound physical characteristics and calculated properties. Further, we examine subsets of this data to help understand compounds that deviate from expected trends and specific ‘rule-breakers’ in order to better advise chemists hoping to optimize agents with undesirable physicochemical properties. We also examine the relationship between solubility and the frequency of reported activities from primary screens with a particular focus on agents that are putative aggregators within a reported β–lactamase screen.18 Importantly, the results from this study are publically available through the PubChem database to allow researchers access to this valuable data set (http://pubchem.ncbi.nlm.nih.gov/).
2. Method
Solubility measurements were accomplished from stock 10 mM DMSO solutions (6µL) dispensed into PBS buffer (294 uL, pH 7.4) via Chemiluminescent Nitrogen Detection (CLND).19 The equimolar nitrogen response of the detector was calibrated using TRIZMA base at 28 concentrations spanning the dynamic range of the instrument from 0.08 to 4500 µg/ml nitrogen and the measured solubility values were corrected for background nitrogen. On board performance indicating standards (Imipramine HCl, Sulfamethizole and Astemizole) were used to validate assay results. A detailed description of the CLND method is presented in the supplemental data section. The entire data set is deposited in the PubChem database (AID 1996). In PubChem, each compounds individual solubility is listed and the data is additionally organized to reflect low solubility (<10 µg/mL), medium solubility (10 µg/mL – 60 µg/mL) and high solubility (>60 µg/mL) with 3,060 structures being annotated as below the limit of quantification (<LOQ). We obtained the measured solubility data and associated chemical structures directly from Pubchem, using the export function (grouped by substance). The exported structures were cleaned in MOE (2008.10)(Chemical Computing Group) using the default settings for the Wash command and a set of constitutional and topological descriptors were evaluated. In addition we evaluated physicochemical descriptors (polar surface area, H-bond accecptor and donor counts, logP and logD) using ACDLabs PhysChem Batch (v12.01). Finally we also evaluated a number of custom descriptors that we describe in more detail in the following sections. All the cleaned structures, solubility data and descriptor data is available for download via the supplemental data section.
3. Results and Discussion
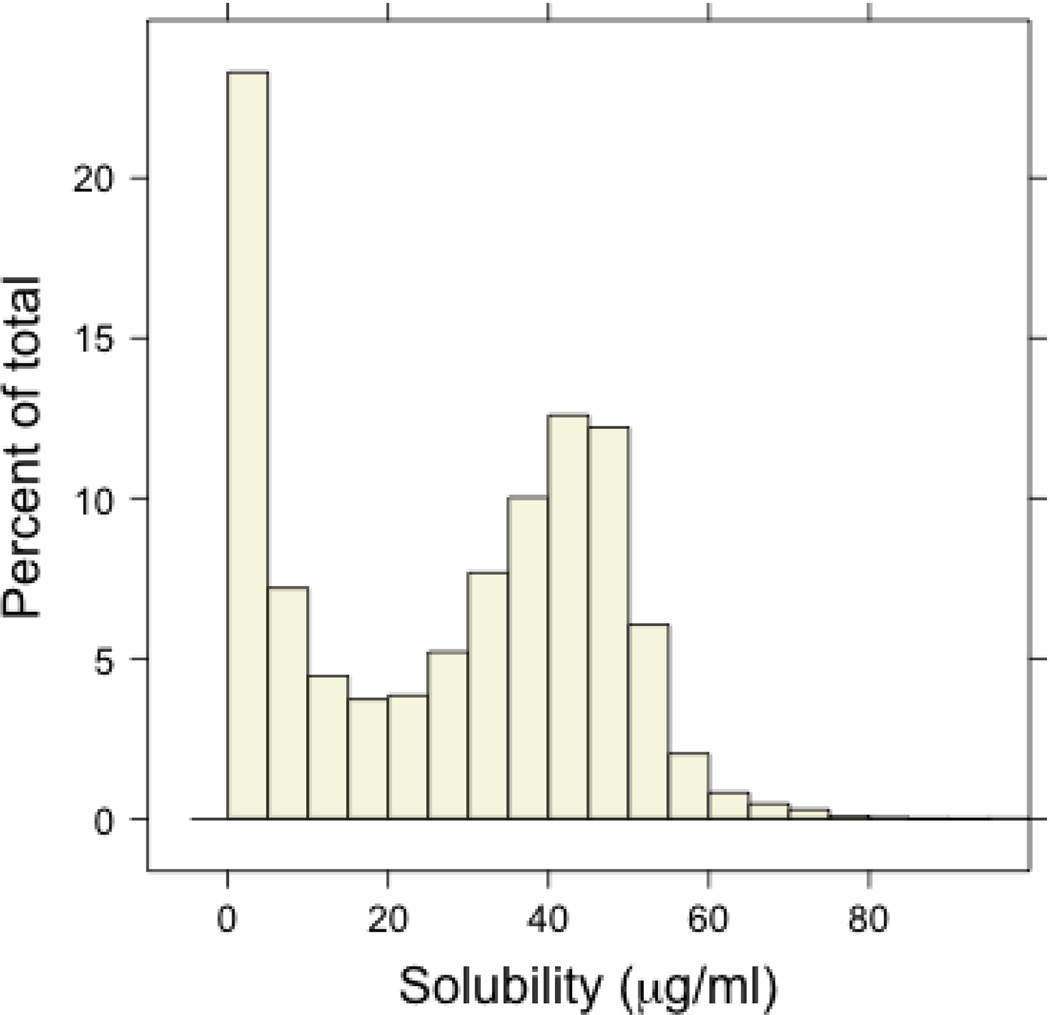
Figure 1 summarizes the distribution of measured solubility values and the breakdown of the dataset by the solubility classes ranging from <5 µg/mL, 5–10 µg/mL, 10–15 µg/mL, and so on [all data groupings are closed to the lower number (i.e. 5 µg/mL to the lowest value below 10 µg/mL)]. Based upon the PubChem definitions, the majority of compounds are moderately soluble (39,301 or 67.9%) followed by a large percentage of low soluble compounds (17,574 or 30.4%). The high soluble group constitutes just 1.7% of the entire dataset and only 75 compounds registered solubility greater than 75 µg/mL (Note: the upper confidence limit is affected by molecular weight and artifacts are common for highly soluble, low-molecular weight agents). To ascertain the diversity of the dataset, we considered the distribution of the compounds in a seven-dimensional physicochemical space, defined using molecular weight, LogP, fraction of rotatable bonds, H-bond donor and acceptor counts and the topological polar surface area (TPSA)[physical descriptors and calculated properties were determined using ACDLabs PhysChem Batch (v12.01) and the number of aromatic rings (our analysis considers fused aromatic rings as a single ring) using in-house code].20 The 7-D descriptor space was reduced to two dimensions using principal components analysis and a density plot of the two principal components is shown in the supplemental data section. The dataset is distributed in a relatively homogenous manner (i.e., no distinct clusters are visible) including moderate outliers at the ‘edges’ of the dataset. From this breakdown of the data it was clear that more focused analyses would be required to fully appreciate this data’s value.
Figure 1.
(A) Distribution of measured solubility values [outliers (solubilities > 100 µg/mL) are not shown in this analyses].
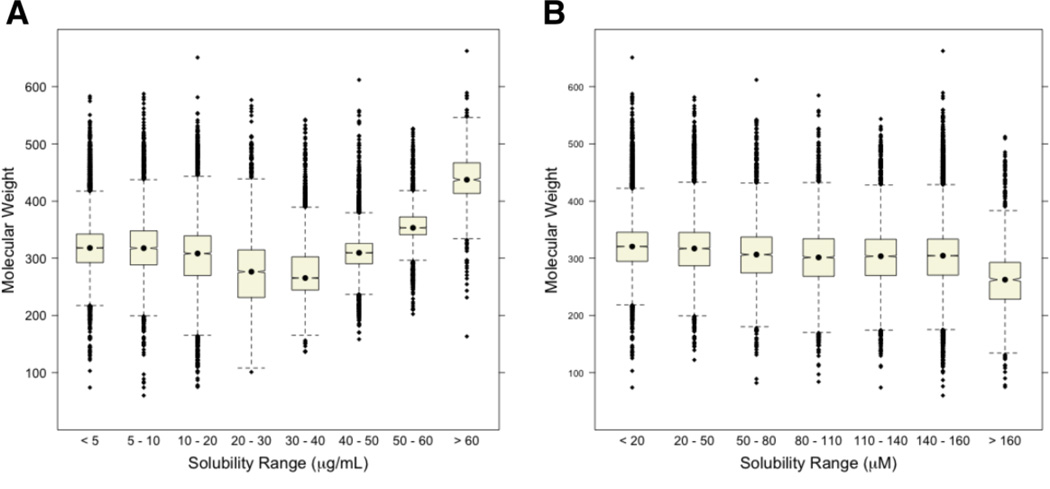
An important aspect of the data and the subsequent analysis is the use of µg/mL as the unit of solubility. An insightful review of our analysis highlighted that using µg/mL inserts a dependency on molecular weight (MW) into the solubility outcome. To mitigate this we converted the µg/mL values to µM and generated a fine-grained 8-class classification of these values. Overall, the analyses were not significantly different when changing between µg/mL and µM units. The relationship between solubility and MW was the unsurprising exception and a distribution of MW by solubility class as judged using µg/mL and µM provides insight into how units can influence solubility trends (Figure 2). Importantly, when utilizing µM units there is a modest increase in solubility associated with lower MW compounds. This dogmatic trend is, to a degree, reversed in the analysis that utilizes µg/mL units. All subsequent analyses are generated for both µg/mL and µM units (corresponding analyses are presented in the supplemental data section).
Figure 2.
(A) Distribution of MW by solubility class as judged in µg/mL units. (B) Distribution of MW by solubility class as judged in µM units. [To improve visualization we discarded outlying data points with molecular weight >800 daltons].
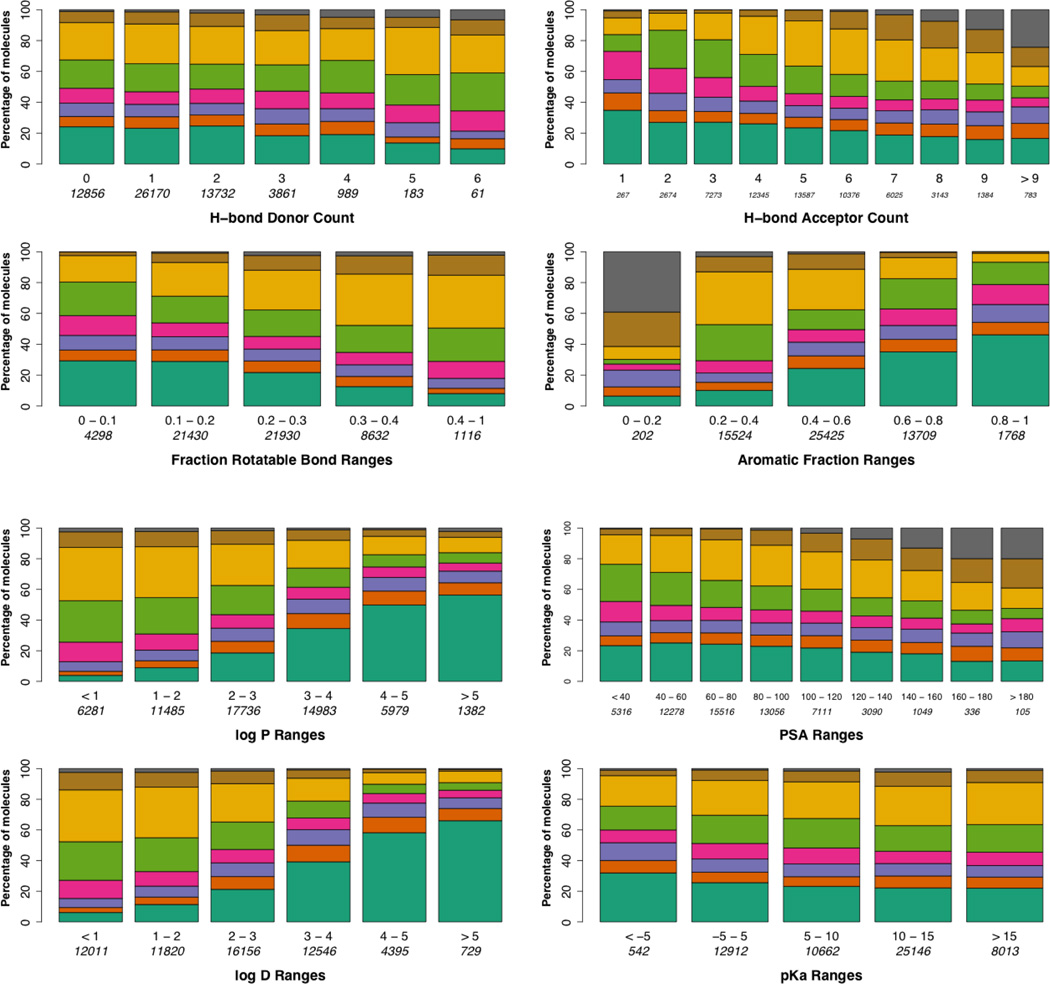
Analysis of solubility in terms of physical characteristics including H-bond donor count and H-bond acceptor count was accomplished using ACD Labs PhysChem Batch (v12.01) rule settings (for instance, a H-bond donor is described as the sum of OHs and NHs while H-bond acceptors are the number of Ns and Os). We also examined how solubility was influenced by the fraction of rotatable bonds and aromatic fraction which were calculated using MOE. The results of these analyses are shown in Figure 3. The general outcomes are consistent with current dogma on solubility trends; i.e. increasing # of H-bond donors and acceptors leads toward a higher fraction of soluble compounds, an increasing fraction of rotatable bonds increases the fraction of soluble compounds and a lower ratio of non-aromatic to aromatic carbons increases the fraction of soluble compounds. However, despite concurrence with accepted tenets, the data also highlights that within any one-dimensional assessment of the data a significant percentage of compounds with low solubility remains within the highest-value parameter bins. For instance, of the 3143 compounds with 8 H-bond acceptors 804 (25.5%) of them have solubilities less than 10 µg/mL. Examination of several commonly relied upon calculated properties, including LogP, LogD, PSA, and pKa, for their association with solubility trends are presented in Figure 3. [Note: ACD Labs software was utilized within these analyses. A comparison of ACD values with ChemDraw Ultra (10.0) is presented in the supplemental data section.] From these analyses the relationship between solubility and calculated LogP and LogD (not calculated cLogP or cLogD) values underscored the value of these descriptors in predicting aqueous solubility. The relationship between polar surface area (PSA) and solubility also tracked with presumed dogma whereby a general increase in the sum of polar atoms/polar fragments of a small molecule resulted in a trend toward higher solubility. The results linking the calculated pKa of an agent to its solubility were less obvious. It might be assumed that a pKa measurement at the extremes might be indicative of moieties with enough acidic or basic character to be deprotonated or protonated, respectively, leading to formal charges that would confer an increase in aqueous solubility. This is not reflected in the data and only a modest trend toward higher solubility as pKa values rise is found. It should be noted that, like the data with specific physical descriptors, there are significant percentages of highly-soluble and minimally-soluble compounds present in the ranges of specified calculated properties that are ultimately counterintuitive.
Figure 3.
Relationship of solubility ranges as related to specific physical descriptors and specific calculated descriptors. Below each column are the physical descriptor ranges and the number of compounds that fit that descriptor range. The key at the bottom maps the colors to the solubility ranges (specified in µg/mL)(a comparative analysis utilizing µM units is presented in the supplemental data section).
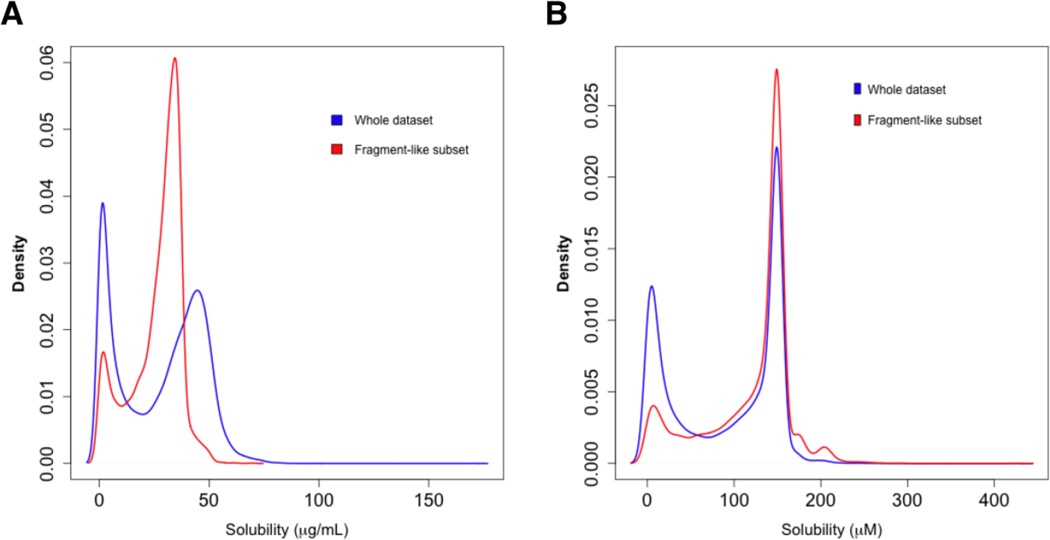
An additional analysis that this data set enabled was the investigation of solubility trends associated with compounds that fit the standard requirements for use within fragment-based screening efforts. A multitude of commercial vendors offer fragment libraries that satisfy so-named ‘rule of 2.5’ compliance by possessing MW < 250 daltons, < 3 H-bond donors and < 6 H-bond acceptors. Fortunately, nearly 10 % of the ~58,000 member library analyzed in this study satisfied this criteria and Figure 4 summarizes the distribution of the solubility values in both µg/mL and µM units (probability density estimates rather than frequencies were used to allow visual comparisons of the two data sets). This analysis demonstrates that fragment-like agents possessed a greater ratio of soluble agents as compared to the non-fragment allotment. This analysis further demonstrated the role that the units play in these analyses as the µM-based analysis realigned the solubility distributions for the two data sets.
Figure 4.
Probability density estimates of the solubility distribution of the subset of compounds satisfying the ‘Rule of 2.5’ in the context of the entire dataset based upon A) µg/mL units and B) µM units.
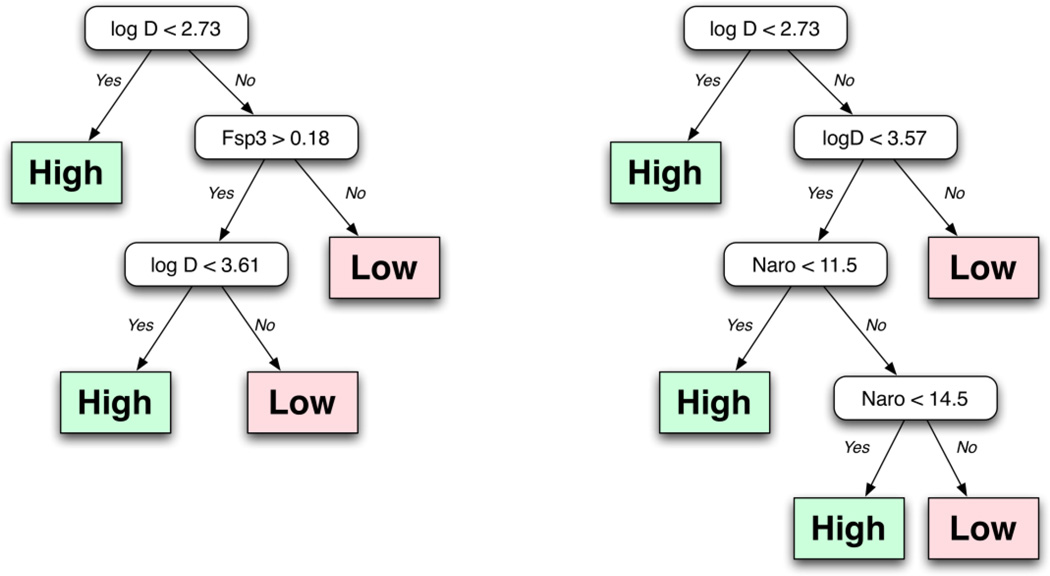
While confirming many of the established solubility trends associated with physical and calculated descriptors these analyses represent highly one-dimensional views of this data set. While a single factor like the number of H-bond donors or the calculated LogD will play a key role in a chemists belief that any given compound will be soluble in aqueous media it was important to consider these data more multi-dimensionally. Computational models of solubility provide these types of analyses. Recently, Cheng et al used this dataset to develop a binary classifier using a support vector machine.21 This model, like others, involves a relatively large number of structural descriptors and does not necessarily provide a simple rule of thumb that a bench chemist might use to judge solubility. Hill and Young applied a Solubility Forecast Index (SFI) to a similar dataset and found that a molecule with a combined LogD and aromatic fraction value less than 5 will likely possess acceptable aqueous solubility.17 Using the SFI within our dataset we found accurate classification of the medium and high soluble classes (83.0% and 84.9% respectively) while the performance declined for the low solubility class (55.6% correct classification). Motivated by the simplicity of this analysis we considered a variety of combinations of physical and calculated descriptors to obtain simple rules that could be used to guide solubility assessments. With the goal of identifying simple guidelines, we evaluated decision trees for 18,721 2-descriptor combinations from a pool of 194 topological and constitutional descriptors. While a variety of descriptor combinations (such as TPSA and LogP) correctly predicted the majority (> 90%) of the soluble class, they invariably predicted the bulk of the insoluble compounds as soluble as well. Given the overlapping distributions of many of these properties for the soluble and insoluble classes for this dataset, this observation is not unexpected. The best performing model that we obtained used a combination of LogD and the GCUT_SMR_0 descriptor (which characterizes the distribution of molar refractivity over the molecular structure). While this model exhibited good numerical properties (83% sensitivity and 53% specificity) the use of the GCUT_SMR_0 descriptor is neither intuitive nor easy to calculate. A number of more usable rule sets were found with only slightly poorer performance. Figure 5 displays the top two decision tree models based on a combination of numerical performance and simplicity. A combination of LogD and the fraction of sp3 carbons (Fsp3) exhibited a sensitivity of 87.3%, a false positive rate of 12.7% and a specificity of 50.1%. The second utilizes a combination of LogD and the number of aromatic atoms (Naro). This decision tree resulted in a model with a sensitivity of 88% and a specificity of 45%; however, this model performed poorly within the insoluble class. The best performing models, in general, made use of LogP or LogD followed by carbon hybridization. It is important to note that the rules summarized in Figure 5 were developed utilizing the ACD Labs implementation of LogD.
Figure 5.
The decision tree model to classify small molecules as having high or low aqueous solubility based on calculated LogP values and the ratio of sp3 hybridized carbons.
Among the most interesting aspects of this profile were the small molecule clusters that appear to be ‘rule-breakers’ in terms of their solubility measurements. For the purposes of this analyses, the ‘rules’ are associated to current dogma on solubility: 1) high solubility is associated with lower LogP/LogD values; 2) higher solubility is associated with increasing number of H.B.D and H.B.A.; 3) higher solubility is associated with lower A.F.; 4) higher solubility is associated with higher P.S.A. values). An analysis of these agents presented several fascinating findings (Table 1 and Table 2). Importantly, the differences associated with µg/mL (Table 1) versus µM (Table 2) values played a major role in this analysis. Foremost, when examining the role of MW in determining solubility using µg/mL values there is a trend that suggests an increase in solubility accompanies an increase in MW. This finding represents a major divergence from the accepted dogma on trends in solubility. However, this trend is reversed when analyzing the values utilizing µM values.
Table 1.
Comparative analysis of putative 'rule-breakers' as judged by selected physicochemical properties.
| Descriptor | Sample size |
Solubility µg/mL* |
Molecular weight |
Aromatic fraction |
LogP | LogD | H-bond donor |
H-bond acceptor |
P.S.A. |
|---|---|---|---|---|---|---|---|---|---|
| A.F. > 0.7 Low Solubility |
1572 | 0.42 | 305.32 | 0.78 | 3.85 | 3.59 | 1.04 | 4.18 | 66.15 |
| A.F. > 0.7 High Solubility |
134 | 52.96 | 334.84 | 0.75 | 2.68 | 1.19 | 1.07 | 4.39 | 72.16 |
| A.F. < 0.2 Low Solubility |
17 | 0.44 | 262.55 | 0.01 | 1.91 | 0.95 | 1.47 | 4.94 | 75.51 |
| A.F. < 0.2 High Solubility |
211 | 59.67 | 395 | 0.11 | 2 | 1.38 | 1.49 | 7.65 | 105.8 |
| H.B.D. > 5.0 Low Solubility |
4 | 0.38 | 359.98 | 0.73 | 2.41 | 2.36 | 5 | 7.25 | 137.2 |
| H.B.D. > 5.0 High Solubility |
35 | 60.93 | 399.19 | 0.4 | 1.35 | −0.2 | 5.57 | 9.26 | 164.4 |
| H.B.D. < 1.0 Low Solubility |
3949 | 0.48 | 315.17 | 0.61 | 3.71 | 3.46 | 0.63 | 4.37 | 67.13 |
| H.B.D. < 1.0 High Solubility |
3578 | 54.97 | 365.52 | 0.41 | 2.32 | 1.79 | 0.69 | 6.02 | 82.71 |
| H.B.A. > 10.0 Low Solubility |
32 | 0.42 | 377.11 | 0.52 | 2.77 | 2.56 | 2.28 | 10.28 | 144.9 |
| H.B.A. > 10.0 High Solubility |
292 | 64.58 | 441.45 | 0.36 | 1.66 | 0.77 | 2.33 | 10.46 | 151.4 |
| H.B.A. < 1.0 Low Solubility |
44 | 0.59 | 241.08 | 0.69 | 4.25 | 4.08 | 0.27 | 1 | 24.03 |
| H.B.A. < 1.0 High Solubility |
14 | 53.79 | 277.47 | 0.62 | 2.41 | 1.47 | 0.07 | 1 | 17.12 |
| LogP > 5.5 Low Solubility |
169 | 0.46 | 337.75 | 0.59 | 5.94 | 5.03 | 0.78 | 3.85 | 63.14 |
| LogP > 5.5 High Solubility |
31 | 58.19 | 405.32 | 0.45 | 5.84 | 3.05 | 1.55 | 6.03 | 99.95 |
| LogP < −0.5 Low Solubility |
3 | 0.57 | 248.04 | 0.41 | −1.31 | −2.14 | 1.33 | 5.33 | 79.24 |
| LogP < −0.5 High Solubility |
117 | 55.47 | 343.16 | 0.38 | −1.41 | −2.83 | 1.62 | 6,86 | 97.1 |
| P.S.A. > 115 Low Solubility |
342 | 0.44 | 345.85 | 0.55 | 3.04 | 2.58 | 1.87 | 7.32 | 129.4 |
| P.S.A. > 115 High Solubility |
1335 | 59.13 | 402.54 | 0.41 | 1.92 | 0.77 | 2.09 | 8.26 | 137 |
| P.S.A.< 41 Low Solubility |
584 | 0.55 | 292.78 | 0.63 | 4.2 | 4.13 | 0.45 | 2.68 | 30.58 |
| P.S.A.< 41 High Solubility |
253 | 54.03 | 313.44 | 0.49 | 2.74 | 1.17 | 0.48 | 3.06 | 29.66 |
Values are listed as the mean. A.F. = aromatic fraction, H.B.D. = hydrogen bond donor, H.B.A. = hydrogen bond acceptor, P.S.A. = polar surface area (1.0 × 10⁻²⁰ m2).
Table 2.
Comparative analysis of putative 'rule-breakers' as judged by selected physicochemical properties.
| Descriptor | Sample size |
Solubility µM* |
Molecular weight |
Aromatic fraction |
LogP | LogD | H-bond donor |
H-bond acceptor |
P.S.A. |
|---|---|---|---|---|---|---|---|---|---|
| A.F. > 0.7 Low Solubility |
1574 | 1.41 | 307.72 | 0.78 | 3.86 | 3.59 | 1.05 | 4.21 | 66.83 |
| A.F. > 0.7 High Solubility |
422 | 162.59 | 267.61 | 0.77 | 2.31 | 0.77 | 1.19 | 3.74 | 61.81 |
| A.F. < 0.2 Low Solubility |
20 | 1.88 | 305.2 | 0.04 | 2.38 | 1.69 | 1.35 | 5.4 | 87.5 |
| A.F. < 0.2 High Solubility |
317 | 166.7 | 245.63 | 0.01 | 1.05 | −0.69 | 1.48 | 4.38 | 67.29 |
| H.B.D. > 5.0 Low Solubility |
4 | 1.07 | 358.98 | 0.73 | 2.41 | 2.36 | 5 | 7.25 | 137.2 |
| H.B.D. > 5.0 High Solubility |
41 | 166.62 | 296.11 | 0.35 | 0.61 | −1.67 | 5.56 | 7.73 | 140.5 |
| H.B.D. < 1.0 Low Solubility |
4006 | 1.55 | 318.43 | 0.6 | 3.71 | 3.45 | 0.63 | 4.44 | 68.05 |
| H.B.D. < 1.0 High Solubility |
3650 | 157.91 | 290.11 | 0.44 | 2.16 | 1.06 | 0.72 | 4.46 | 64.89 |
| H.B.A. > 10.0 Low Solubility |
39 | 1.42 | 379.06 | 0.52 | 2.76 | 2.41 | 2.31 | 10.23 | 143.9 |
| H.B.A. > 10.0 High Solubility |
42 | 155.39 | 404.7 | 0.41 | 1.99 | −1.27 | 3.29 | 10.52 | 164.7 |
| H.B.A. < 1.0 Low Solubility |
36 | 2.25 | 247.36 | 0.68 | 4.34 | 4.14 | 0.25 | 1 | 23.65 |
| H.B.A. < 1.0 High Solubility |
64 | 189.94 | 222.41 | 0.49 | 2.02 | 0.79 | 0.55 | 1 | 15.97 |
| LogP > 5.5 Low Solubility |
176 | 1.4 | 343.63 | 0.59 | 5.98 | 5.05 | 0.79 | 3.98 | 65.67 |
| LogP > 5.5 High Solubility |
25 | 151.16 | 349.51 | 0.49 | 5.89 | 2.41 | 1.4 | 5.08 | 90.1 |
| LogP < −0.5 Low Solubility |
3 | 2.27 | 248.04 | 0.41 | −1.31 | −2.14 | 1.33 | 5.33 | 79.24 |
| LogP < −0.5 High Solubility |
246 | 177.95 | 239.47 | 0.39 | −1.54 | −3.49 | 1.64 | 4.72 | 68.35 |
| P.S.A. > 115 Low Solubility |
379 | 1.43 | 350.84 | 0.54 | 3.06 | 2.58 | 1.87 | 7.35 | 129.7 |
| P.S.A. > 115 High Solubility |
619 | 151.56 | 335.06 | 0.43 | 1.75 | −1.16 | 2.32 | 7.16 | 132.9 |
| P.S.A. < 41 Low Solubility |
562 | 1.82 | 296.08 | 0.63 | 4.21 | 4.13 | 0.45 | 2.71 | 30.75 |
| P.S.A. < 41 High Solubility |
796 | 175.43 | 257.22 | 0.45 | 2.25 | 1.25 | 0.52 | 2.71 | 28.39 |
Values are listed as the mean. A.F. = aromatic fraction, H.B.D. = hydrogen bond donor, H.B.A. = hydrogen bond acceptor, P.S.A. = polar surface area (1.0 × 10⁻²⁰ m2).
Other trends included the role that LogP and LogD play in defining the solubility associated with molecules with either high or low aromatic fractions (a good surrogate of the ratio of sp2 and sp3 hybridized carbons). The trend associating a lower LogP and LogD value was a major determinant in correcting for ‘rule-breaking’ values in the H.B.D., H.B.A and P.S.A. analyses as well. A high value for aromatic fraction was played a significant role in the ‘rule-breaker’ result associated with low-soluble compounds that maintained a H.B.D. value > 5.0. The relative samples sizes associated with H.B.D.’s underscores a major bias in this compound collection toward compounds with few H.B.D.’s. Another interesting result from this analysis was the low values for P.S.A. associated with compounds with a H.B.A. value below 1.0. Agents with a LogP value > 5.5 that had high solubility possessed a significantly lower LogD value and an increase in P.S.A. value. When holding P.S.A. values the same (either high or low) offered a glimpse into this properties role in governing solubility and the sample sizes were sizeable for both analyses. In these analyses, LogP and LogD values were shown to play a significant role however there were relatively close values for the other descriptors.
As this library represents a subset of the NIH MLSMR this data set offers a unique opportunity to relate solubility to the results of numerous assays that are published in the PubChem database. Frequent reports and studies decry certain molecular scaffolds as being inappropriate for HTS settings and suggest a general set of rules for small molecules that are likely to be ‘frequent hitters’ within a multitude of assays. Assay promiscuity has been linked to compounds containing reactive ‘warhead’ moieties, agents that are autofluorescent, inhibitors of reporter constructs and even cytotoxic agents.22–24 Another major source of compound oriented assay interference is the colloidal aggregation phenomenon.25 We have previously examined the aggregation results for a large set of screening results in a thiol protease assay and a β–lactamase assay.26,27 While individual compound solubility has long been thought to play a role in the aggregation phenomenon it has yet to be directly correlated to assay results in large scale profiles. In order to investigate the role that solubility has on the frequency of putative actives across a large range of assays and what role that solubility plays in the aggregation phenomenon we examined our results in the context of numerous assays reported in PubChem including an assay designed to identify aggregation events.
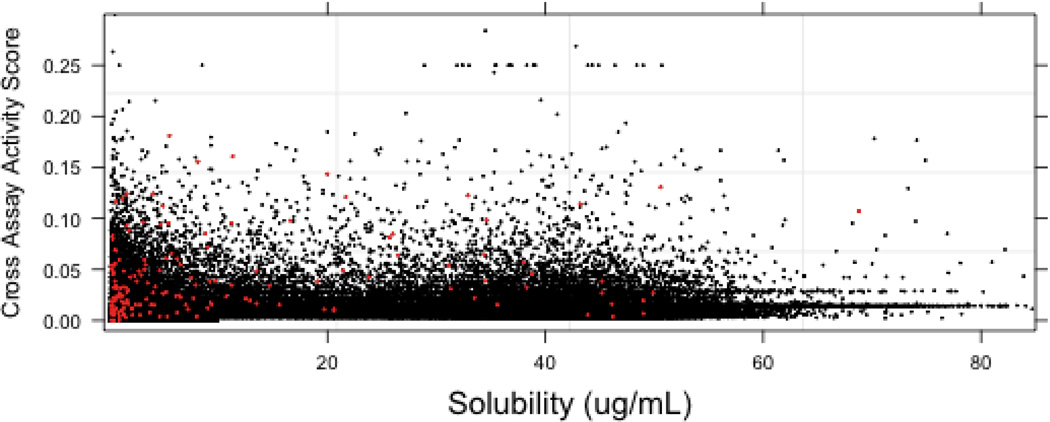
To identify cross-assay activity, we downloaded the data for all PubChem bioassays (462,437 assays currently in PubChem as of October 2010) and defined the cross-assay activity score (CAAS) as the number of times a compound was marked as ‘active’ divided by the number of assays in which it was tested. In this analysis a completely promiscuous compound (active in all assays it was tested in) would have a CAAS of 1.0 while a completely inactive compound would have a CAAS of 0.0. The results are shown in Figure 6. While there are a few molecules that appear to be quite promiscuous (CAAS greater than 0.25), the mean score for each group is generally less than 0.02. For the most soluble group (> 60 µg/mL), the bulk of the molecules do not exhibit significant cross-assay activity. Unsurprisingly, the least soluble group (<10 µg/mL) tends to exhibit a larger fraction of molecules with higher scores (mean = 0.012 and 3rd quartile = 0.019). While this result highly suggests that low solubility contributes to promiscuous activity it clearly shows that other factors play a role in defining a compound as a ‘frequent hitter.’
Figure 6.
A plot of cross assay activity score versus solubility. 165 molecules are highlighted in red corresponding to those identified as putative aggregators in a previously validated β-lactamase screen.
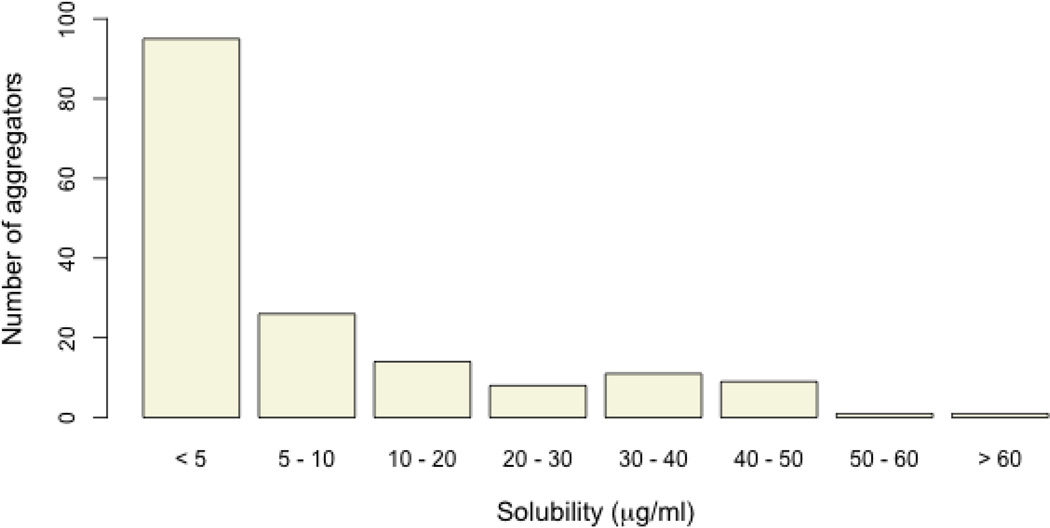
To determine the agents within this profile that are putative aggregators we performed a quantitative high-throughput screen (qHTS)28 of a recent version of the MLSMR (320,098 compounds) using the aforementioned β–lactamase assay (assay details can be found in reference 18 and 27). To identify aggregation-prone library members the assay is run in the presence and absence of detergent and of the 320,098 compounds screened against µ-lactamase under both conditions 50,423 compounds were also measured in the current solubility assay. It should be noted that this assay does not detect the physical presence of aggregates but is a proxy for aggregation-based enzyme inhibition. To identify putative aggregators we considered compounds that exhibited complete concentration-response curves [curve classes −1.1, −1.2, −2.1, −2.2 in the qHTS curve class terminology (see reference 28)] with efficacies greater than 50% in the (−) detergent screen and no concentration dependent behavior (curve class 4) in the (+) detergent screen. This selection is more stringent than that originally published by combining the curve class and maximum inhibition restriction into a single constraint. This identified 1592 compounds as exhibiting aggregation-dependent inhibition from the β-lactamase screens, of which 165 had also been measured in the solubility screen (the remaining 1427 aggregators were not tested in the solubility screen). Of the tested samples, 121 compounds had solubilities less than 10 µg/mL, 43 exhibited solubilities between 10 µg/mL and 60 µg/mL and a single compound exhibited solubility greater than 60 µg/mL (aggregating agents are designated by red points in Figure 6). While these results support the assumption that aggregation is highly related to poor aqueous solubility (Figure 6, Figure 7) it does not imply that poorly soluble compounds aggregate. Interestingly, the molecules identified as aggregators are not uniformly promiscuous. This corresponds to the notion that aggregation events are highly assay-condition specific and agents identified as aggregator in one assay may not aggregate in another assay format.
Figure 7.
Distribution of the number of aggregators by solubility ranges.
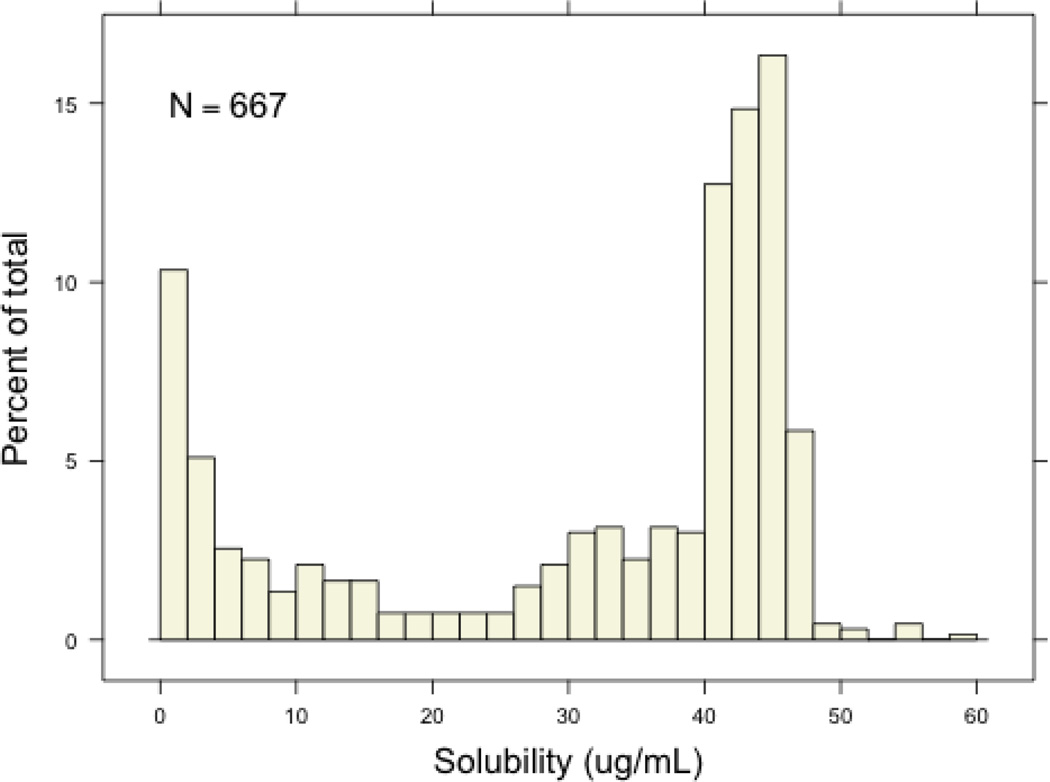
A hopeful outcome from this study is wider use of solubility measurements to guide decision making within specific optimization efforts. Certainty this data will assist computational chemists in deriving new models for solubility prediction. Beyond this, we were interested in asking how this data can be informative for chemists aiming for specific pharmacological and physiological outcomes during particular compound optimizations. As a case study, we examined how the solubility data reported here may (or may not) be utilized in a theoretical optimization effort aiming for an agent that penetrates the blood-brain barrier. Recently, Hitchcock and Pennington published a wide-ranging perspective on structure-brain exposure relationships.29 This review offered several suggestions for ranges of specified physicochemical properties to increase the probability of blood-brain barrier (BBB) penetration. Mean values of the top 25 CNS related drugs for PSA (47), H-bond donors (0.8), cLogP (2.8), cLogDpH 7.4 (2.1), and MW (293) were also provided. We examined the solubility values of the subset of our collection that matched the above 5 parameters within a narrow range. There were 667 compounds that satisfied all criteria and the results are shown in Figure 6. Interestingly, a large proportion of these agents had kinetic solubility values between 40 and 50 µg/mL. The relevancy of these results are unknown as kinetic solubility may play only a small role in passive diffusion across the BBB. Nonetheless, these results certainly challenge the common misconception that to attain BBB penetration a compound should possess modestly low solubility.
4. Conclusion
In this study we have examined the kinetic solubility for a large chemical library and examined the data in a variety of ways. Foremost, commonly used physicochemical properties were correlated to solubility outcomes and generally confirmed the existing dogma in terms of solubility relationships. However, the data also made it clear that chemists cannot rely solely on the predictive capacity of physicochemical trends to assure that their libraries and optimization efforts result in soluble compounds. The role that solubility plays in HTS settings also highlighted that a lack of aqueous solubility contributes to the phenomenon of ‘frequent hitters’ but is not the only determining factor. Further, a lack of kinetic solubility was found to be a primary contributor to the colloidal aggregation phenomenon. The public availability of this data set is intended to allow researchers access to a uniform training set in order to create new computational tools for solubility prediction. In addition, it is hoped that the lessons from this study will add to chemist’s already substantial intuition regarding structure property relationships. These results certainly concur with other reports in highlighting the importance of solubility in all facets of the drug discovery process.
Supplementary Material
Figure 8.
The solubility results for 667 compounds that retain PSA values between 42 and 52, between 0 and 2 H-bond donors, a LogP value between 1.8 and 3.8, a LogD value between 1.1 and 3.1 and a molecular weight between 273 and 313.
Acknowledgments
The authors would like to thank Dr. Douglas Livingston, Dr. Timothy Lease and the staff at Biofocus DPI for their assistance with compound management. We further acknowledge Dr. Jamie Driscoll for support of this effort. We thank Dr. Ed Kearns for helpful discussion during the writing of this manuscript. This research was supported by the Molecular Libraries Initiative of the National Institutes of Health Roadmap for Medical Research grants U54 HG005033-02 to G.P.R. and the Intramural Research Program of the National Human Genome Research Institute at the National Institutes of Health.
Footnotes
Publisher's Disclaimer: This is a PDF file of an unedited manuscript that has been accepted for publication. As a service to our customers we are providing this early version of the manuscript. The manuscript will undergo copyediting, typesetting, and review of the resulting proof before it is published in its final citable form. Please note that during the production process errors may be discovered which could affect the content, and all legal disclaimers that apply to the journal pertain.
Supplemental data
Supplemental data associated with this article can be found, in the online version, at..
References
- 1.Lipinski C. Poor Aqueous Solubility – an Industry Wide Problem in Drug Discovery. Am. Pharm. Rev. 2002;5:82–85. [Google Scholar]
- 2.Leeson PD, Springthorpe B. The influence of drug-like concepts on decision-making in medicinal chemistry. Nat. Rev. Drug Discov. 2007;6:881–890. doi: 10.1038/nrd2445. [DOI] [PubMed] [Google Scholar]
- 3.Stegemann S, Leveiller F, Franchi D, de Jong H, Lindén H. When poor solubility becomes an issue: from early stage to proof of concept. Eur. J. Pharm. Sci. 2007;31:249–261. doi: 10.1016/j.ejps.2007.05.110. [DOI] [PubMed] [Google Scholar]
- 4.Kennedy JP, Williams L, Bridges TM, Daniels RN, Weaver D, Lindsley CW. Application of Combinatorial Chemistry Science on Modern Drug Discovery. J. Comb. Chem. 2008;10:345–354. doi: 10.1021/cc700187t. [DOI] [PubMed] [Google Scholar]
- 5.Inglese J, Johnson RL, Simeonov A, Xia M, Zheng W, Austin CP, Auld DS. High-throughput screening assays for the identification of chemical probes. Nat. Chem. Biol. 2007;3:466–479. doi: 10.1038/nchembio.2007.17. [DOI] [PubMed] [Google Scholar]
- 6.Lipinski CA, Lombardo F, Dominy BW, Feeney PJ. Experimental and computational approaches to estimate solubility and permeability in drug discovery and development settings. Adv. Drug Del. Rev. 2001;46:3–26. doi: 10.1016/s0169-409x(00)00129-0. [DOI] [PubMed] [Google Scholar]
- 7.Alsenz J, Kansy M. High throughput solubility measurement in drug discovery and development. 2007;59:546–567. doi: 10.1016/j.addr.2007.05.007. [DOI] [PubMed] [Google Scholar]
- 8.Kerns EH, Di L. Drug-like properties: Concepts, Structure Design and Methods. Burlington MA: Academic Press; 2008. [Google Scholar]
- 9.Di L, Kerns EH. Biological assay challenges from compond solubility: strategies for bioassay optimization. Drug Dis. Today. 2006;11:446–451. doi: 10.1016/j.drudis.2006.03.004. [DOI] [PubMed] [Google Scholar]
- 10.Saal C. Optimizing the solubility of research compounds: how to avoid going off track. Am. Pharm. Rev. 2010 May/June;:12–18. [Google Scholar]
- 11.Delaney JS. ESOL: Estimating aqueous solubility directly from molecular structure. J. Chem. Inf. Comp. Sci. 2004;44:100–1005. doi: 10.1021/ci034243x. [DOI] [PubMed] [Google Scholar]
- 12.Balakin KV, Savchuk NP, Tetko IV. In silico approaches to prediction of aqueous and DMSO solubility of drug-like compounds: Trends, problems and solutions. Curr. Med. Chem. 2006;13:223–241. doi: 10.2174/092986706775197917. [DOI] [PubMed] [Google Scholar]
- 13.Johnson SR, Chen X-Q, Murphey D, Gudmundsson O. A computational model for the prediction of aqueous solubility that includes crystal packing, intrinsic solubility, and ionization effects. Mol. Pharm. 2007;4:513–523. doi: 10.1021/mp070030+. [DOI] [PubMed] [Google Scholar]
- 14.Hewitt M, Cronin MTD, Enoch SJ, Madden JC, Roberts DW, Dearden JC. In Silico prediction of aqueous solubility: the solublity challenge. J. Chem. Inf. Comp. Sci. 2009;49:2572–2587. doi: 10.1021/ci900286s. [DOI] [PubMed] [Google Scholar]
- 15.Lüder K, Lindfors L, Westergren J, Nordholm S, Persson R, Pedersen M. In Silico prediction of drug solubility: 4. Will simple potentials suffice? J. Comp. Chem. 2009;30:1859–1871. doi: 10.1002/jcc.21173. [DOI] [PubMed] [Google Scholar]
- 16.Kramer C, Heinisch T, Fligge T, Beck B, Clark T. A consistent dataset of kinetic solubilities for early-phase drug discovery. ChemMedChem. 2009;4:1529–1536. doi: 10.1002/cmdc.200900205. [DOI] [PubMed] [Google Scholar]
- 17.Hill AP, Young RJ. Getting physical in drug discovery: a contemporary perspective on solubility and hydrophobicity. Drug Dis. Today. 2010;15:648–655. doi: 10.1016/j.drudis.2010.05.016. [DOI] [PubMed] [Google Scholar]
- 18.Babaoglu K, Simeonov A, Irwin JJ, Nelson ME, Feng B, Thomas CJ, Cancian L, Costi MP, Maltby DA, Jadhav A, Inglese J, Austin CP, Shoichet BK. Comprehensive mechanistic analysis of hits from high-throughput and docking screens against β–lactamase. J. Med. Chem. 2008;51:2502–2511. doi: 10.1021/jm701500e. [DOI] [PMC free article] [PubMed] [Google Scholar]
- 19.Bhattachar SN, Wesley JA, Seadeek C. Evaluation of the chemiluminescent nitrogen detector for solubility determinations to support drug discovery. J. Pharmaceut. Biomed. 2006;41:152–157. doi: 10.1016/j.jpba.2005.11.009. [DOI] [PubMed] [Google Scholar]
- 20.Ertl P, Rohde B, Selzer P. Fast calculation of molecular polar surface area as a sum of fragment-based contributions and its application to the prediction of drug transport properties. J. Med. Chem. 2000;43:3714–3717. doi: 10.1021/jm000942e. [DOI] [PubMed] [Google Scholar]
- 21.Cheng T, Li Q, Wang Y, Bryant S. Binary classification of aqueous solubility using support vector machines with reduction and recombination feature selection. J. Chem. Inf. Model. 2011 doi: 10.1021/ci100364a. ASAP. [DOI] [PMC free article] [PubMed] [Google Scholar]
- 22.Rishton GM. Nonleadlikeness and leadlikeness in biochemical screening. Drug Dis. Today. 2003;8:86–96. doi: 10.1016/s1359644602025722. [DOI] [PubMed] [Google Scholar]
- 23.Simeonov A, Jadhav A, Thomas CJ, Wang Y, Huang R, Southall NT, Shinn P, Smith J, Austin CP, Auld DS, Inglese J. Fluorescence spectroscopic profiling of compound libraries. J. Med. Chem. 2008;51:2363–2371. doi: 10.1021/jm701301m. [DOI] [PubMed] [Google Scholar]
- 24.Auld DS, Thorne N, Nguyen D-T, Inglese J. A specific mechanism for nonspecific activationin reporter-gene assays. ACS Chem. Biol. 2008;3:463–470. doi: 10.1021/cb8000793. [DOI] [PMC free article] [PubMed] [Google Scholar]
- 25.McGovern SL, Caselli E, Grigorieff N, Shoichet BK. A common mechanism underlying promiscuous inhibitors from virtual and high-throughput screening. J. Med. Chem. 2002;45:1712–1722. doi: 10.1021/jm010533y. [DOI] [PubMed] [Google Scholar]
- 26.Jadhav A, Ferreira RS, Klumpp C, Mott BT, Austin CP, Inglese J, Thomas CJ, Maloney DJ, Shoichet BK, Simeonov A. Quantitative analyses of aggregation, autofluorescence, and reactivity artifacts in a screen for inhibitors of a thiol protease. J. Med. Chem. 2010;53:37–51. doi: 10.1021/jm901070c. [DOI] [PMC free article] [PubMed] [Google Scholar]
- 27.Feng BY, Simeonov A, Jadhav A, Babaoglu K, Inglese J, Shoichet BK, Austin CP. A high-thoughput screen for aggregation-based inhibition in a large compound library. J. Med. Chem. 2007;50:2385–2390. doi: 10.1021/jm061317y. [DOI] [PubMed] [Google Scholar]
- 28.Inglese J, Auld DS, Jadhav A, Johnson RL, Simeonov A, Yasgar A, Zheng W, Austin CP. Quantitative high-throughput screening: a titration-based approach that efficiently identifies biological actives in large chemical libraries. Natl. Acad. Sci. U. S. A. 2006;103:11473–11478. doi: 10.1073/pnas.0604348103. [DOI] [PMC free article] [PubMed] [Google Scholar]
- 29.Hitchcock SA, Pennington LD. Structure-brain exposure relationships. J. Med. Chem. 2006;49:7559–7583. doi: 10.1021/jm060642i. [DOI] [PubMed] [Google Scholar]
Associated Data
This section collects any data citations, data availability statements, or supplementary materials included in this article.


