

Abstract
We demonstrate for the first time the ability to determine in vivo and in utero the transitions between the main stages of white matter (WM) maturation in normal human fetuses using magnetic resonance diffusion tensor imaging (DTI) tractography. Biophysical characteristics of water motion are used as an indirect probe to evaluate progression of the tissue matrix organization in cortico-spinal tracts (CSTs), optic radiations (OR), and corpus callosum (CC) in 17 normal human fetuses explored between 23 and 38 weeks of gestation (GW) and selected strictly on minimal motion artifacts. Nonlinear polynomial (third order) curve fittings of normalized longitudinal and radial water diffusivities (Z-scores) as a function of age identify three different phases of maturation with specific dynamics for each WM bundle type. These phases may correspond to distinct cellular events such as axonal organization, myelination gliosis, and myelination, previously reported by other groups on post-mortem fetuses using immunostaining methods. According to the DTI parameter dynamics, we suggest that myelination (phase 3) appears early in the CSTs, followed by the OR and by the CC, respectively. DTI tractography provides access to a better understanding of fetal WM maturation.
Keywords: Corpus callosum, corticospinal tracts, diffusion tractography, fetal development, human, in utero, visual pathways, white matter maturation
Introduction
Current knowledge on fetal white matter (WM) maturation comes from post-mortem pathological studies (Gilles 1983; Brody et al. 1987). These studies have mainly focused on the myelination, the last step of WM maturation. Myelination is reported as a nonlinear complex phenomenon progressing with a spatio-temporal course specific to each species. In humans, it begins at the second half of gestation and can evolve until the age of 20 for structures such as the corpus callosum (CC) (Kinney et al. 1988). Recent histological advances in immunostaining methods have allowed a better description of the cascade of cellular events characterizing the early phases (before myelination) of human fetal WM maturation on post-mortem samples (Back et al. 2002). These observations confirm the existence of a premyelinating phase corresponding to the appearance of abundant “myelination glia,” composed by oligodendrocyte (OL) precursors and immature OL, as an essential step prior to the myelination process (Back et al. 2002).
Although prenatal ultrasound and conventional T1- and T2-weighted MRI bring crucial information on the brain development of human fetuses in utero (Girard et al. 1995), the early cellular events involved in WM maturation are not yet accessible by these techniques.
The unique opportunity to detect such microscopic phenomena in utero relies on the characterization of water molecule motions restricted by cerebral tissue using magnetic resonance diffusion-weighted imaging (DWI). Based on published reports that have used in vitro and in vivo neurological model systems, Beaulieu (2002) and Song et al. (2002) have proposed to associate the microstructural organization of WM tracts with water diffusion characteristics. Apparent diffusion coefficient (ADC) reflects the probability of displacement of a water molecule (modeled by a sphere) characterized by Brownian motion within a tissue supposed to be isotropic. To date, ADC variations on fetal WM are used to detect the initiation of myelination processes before conventional T1 and T2 images (Prayer and Prayer 2003; Righini et al. 2003; Schneider et al. 2007). However, ADC alone cannot detect the first stage of WM maturation or differentiate the successive stage described by histology. Diffusion tensor imaging (DTI) represents a new breakthrough in the analysis of WM maturation by modeling water molecule displacement by an ellipse oriented along the main direction of tissue structure (Mori and Zhang 2006). In anisotropic tissue such as WM, DTI provides in addition to ADC, information about the anisotropy of water diffusion reflecting a particular cellular arrangement of the structure, through parameters such as fractional anisotropy (FA), longitudinal (λ//), and radial (λ⊥) diffusivities (Song et al. 2002). It also gives access to the main direction of water diffusion within a given voxel. When combined, this information can be used to estimate three-dimensional trajectories of WM bundles by tractography algorithms. However, imaging fetuses in utero remains an important technical challenge, especially for motion-sensitive examinations such as DTI. Bui et al. (2006) were the first to measure in utero the diffusion tensor in the fetal WM between 31 GW and 37 GW in a series of 24 fetuses selected based on the absence of motion artifact (50% of cases)). They assessed ADC and FA on restrictive regions of interest (ROIs). Kasprian et al. are the only ones who have used DTI and three-dimensional tractography in living non sedated human fetus in utero (Kasprian et al. 2008). The successful reconstruction in only 40% of examined fetuses and the absence of significant correlation between DTI parameters and gestational age illustrate that in utero DTI is extremely challenging, limited by many sources of errors and artifacts (Kasprian et al. 2008). Few teams are actively working on motion correction to improve robustness of this technique (Rousseau et al. 2005, 2006; Jiang et al. 2007, 2009) but new improvements are still required.
By characterizing in utero the relative variations of longitudinal (λ//) and radial (λ⊥) water diffusivities on entire individual WM bundles during gestation in very well-selected fetal DTI acquisitions with minimal motion, we aimed at determine noninvasively the major key periods and transitions of tissue organization for the cortico-spinal tract (CST), the OR, and the CC in normal human fetuses.
Materials and Methods
Subjects
Cerebral magnetic resonance examinations were performed for clinical purpose at our institution after selection of patients by the multidisciplinary fetal medical team. The indications of the fetal magnetic resonance imaging (MRI) explorations were pregnancies at risk of brain damage, suspicion of brain malformation on ultrasound scans, and presence of maternal and/or family history of brain development disorders. Gestational age was determined by a previous sonography at 12 postovulatory weeks. Fetuses were selected when conventional MRI examinations were normal based on the report of a neuroradiologist expert in fetal MRI (NG) (absence of anatomical malformation, absence of WM or gray matter lesions) and when they were considered normal at birth by pediatric neurologist. Of the 141 brain fetus DTI acquisitions, 61 fulfilled these criteria.
Imaging in the presence of subject motion has been an ongoing challenge for MRI, especially for motion sensitive examinations such as DTI. In utero fetal DTI is an extreme case vulnerable to the mother's respiration and fetal motion artifacts. Consequently, among 61 normal cerebral fetal MRI with DTI sequence, only 17 (28%) were selected for the study based on the absence of motion corruption on coronal, sagittal, and axial views of b = 0 images evaluated by two independent readers (EZ, NG) and the sufficient quality of the FA color-coded directionality map (color coherence of the major bundles) and ADC maps (Fig. 1). Discordant cases were finally rejected by consensus. The mean gestational age was 32 ± 4 weeks of gestation (range, 23–38 weeks). The cohort was constituted by fetuses at gestation ages of 23 GW(1), 24 GW(1), 27 GW(1), 28 GW(2), 30 GW(1), 32 GW(1), 33 GW(3), 34 GW(2), 35 GW(2), 36 GW(1), 37 GW(1), and 38 GW(1).
Figure 1.
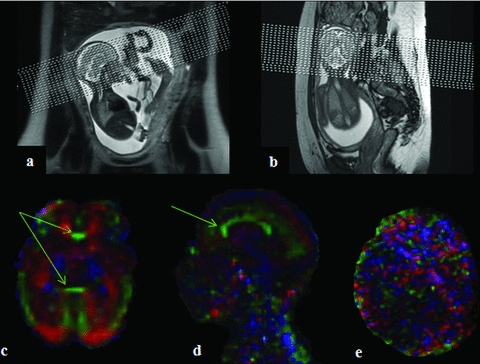
Example of in utero DTI acquisition slice positioning and resulting FA color-coded directionality map. (A and B) The displays of in utero acquisitions performed in the axial plane relative to the fetus head. The quality of the resulting DTI images was assessed according to the good definition of large white matter (WM) bundles such as corpus callosum (CC) (green arrows) on the reconstructed FA color-coded directionality maps as in (C and D), examples of high-quality DTI acquisitions included in the study. Image in (E) represents DTI of poor quality excluded from analysis. Note that the spatial reference varies according to the orientation of the fetus head relative to the scanner orientation. This induces changes in the color directionality code usually observed in adults.
Image acquisition
MR images were taken with 1.5 T MR scanner (Magnetom Symphony Siemens, Erlangen, Germany) using a phased array coil with four anterior elements wrapped around the mother's abdomen and two to three posterior spinal elements.
Conventional fetal MRI were acquired using T2-weighted single-shot sequences (HASTE, TE/TR: 137 ms/1680 ms; BW 220 Hz/pixel, 21 contiguous slices, 3.5 mm thickness, matrix: 358 × 512, FOV: 380 mm) acquired in three orthogonal planes oriented along the fetal brain, and both axial and coronal gradient echo T1-weighted sequence (Flash TE/TR: 3.3 ms/493 ms, BW 260 Hz/pixel, 19 slices, 4 mm thickness, matrix: 154 × 256, FOV: 350 mm).
DTI was acquired with mother sedation (Flunitrazepam, Rohypnol®, Roche, Basel, Switzerland) in a dorsal decubitus position using a single-shot echo-planar spin-echo sequence with the following parameters: TE/TR: 105 ms/8900 ms, 50 contiguous slices, 2.2 mm thickness, matrix: 128 × 128; FOV: 256 × 256 mm2. Diffusion gradients were encoded in 12 directions with a b values of 1000 s/mm2 and an additional image with no diffusion gradient (b = 0 s/mm2). Three sets of DTI data were acquired for average and the total DTI acquisition time was 5 min 47 sec. To improve the signal-to-noise ratio (SNR) for the DTI images, the three separate sets of images were averaged automatically by the “Neuro3D task card” (Siemens Syngo). We determined the SNR according to Kasprian et al. (2008). The SNR is defined as the mean value of the signal of a circumscribed WM region of the fetal brain on diffusion unweighted (b = 0 s/mm2) images divided by the standard deviation determined in the same region.
A b value of 1000 s/mm2 was used in fetal DTI as Huang et al. (2009). This value was adapted to high ADC values expected at the fetal WM in order to the formula 1.1 per ADC that have been thought to provide the best contrast-to-noise ratio (Dudink et al. 2008).
Data postprocessing
Diffusion tensor parameters
DTI calculation and postprocessing were performed after transferring diffusion-weighted images to a Siemens off-line workstation, using the “DTI task Card” software, and the four classical parameters were computed: the longitudinal diffusivity (λ// or λ1), the radial diffusivity λ⊥ = (λ2+λ3)/2, the ADC, and the FA.
Definition of seed regions and tractography
Seed regions for DTI tractography were determined based on anatomical landmarks observed on the ADC and FA color-coded directionality maps (Figs. 2 and 3). Using the “Neuro3D task card” (Siemens Syngo), each axes of the MPR (multi-planar reconstruction) was rotated (double oblique) to get axial, coronal, and sagittal planes in the anatomical referential for each fetus. ADC maps provided a good contrast, and the overlay of color-coded FA helped to depict coherent fiber pathways nearby the ROIs by indicating fiber direction and degree of anisotropy. However, because the fetus head in utero is randomly positioned relative to the scanner referential, the color code used in this study did not correspond to the regular color code obtained in adults with standard positioning (red: right–left, green: antero–posterior, blue: supero–inferior) (Pajevic and Pierpaoli 1999). The “Neuro3D DTI task card” did not allow to apply tensor rotation to keep this conventional color code.
Figure 2.
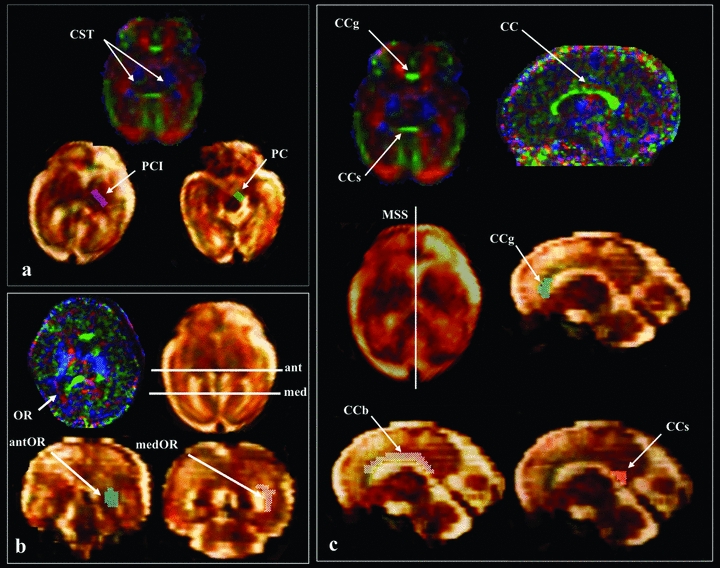
Diffusion tensor tractography method used to depict cortico-spinal tract (CST), optic radiations (OR), and CC bundles. Regions-of-interest (ROIs) were delineated based on anatomical landmarks observed on ADC and FA color-coded directionality maps. (A) For the CST observed in blue on the image in the left superior quadrant, tractography algorithm (Runge Kutta order 4) was initiated from two ROI located in the posterior limb of the internal capsule (PCI) (purple ROI) and the cerebral peduncles (PC) (green ROI). (B) For OR observed in red in the image on the left inferior quadrant, the two ROI were defined on coronal slices located on the anterior (ant) and medial (med) parts of OR. (C) Corpus callosum (CC) observed in green on right quadrant was divided in three subparts: the genu (CCg), the body (CCb), and the splenium (CCs). A single ROI approach was used for the tractography, which was defined from each subpart on the mid-sagittal slice (MSS).
Figure 3.
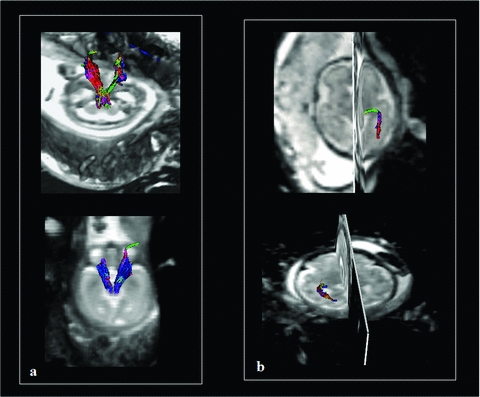
Example of DTI tractography of CST and OR obtained in utero and in vivo for fetal brain. Tractography three-dimensional reconstructions obtained with the Runge Kutta method (order 4) of the CST at 24 GW (A, superior quadrant) and 27 GW (A, inferior quadrant) and OR at 33 GW (B, superior quadrant) and 34 GW (B, inferior quadrant).
The WM bundles selected for analysis in this study included CST (an example of projection tracts), OR (an example of association tracts), and CC (an example of commissural tracts). Because previous study has reported a different sequence of myelination according to the subparts of the CC, its analysis was divided into three parts including genu, body, and splenium (Kinney et al. 1988). These three parts were defined according to Catani et al. (2002) from well-individualized anatomical landmarks on the mid-sagittal slice (MSS) (passing through the median line and in the midline of the CC), frequently used in MRI: an anterior portion, the genu (rounded and rolled up in the bottom and ahead around the anterior pole of diencephalons), a middle portion, the body (overhanging the septum lucidum and the area of the roof of the third ventricle), and a posterior portion, the splenium (rounded and the bulkiest).
The main observer (EZ) performed all the ROIs and tractography twice using a two-ROI analysis for CST and OR (Catani et al. 2002) and single ROIs placed on different levels of the MSS for the different parts of the CC (Fig. 2).
Reconstructed tracts were validated by the main observer (EZ) according to anatomical landmarks observed on ADC maps and b = 0 images projected on the different views (axial, sagittal, and coronal) and data from the literature on post-mortem fetal tractography (Catani et al. 2002; Huang et al. 2009; Vasung et al. 2010). The CSTs were defined as the fibers passing through the cerebral peduncles and the posterior limb of the internal capsule (Fig. 2), the OR as the fibers connecting the lateral geniculate nucleus and the occipital pole (Fig. 2). Fibers tracts generated from the genu connect anterior parts of the frontal lobes (mainly pre-frontal) and their horseshoe-shaped radiating fibers form the anterior (minor) forceps. The genu contains fibers from orbital, medial, and dorsal frontal cortex. These fibers cross the corona radiata and converge toward the anterior horn of the lateral ventricle where they form a compact bundle that arches in the genu. The body of CC contains fibers that connect the premotor and precentral frontal cortex, the parietal lobes, and the temporal lobes. These fibers converge at the posterior horn of the lateral ventricle, around which they are shaped like a cone, before arching medially to cross the midline. The splenium connect occipital lobes and make up the posterior major forceps (Fig. 2) (Catani et al. 2002). The fiber bundles were reconstructed using a streamline Runge Kutta algorithm (order 4). A FA threshold of 0.08 (a low value adapted to the immaturity of the fetal tracts and the intra uterin conditions) was used and a curvature angle smaller than 70° (adapted to the curved geometry of the ORs) was chosen (Yamamoto et al. 2007). Two FA thresholds were tested adapted to the immaturity of the fetal WM: 0.1 and 0.08. Threshold of 0.1 was previously used in the literature in postnatal period (Dubois et al. 2006) and in fetuses in vitro (Vasung et al. 2011). The best results in terms of tractography reconstruction were obtained with the 0.08 threshold.
Then a second investigator expert in fetal neuroradiology (NG) evaluated each of the reconstructed tracts and validated the results. In case of bad scoring by the expert, tracking was redone once, and finally not considered if not approved by the expert at that time. The percentage of rejected reconstructed tractography was 4% (5/119).
Diffusion tensor parameters of each bundle
Masks of the reconstructed bundles were applied to the parametric maps of ADC, FA, λ1, λ2, and λ3 to compute the DTI parameter values of each bundle with SPM 5 (Welcome institute, London). The average values of the ADC, the FA, the λ1 = λ//, λ2, and λ3 for the whole reconstructed bundles were obtained for each tract. The λ⊥ were obtained by average the λ2 and λ3 values of each reconstructed tracts (www.mricro.com).
Statistical analysis
Statistical analyses were performed using the JMP 2008 software (SAS Institute Inc., Cary, NC, USA).
Diffusion characteristics of WM tracts independent of gestational age
The means, medians, minima, and maxima of DTI parameters (ADC, FA, λ//, λ⊥) measured on each type of bundles for all fetuses were calculated and compared bundles by bundles using ANOVA (P < 0.05, corrected for multiple comparisons) to assess the differences in diffusion characteristics between the different WM bundles independently of the gestational age.
Variation of WM tract diffusion characteristics according to gestational age
For each DTI parameter of each WM bundle, Z-scores were computed for each subject relative to the mean values and standard deviations of the whole population of fetuses. ANOVA was conducted on these diffusion parameters to evaluate the effect of age and bundle type (statistical threshold P < 0.05 after False Discovery Rate (FDR) correction).
Variations of diffusion parameters (ADC, FA, λ//, λ⊥) for each type of WM bundle were modeled as a function of age first by linear regression (Kasprian et al. 2008) and also by polynomial fitting functions (degree 3) (Schneider et al. 2007).
Results
Diffusion characteristics of WM tracts independent of gestational age
The SNR of b0 images measured in the 17 included fetuses resulted in a mean value of 14.07 ± 3.17. All selected tracts studied were validated by the two experts (EZ, NG) except for five OR (four rights, one left) in four different subjects (age: 27 GW, 34 GW, 34 GW, 35 GW) that were removed for the subsequent analyses. Thus, 34 CSTs, 29 OR, and 17 CC were identified and characterized (Figs. 3 and 4).
Figure 4.
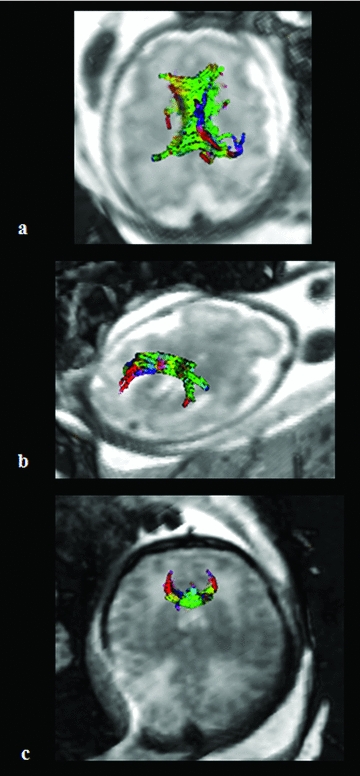
Example of DTI tractography of the CC obtained in utero and in vivo for fetal brain. Tractography three-dimensional reconstructions obtained with the Runge Kutta method (order 4) of the CC divided in three subparts: body of the corpus callosum (CCb) at 33 GW (A), splenium of CC at 33 GW (B), and genu of CC at 37 GW (C).
After verifying that diffusion characteristics were not different between left and right bundles for the CST and the OR (P > 0.05, Wilcoxon rank test), left and right diffusion parameters values of each bundle were pooled for subsequent analyses.
From a structural point of view, each bundle had specific diffusion tensor characteristics (Fig. 5; Table 1). CST was the most organized structure exhibiting significantly lower ADC values compared to OR, genu, body, and splenium of CC (ANOVA, P < 0.05 corrected for multiple comparisons) (Fig. 5). CST also showed higher FA values compared to OR, genu, and body of CC (ANOVA, P < 0.05 corrected for multiple comparisons) (Fig. 5). In contrast, OR appeared as the less-organized structure with significant higher ADC relative to CST, body, and genu of CC, and significant lower FA compared to all the others tracts (ANOVA, P < 0.05 corrected for multiple comparisons).
Figure 5.
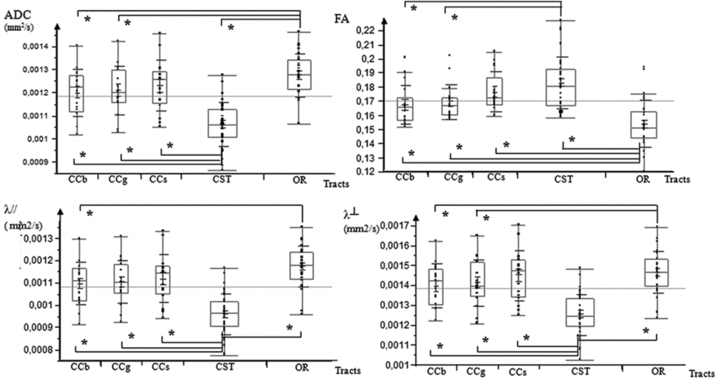
Comparison of diffusion tensor properties observed in the different tracts. Boxplots of ADC (mm2/s), FA, λ// (mm2/s), and λ⊥ (mm2/s) values at the body of corpus callosum (CCb), the genu of corpus callosum (CCg), the splenium of corpus callosum (CCs), the cortico-spinal tract (CST), and the optic radiations (OR) in all 17 fetuses analyzed for this study. *Statistically significant difference between two structures (P < 0.05).
Table 1.
Mean values (± standard deviation) of apparent diffusion coefficient (ADC), fractional anisotropy (FA), longitudinal diffusivity (λ//), and transverse diffusivity (λ⊥)
| Structure | Number | ADC (10−3 mm2/s) mean and SD | FA mean and SD | λ// (10−3 mm2/s) mean and SD | λ⊥ (10−3 mm2/s) mean and SD |
|---|---|---|---|---|---|
| CST | 34 | 1.063 ± 0.095 | 0.183 ± 0.018 | 1.255 ± 0.103 | 0.964 ± 0.092 |
| OR | 29 | 1.275 ± 0.094 | 0.154 ± 0.016 | 1.468 ± 0.104 | 1.176 ± 0.091 |
| CCg | 17 | 1.211 ± 0.104 | 0.170 ± 0.012 | 1.414 ± 0.115 | 1.105 ± 0.098 |
| CCb | 17 | 1.201 ± 0.101 | 0.168 ± 0.014 | 1.399 ± 0.111 | 1.100 ± 0.098 |
| CCs | 17 | 1.231 ± 0.111 | 0.177 ± 0.014 | 1.450 ± 0.128 | 1.121 ± 0.107 |
CST = cortico-spinal tracts, OR = optic radiations, CCg = genu of corpus callosum, CCb = body of the corpus callosum, CCs = splenium.
Variation of WM tract diffusion characteristics according to gestational age
According to the poor linear fitting of diffusion parameters with age, the polynomial function of degree 3 was chosen to model the variation of parameters during gestation. We defined the transition periods between the different stages of maturation numerically from the intersections of the λ// and λ⊥ polynomial fitting functions according to age.
In order to normalize variations and dynamics of the different parameters, values were rescaled according to the Z-score formula using the mean values and standard deviations of the whole population for each parameter. Each normalized parameter was plotted against age for each bundle and the distribution was fitted using a 3 degree polynomial function. Models were valid (R > 0.5 and P < 0.05) for all diffusion parameters of each bundle except for diffusion parameters of the genu of CC (P = 0.10–0.9), the FA of the body of CC (P = 0.16), and the λ// of the splenium (P = 0.11).
During the 23–38 GW period, differences in the relative variations of longitudinal (λ//) and radial diffusivity (λ⊥) curves identified three distinct phases of water molecule restriction (Fig. 6). The transition between two phases was determined as the time point when normalized λ// and λ⊥ curves versus gestational age were crossing. The precise time point was determined numerically by equalizing the two equations of the polynomial fitting curves.
Figure 6.
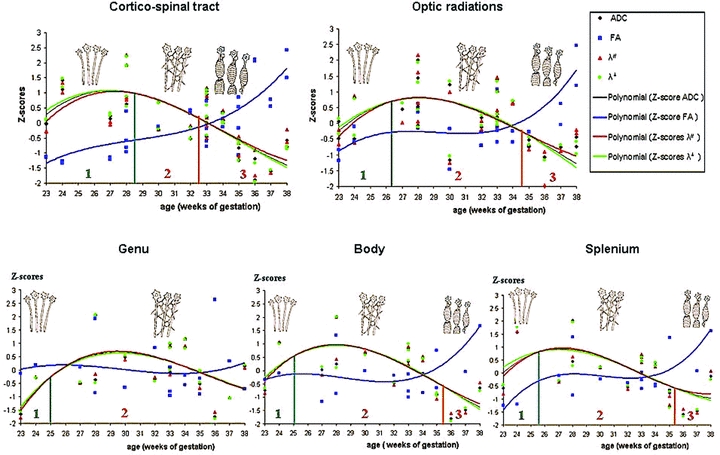
Variation of diffusion parameters during gestation according to the WM structure. Determination of three different maturation phases according to the numerical determination of differential evolutions of the λ// and λ⊥ curves modeled by a 3 degree polynomial function (phase 1 in green, phase 2 in orange, and phase 3 in red) and schematic representations of the supposed corresponding histological events displayed in Figure 8.
The first phase started with a greater increase in λ// compared to λ⊥, involving increased FA and ADC. The end of this first phase was identified at 28.5 GW for the CSTs, 26.3 GW for the OR, 25 GW for the genu and body of CC, and 25.6 GW for the splenium of the CC (Figs. 6 and 7).
Figure 7.
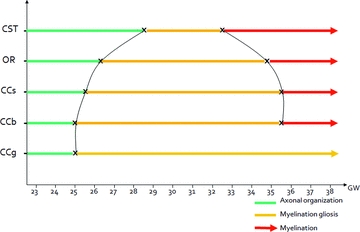
Putative dynamics of WM maturation derived from polynomial fittings of in vivo DTI tractography parameters acquired in utero. CCb = body of corpus callosum, CCg = the genu of corpus callosum, CCs = the splenium of corpus callosum, CST = the cortico-spinal tract, OR = optic radiations, GW = gestational weeks.
The second phase corresponded to a similar variation of the normalized longitudinal (λ//) and radial diffusivities (λ⊥). During this phase, λ// and λ⊥ reached a plateau before decreasing in the same manner, inducing no variation of ADC before decrease, and stable FA during the whole period. The end of this second phase (where the two curves diverged) was reached at 32.5 GW for the CSTs, 34.8 GW for the ORs, 35.4 GW for the body of CC, and 35.3 GW for the splenium of the CC. Conversely, the end of this second period was not reached for the genu of CC before 38 GW (Figs. 6 and 7).
The third phase corresponded to a faster decrease of the normalized radial diffusivity (λ⊥) relative to the longitudinal diffusivity (λ//), reflected by an increase in FA and a slower decrease in ADC.
These three different phases of diffusion parameter variations could be observed for all bundles except for the genu of CC for which the transition between phases 2 and 3 was not observed before 38 GW. Observed dynamics of maturation of each bundle derived from the present study are summarized in Figure 7.
ANOVA conducted on these data showed global time effects on DTI parameters during gestation (P < 0.002) with significant bundle-type effects (P < 0.03) and bundle-type × age interactions (P < 0.002) for the λ//, λ⊥, ADC, and FA, evidencing a significantly more advanced and faster maturation of the CST compared to the genu of CC and the OR. In addition, ANOVA conducted on the subparts of CC evidenced significant global effect (P < 0.02) with a bundle-type effect (P < 0.004) and a bundle-type × age interaction (P < 0.05) demonstrating a less-advanced and slower maturation of the genu compared to the other subparts of CC.
Discussion
In vivo DTI tractography of human fetuses
DTI tractography has already been applied to the study of children brain maturation from the early postnatal period (Gilmore et al. 2007; Provenzale et al. 2007; Dubois et al. 2008). It has not only shown lower FA and higher ADC values of children's WM bundles relative to adults, but also linear correlations between age and DTI parameters during development (Gilmore et al. 2007; Provenzale et al. 2007; Dubois et al. 2008). In fetuses, post-mortem DTI detects the main WM bundles as early as 13 GW (Huang et al. 2009). Encouraging results concerning in utero explorations of living fetuses have been reported using DTI on limited regions of interest without tractography; preventing characterization of the entire (or at least a large part) of the WM bundles (Bui et al. 2006).
To our knowledge, only one DTI tractography study has been conducted in utero on living fetuses, demonstrating the feasibility but also pointing out the numerous technical challenges to overcome in order to obtain robust results (Kasprian et al. 2008). We have also observed that quality of DTI tractography and derived diffusion parameters are highly dependent on fetus and mother motions. However, it was possible to get reliable evolution of diffusion parameters during gestation from the examination of 17 fetuses with an optimized acquisition protocol and a drastic selection of DTI data. The tracking accuracy might also be affected by the presence of crossing fibers, especially for OR in regions closed to the inferior longitudinal fasciculus. However, the two ROIs approach chosen to perform DTI tractography limited trajectory reconstruction errors. Accordingly, ADC values determined in our study for the CC and the CSTs were consistent with previous results obtained in utero in fetuses using DTI without tractography (Bui et al. 2006), and values of ADC and λ⊥ were logically higher and FA values lower in the fetuses of our study compared to neonates and adults (Dubois et al. 2008). Differences in mean FA values (0.18 vs. 0.28) of the bundles obtained in the present work relative to previous reports (Kasprian et al. 2008) are logic as far as the FA threshold chosen here to get reliable anatomical reconstructed bundles was lower than in the previous report (0.08 vs. 0.15).
Variation of WM tracts diffusion characteristics according to gestational age
We have observed three different phases of radial and longitudinal diffusivity curve variations as a function of gestational age for most of the bundles. Accordingly, we have adapted the model developed by Dubois et al. (2008) based on the present observations, the previous hypotheses proposed on the anisotropic water diffusion restrictions in the central nervous system from review study (Beaulieu 2002) and the reported histological data of immunostaining of OL lineage on OR (Back et al. 2002) (Fig. 8). Our study showed that phase 1 (before 26.3 GW for OR) corresponded biophysically to a large increase in longitudinal diffusivity concomitant to a slow increase in radial diffusivity causing significant increases in ADC and FA. This period coincides with axonal organization, a transition from tortuous axons state to coherent bundles. Indeed, histological data have shown labeled axons with marker of mature neurofilament (panaxonal neurofilament marker SMI 312), presence of late OL progenitors, and absence of myelin-basic-protein (MBP) (mature myelin marker) (Back et al. 2002). Consequently, the less restricted water motions cause increases in ADC, but water diffusion is less hindered in the longitudinal direction parallel to axons relative to the perpendicular direction causing an increase in both ADC and FA. Water molecule diffusion restriction model evolves from a small sphere (isotropic tissue), to a large ellipse (anisotropic tissue). Phase 2 (between 26.3 GW and 34.8 GW for OR) was characterized by similar and concomitant slow decreases in longitudinal and radial diffusivities, causing no change in FA (plateau) and a decrease in ADC. This period corresponds to progressive increase in immature OL and the emission of cytoplasmic processes randomly oriented relative to axons according to histological data from the literature (Back et al. 2002). Coming from the same sources, marked expansion in the number of immature OL is observed at 30 GW followed by an emission of “pioneer” processes selectively oriented toward individual axons that initiate the axonal contact and then wrap around. This phenomenon, known as “myelination gliosis,” corresponds to maturation of OL progenitors in immature OL followed by a large production of glial matter randomly oriented relative to axons in the extracellular space. Such a cascade would cause an isotropic reduction of the extracellular space explaining the observed water diffusion characteristics: the large ellipse modeling water diffusion moved to a small ellipse with the same shape. Phase 3 (after 34.8 GW for OR) was related biophysically to a slow decrease in longitudinal diffusivity and concomitant fast decrease in radial diffusivity. This period corresponds to, according to histological data, regression in cytoplasmic arborization parallel to selection of cytoplasmic pioneer processes, followed by progressive ensheathment of axons and compaction of myelin sheaths with incorporation of MBP (Back et al. 2002). Such a myelination process caused a large restriction of water diffusion in the radial direction (fast decrease in λ⊥), balanced in the longitudinal direction by disappearance of cytoplasmic arborization (slow decrease in λ//). The ellipse modeling water diffusion became thinner.
Figure 8.
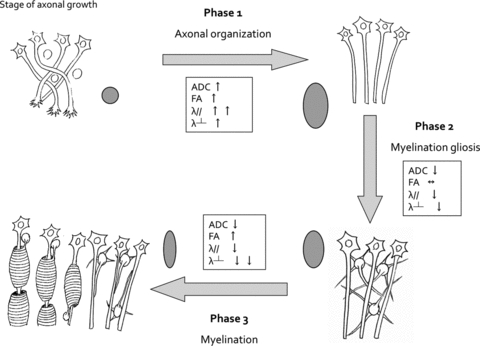
Theoretical model of diffusion tensor parameter variation during human fetal WM maturation. We have adapted the model developed by Dubois et al. (Dubois et al. 2008) based on the present observations, the previous hypotheses proposed on the anisotropic water diffusion restrictions in the central nervous system from review study (Beaulieu 2002), and the reported histological data of immunostaining of oligodendrocytes (OLs) lineage on OR (Back et al. 2002). According to the observed biophysical characteristics of water motion restrictions, especially longitudinal and radial diffusivities, three different WM maturation phases were determined. Phase 1 (axonal organization) corresponds to the transition from tortuous axons to coherent bundles. The less-restricted water motions cause increases in ADC, but water diffusion is more facilitated in the direction parallel to axons relative to the perpendicular direction. Consequently, a faster increase in λ// compared to λ⊥ is observed during this period involving an increase in FA. Water molecule diffusion restriction model is moving from a small sphere, to a large ellipse. Phase 2 (myelination gliosis) corresponds to the production of glial matter in the extracellular space. Motion of water molecules is reduced similarly in all directions causing a concomitant and similar decreases in λ// and λ⊥, no change in FA and decrease in ADC. The large ellipse moved to a small ellipse with same form. Phase 3 (myelination) corresponds to regression of cytoplasmic arborization parallel to the selection of cytoplasmic pioneer processes, followed by a progressive ensheathment of axons and compaction of myelin sheaths with incorporation of myelin binding protein. Motion of water molecules is more restricted in the radial direction (perpendicular to axons) causing a faster decrease of the λ⊥ relative to the λ//, reflected by an increase in FA and a slower decrease in ADC. The ellipse became thinner and smaller.
For the body and splenium of CC, significant fittings with the 3 degree polynomial function were obtained only for three of the four diffusion parameters and for the genu of CC, no significant fitting was obtained whatever diffusion parameters, suggesting that the maturation process of this bundle was not completed yet before birth.
Dynamics of maturation for the different WM bundles
These three phases of the WM maturation sequence have been observed for all structures except for the genu of the CC. Such a nonlinear variation of diffusion parameters is in line with previous reports. Evocated by Schneider et al. (2007) on ADC values measured in utero in human fetuses between 23 GW and 37 GW, the absence of linear correlation between diffusion parameters and gestational age has been confirmed in the sole DTI tractography study conducted in utero by Kasprian et al. (2008). Moreover, the linear evolutions of FA and ADC as a function of age reported in older fetuses (after 32 GW) (Bui et al. 2006), in premature infants born between 25 GW and 34 GW with a large majority of MRI performed after 33 GW (Partridge et al. 2004), and in normal newborns (Dubois et al. 2008) referred in the present model to a period corresponding to the third phase during which diffusion parameter variations follow a linear model relative to age.
From a dynamic point of view and in accordance with histological reports, we observed that myelination (phase 3) could appear early in the CSTs, followed by the OR and by the CC, respectively (Gilles 1983).
One hypothesis sustaining this particular dynamical organization may rely on the fact that the extent of WM maturation can be related to the functionality and excitability of the connected cortical areas. For example, the advanced maturation of OR during gestation in the absence of exogenous visual stimulation could be related to the stimulation of the visual cortex by the pons-geniculate-occipital waves during the rapid eye movement sleep that appears in fetuses as early as 30 GW (Graven 2008). Indeed, the structural maturation process of OR described in DTI coincides with the functional maturation of visual pathways evaluated by visually evoked response in premature infants (Volpe 2008). The first phase of our model corresponding to axonal organization (<26.3 GW) coincides with the appearance of the first visually evoked responses previously observed in premature infants (22–24 GW). The second phase corresponding to myelination gliosis (26.3–34.8 GW) coincides with evolution of visually evoked responses to the principal wave forms (32–35 GW). Finally, the third phase corresponding to the myelination coincides with the appearance of mature visually evoked response (39 GW).
Within the CC, maturation is slow and heterogeneous according to the substructures. The antero-posterior functional differences of the CC are also reflected by differences in maturation dynamics with an early maturation of splenium (initiating phase 2 at 25.6 GW and phase 3 at 35.3 GW) and body (initiating phase 2 at 25 GW and phase 3 at 35.4 GW), and a later maturation of the genu (initiating phase 2 at 25 GW continuing until birth). According to the present results, genu remains in the myelination gliosis phase until 38 GW, showing that the third phase of maturation, that is the myelination, may occur entirely after birth. These observations are consistent with previous data reporting that the greatest variations of diffusion parameters during the postnatal period occurred in the CC and especially in the genu (Partridge et al. 2004; Lobel et al. 2009). Low genu maturation in utero could be related to the very low cognitive stimulation of the frontal lobes of fetuses during gestation (Barkovich 2000).
Lastly, it is worth noting that the first half of the myelination gliosis phase (phase 2) characterized by the initiation of OL progenitor maturation in immature OL within the WM corresponds to the developmental window of high risk for periventricular leukomalacia (PVL) (between 23 GW and 32 GW) (Back et al. 2001). Indeed, late OL progenitors, known as the predominant population of OL during this period, are suspected to be a potential target for injury in PVL (Back et al. 2001).
While promising, this pilot study only provides a proof of concept obtained in one highly selected DTI fetal database with no or minimal motion artifacts. Generalization of this method will require further methodological approaches mostly related to motion corrections to get reliable normative data in a large cohort of fetuses and to study developmental disorders (Rousseau et al. 2005, 2006; Jiang et al. 2007, 2009).
Limitations
Several technical limitations have to be acknowledged thanks to the interpretation of the results obtained in this pilot study.
The major limitation is relative to the fetus motions during acquisition and the way to handle such a problem. As demonstrated by Hayat et al. (2010), there is an important reduction of fetus motion between 23 GW and 36 GW, though attributable to decreased intrauterine space and immobilization of the fetal head in the maternal pelvis in the cephalic presentation (Kasprian et al. 2008). In this study, 85% of selected fetuses were in cephalic presentation. Recent very interesting approaches have been proposed to postprocess DTI data in moving subjects, by rotating appropriately after image registration the directions of the diffusion-sensitizing gradients (Jiang et al. 2007, 2009). In the present study, we did not use such an approach while we decided to select strictly in quite a large sample of data (61 in utero fetuses acquisitions), only the exams with very limited or absent motion observed on coronal, sagittal, and axial views of b = 0 images. Motion was evaluated by two independent readers (EZ, NG). Only a very small number of data survived to this screening (17 out of 61; 28%). Accordingly to minimal fetus motion in this dataset, we obtained sufficient SNR (about 14) on b = 0 s/mm2 images to obtain relevant FA and ADC maps as well as coherent fiber pathways reconstructed by tractography. Finally, each reconstructed tract was evaluated by a second expert in fetal neuroradiology (NG) based on anatomical landmarks. In case of bad scoring, tracking was redone once, and finally not considered if not approved by the expert at that time. Only a small percentage of tracts were rejected during this second selection (4%; five out of 119). Reconstruction of the validated selected tracts could be then considered as robust. It is also important to note that between 23 GW and birth, previous histological studies have demonstrated the presence of the tracts studied in this work (Huang et al. 2009), limiting the false discovery rate of DTI tractography in this population whenever the FA threshold used was quite low (0.08). The use of the two-ROI method (Catani et al. 2002) and the comparison of each reconstructed tracts to anatomical landmarks by an expert in fetal neuroradiology allowed to limit false positive tracts for analysis. In the present in utero study, the tractography parameters, especially the FA thresholds, were chosen to account for the immaturity of the nonmyelinated fetal tracts. Two FA thresholds were tested for tract reconstruction: 0.1 and 0.08, and the best results relative to the structural connectivity organization were obtained with the threshold value of 0.08. A threshold value of 0.1 was previously used in the literature in the postnatal period (Dubois et al. 2006) and in post-mortem fetuses (Vasung et al. 2011). It is noteworthy that along the tracts diffusion parameters vary (central FA > peripheral FA). While we have decided to characterize the whole tract, it was necessary to take an FA threshold value sufficiently low relative to the heterogeneity inside the bundles and to immaturity of fetal WM (Gilmore et al. 2007). The lower FA threshold (FA > 0.08) chosen here relative to the work of Kasprian et al. (2008) (FA > 0.15) may also explain the lower mean FA values obtained here for the reconstructed tracts.
Another point was the choice of the optimal b value. In the few previous studies focusing on in vivo fetal brain DTI, various b values have been used ranging from b values of 500 s/mm2 (Jiang et al. 2009), 600 s/mm2 (Righini et al. 2003; Kim et al. 2008), 700 s/mm2 (Bui et al. 2006; Kasprian et al. 2008) to 1000 s/mm2 (Baldoli et al. 2002). After birth, most of the studies have used higher b values (about 1000 s/mm2) in neonates (Righini et al. 2010) and children between 5 and 13 years of age (Lebel et al. 2009; Wozniak et al. 2009). In post-mortem fetuses, b value of 1000 s/mm2 has been regularly used by several groups (Huang et al. 2009; Vasung et al. 2011; Widjaja et al. 2009). We have chosen here a b value of 1000 s/mm2 to compare diffusion parameters from the present fetuses, with data from the literature obtained in neonates, children, and adults. Moreover, this value is consistent with the usual recommendations giving an optimal b value at 1.1 per ADC to provide the best contrast-to-noise ratio (Conturo et al. 1995; Dudink et al. 2008). In the present study, ADC values fluctuated between 0.9 mm2/sec and 1.4 × 10⁻³ mm2/sec, leading to optimal b values between 800 s/mm2 and 1200 s/mm2.
The last major limitation is the absence of direct comparisons between the maturation stages described in vivo by DTI tractography and histological data that cannot be performed here in the normal human fetuses. However, the correspondence in transition onsets of maturation phases between data from Back et al. and the present results suggests a good reliability of this noninvasive tool to monitor brain maturation (Back et al. 2002). Precision in the transitional periods determined by DTI could suffer from the quality of the polynomial fitting. We did not preclude about the exact determination of the different phases but rather a global trend of variations in DTI parameters reflecting physiological changes relative to WM maturation.
Although the harmlessness of MR examination on fetuses during gestation has been well documented, only the clinical use of fetal MRI is ethically justifiable in humans. Reasons to perform fetal MRI are related to a pathological risk for the fetus. Nevertheless, for these fetuses, conventional MRI was totally normal according to neuropediatric radiology expert (NG).
Finally, a last limitation is relative to the cross-sectional design of the study that does not provide the maturation processes at the individual level. However, from an ethical point of view, it appears impossible to obtain longitudinal data from the same normal fetuses during gestation.
Conclusion
The present study demonstrates the feasibility of in utero DTI tractography to evidence different phases of WM maturation and different time courses in the myelination maturation processes occurring during gestation in human large WM bundles. DTI appears as a promising tool to investigate noninvasively brain maturation of human fetuses. Nevertheless, significant improvements in sequence design and postprocessing are required to allow a real clinical transfer of this powerful technique to characterize in utero developmental maturation and brain disorders.
Acknowledgments
This work is supported by the CNRS.
References
- Back SA, Luo NL, Borenstein NS, Levine JM, Volpe JJ, Kinney HC. Late oligodendrocyte progenitors coincide with the developmental window of vulnerability for human perinatal white matter injury. J Neurosci. 2001;21:1302–1312. doi: 10.1523/JNEUROSCI.21-04-01302.2001. [DOI] [PMC free article] [PubMed] [Google Scholar]
- Back SA, Luo NL, Borenstein NS, Volpe JJ, Kinney HC. Arrested oligodendrocyte lineage progression during human cerebral white matter development: dissociation between the timing of progenitor differentiation and myelinogenesis. J Neuropathol Exp Neurol. 2002;61:197–211. doi: 10.1093/jnen/61.2.197. [DOI] [PubMed] [Google Scholar]
- Baldoli C, Righini A, Parazzini C, Scotti G, Triulzi F. Demonstration of acute ischemic lesions in the fetal brain by diffusion magnetic resonance imaging. Ann Neurol. 2002;52:243–246. doi: 10.1002/ana.10255. [DOI] [PubMed] [Google Scholar]
- Barkovich AJ. Concepts of myelin and myelination in neuroradiology. AJNR Am J Neuroradiol. 2000;21:1099–1109. [PMC free article] [PubMed] [Google Scholar]
- Beaulieu C. The basis of anisotropic water diffusion in the nervous system—a technical review. NMR Biomed. 2002;15:435–455. doi: 10.1002/nbm.782. [DOI] [PubMed] [Google Scholar]
- Brody BA, Kinney HC, Kloman AS, Gilles FH. Sequence of central nervous system myelination in human infancy. I. An autopsy study of myelination. J Neuropathol Exp Neurol. 1987;46:283–301. doi: 10.1097/00005072-198705000-00005. [DOI] [PubMed] [Google Scholar]
- Bui T, Daire JL, Chalard F, Zaccaria I, Alberti C, Elmaleh M, Garel C, Luton D, Blanc N, Sebag G. Microstructural development of human brain assessed in utero by diffusion tensor imaging. Pediatr Radiol. 2006;36:1133–1140. doi: 10.1007/s00247-006-0266-3. [DOI] [PubMed] [Google Scholar]
- Catani M, Howard RJ, Pajevic S, Jones DK. Virtual in vivo interactive dissection of white matter fasciculi in the human brain. Neuroimage. 2002;17:77–94. doi: 10.1006/nimg.2002.1136. [DOI] [PubMed] [Google Scholar]
- Conturo TE, McKinstry RC, Aronovitz JA, Neil JJ. Diffusion MRI: precision, accuracy and flow effects. NMR Biomed. 1995;8:307–332. doi: 10.1002/nbm.1940080706. [DOI] [PubMed] [Google Scholar]
- Dubois J, Hertz-Pannier L, Dehaene-Lambertz G, Cointepas Y, Le Bihan D. Assessment of the early organization and maturation of infants’ cerebral white matter fiber bundles: a feasibility study using quantitative diffusion tensor imaging and tractography. Neuroimage. 2006;30:1121–1132. doi: 10.1016/j.neuroimage.2005.11.022. [DOI] [PubMed] [Google Scholar]
- Dubois J, Dehaene-Lambertz G, Perrin M, Mangin JF, Cointepas Y, Duchesnay E, Le Bihan D, Hertz-Pannier L. Asynchrony of the early maturation of white matter bundles in healthy infants: quantitative landmarksrevealed noninvasively by diffusion tensor imaging. Hum Brain Mapp. 2008;29:14–27. doi: 10.1002/hbm.20363. [DOI] [PMC free article] [PubMed] [Google Scholar]
- Dudink J, Larkman DJ, Kapellou O, Boardman JP, Allsop JM, Cowan FM, Hajnal JV, Edwards AD, Rutherford MA, Counsell SJ. High b-value diffusion tensor imaging of the neonatal brain at 3T. AJNR Am J Neuroradiol. 2008;29:1966–1972. doi: 10.3174/ajnr.A1241. [DOI] [PMC free article] [PubMed] [Google Scholar]
- Gilles FH. Myelinated tracts: growth patterns. Boston, Bristol, London: John Wright PSG Inc.; 1983. [Google Scholar]
- Gilmore JH, Lin W, Corouge I, Vetsa YS, Smith JK, Kang C, Gu H, Hamer RM, Lieberman JA, Gerig G. Early postnatal development of corpus callosum and corticospinal white matter assessed with quantitative tractography. AJNR Am J Neuroradiol. 2007;28:1789–1795. doi: 10.3174/ajnr.A0751. [DOI] [PMC free article] [PubMed] [Google Scholar]
- Girard N, Raybaud C, Poncet M. In vivo MR study of brain maturation in normal fetuses. AJNR Am J Neuroradiol. 1995;16:407–413. [PMC free article] [PubMed] [Google Scholar]
- Graven SB. Visual development in the human fetus, infant, and young child. Newborn and Infant Nurs Rev. 2008;8:194–201. [Google Scholar]
- Hayat TT, Nihat A, Martinez-Biarge M, McGuinness A, Allsop JM, Hajnal JV, Rutherford MA. Optimization and initial experience of a multisection balanced steady-state free precession cine sequence for theassessment of fetal behavior in utero. AJNR Am J Neuroradiol. 2010;32:331–338. doi: 10.3174/ajnr.A2295. [DOI] [PMC free article] [PubMed] [Google Scholar]
- Huang H, Xue R, Zhang J, Ren T, Richards LJ, Yarowsky P, Miller MI, Mori S. Anatomical characterization of human fetal brain development with diffusion tensor magnetic resonance imaging. J Neurosci. 2009;29:4263–4273. doi: 10.1523/JNEUROSCI.2769-08.2009. [DOI] [PMC free article] [PubMed] [Google Scholar]
- Jiang S, Xue H, Glover A, Rutherford M, Rueckert D, Hajnal JV. MRI of moving subjects using multislice snapshot images with volume reconstruction (SVR): application to fetal, neonatal, and adult brain studies. IEEE Trans Med Imaging. 2007;26:967–980. doi: 10.1109/TMI.2007.895456. [DOI] [PubMed] [Google Scholar]
- Jiang S, Xue H, Counsell S, Anjari M, Allsop J, Rutherford M, Rueckert D, Hajnal JV. Diffusion tensor imaging (DTI) of the brain in moving subjects: application to in-utero fetal and ex-utero studies. Magn Reson Med. 2009;62:645–655. doi: 10.1002/mrm.22032. [DOI] [PubMed] [Google Scholar]
- Kasprian G, Brugger PC, Weber M, Krssak M, Krampl E, Herold C, Prayer D. In utero tractography of fetal white matter development. Neuroimage. 2008;43:213–224. doi: 10.1016/j.neuroimage.2008.07.026. [DOI] [PubMed] [Google Scholar]
- Kim DH, Chung S, Vigneron DB, Barkovich AJ, Glenn OA. Diffusion-weighted imaging of the fetal brain in vivo. Magn Reson Med. 2008;59:216–220. doi: 10.1002/mrm.21459. [DOI] [PubMed] [Google Scholar]
- Kinney HC, Brody BA, Kloman AS, Gilles FH. Sequence of central nervous system myelination in human infancy. II. Patterns of myelination in autopsied infants. J Neuropathol Exp Neurol. 1988;47:217–234. doi: 10.1097/00005072-198805000-00003. [DOI] [PubMed] [Google Scholar]
- Lebel C, Rasmussen C, Wyper K, Andrew G, Beaulieu C. Brain microstructure is related to math ability in children with fetal alcohol spectrum disorder. Alcohol Clin Exp Res. 2009;34:354–363. doi: 10.1111/j.1530-0277.2009.01097.x. [DOI] [PubMed] [Google Scholar]
- Lobel U, Sedlacik J, Gullmar D, Kaiser WA, Reichenbach JR, Mentzel HJ. Diffusion tensor imaging: the normal evolution of ADC, RA, FA, and eigenvalues studied in multiple anatomical regions of the brain. Neuroradiology. 2009;51:253–263. doi: 10.1007/s00234-008-0488-1. [DOI] [PubMed] [Google Scholar]
- Mori S, Zhang J. Principles of diffusion tensor imaging and its applications to basic neuroscience research. Neuron. 2006;51:527–539. doi: 10.1016/j.neuron.2006.08.012. [DOI] [PubMed] [Google Scholar]
- Pajevic S, Pierpaoli C. Color schemes to represent the orientation of anisotropic tissues from diffusion tensor data: application to white matter fiber tract mapping in the human brain. Magn Reson Med. 1999;42:526–540. [PubMed] [Google Scholar]
- Partridge SC, Mukherjee P, Henry RG, Miller SP, Berman JI, Jin H, Lu Y, Glenn OA, Ferriero DM, Barkovich AJ, et al. Diffusion tensor imaging: serial quantitation of white matter tract maturity in premature newborns. Neuroimage. 2004;22:1302–1314. doi: 10.1016/j.neuroimage.2004.02.038. [DOI] [PubMed] [Google Scholar]
- Prayer D, Prayer L. Diffusion-weighted magnetic resonance imaging of cerebral white matter development. Eur J Radiol. 2003;45:235–243. doi: 10.1016/s0720-048x(02)00312-1. [DOI] [PubMed] [Google Scholar]
- Provenzale JM, Liang L, DeLong D, White LE. Diffusion tensor imaging assessment of brain white matter maturation during the first postnatal year. AJR Am J Roentgenol. 2007;189:476–486. doi: 10.2214/AJR.07.2132. [DOI] [PubMed] [Google Scholar]
- Righini A, Bianchini E, Parazzini C, Gementi P, Ramenghi L, Baldoli C, Nicolini U, Mosca F, Triulzi F. Apparent diffusion coefficient determination in normal fetal brain: a prenatal MR imaging study. AJNR Am J Neuroradiol. 2003;24:799–804. [PMC free article] [PubMed] [Google Scholar]
- Righini A, Doneda C, Parazzini C, Arrigoni F, Matta U, Triulzi F. Diffusion tensor imaging of early changes in corpus callosum after acute cerebral hemisphere lesions in newborns. Neuroradiology. 2010;52:1025–1035. doi: 10.1007/s00234-010-0745-y. [DOI] [PubMed] [Google Scholar]
- Rousseau F, Glenn O, Iordanova B, Rodriguez-Carranza C, Vigneron D, Barkovich J, Studholme C. A novel approach to high resolution fetal brain MR imaging. Med Image Comput Comput Assist Interv. 2005;8:548–555. doi: 10.1007/11566465_68. [DOI] [PubMed] [Google Scholar]
- Rousseau F, Glenn OA, Iordanova B, Rodriguez-Carranza C, Vigneron DB, Barkovich JA, Studholme C. Registration-based approach for reconstruction of high-resolution in utero fetal MR brain images. Acad Radiol. 2006;13:1072–1081. doi: 10.1016/j.acra.2006.05.003. [DOI] [PubMed] [Google Scholar]
- Schneider JF, Confort-Gouny S, Le Fur Y, Viout P, Bennathan M, Chapon F, Fogliarini C, Cozzone P, Girard N. Diffusion-weighted imaging in normal fetal brain maturation. Eur Radiol. 2007;17:2422–2429. doi: 10.1007/s00330-007-0634-x. [DOI] [PubMed] [Google Scholar]
- Song SK, Sun SW, Ramsbottom MJ, Chang C, Russell J, Cross AH. Dysmyelination revealed through MRI as increased radial (but unchanged axial) diffusion of water. Neuroimage. 2002;17:1429–1436. doi: 10.1006/nimg.2002.1267. [DOI] [PubMed] [Google Scholar]
- Vasung L, Huang H, Jovanov-Milosevic N, Pletikos M, Mori S, Kostovic I. Development of axonal pathways in the human fetal fronto-limbic brain: histochemical characterization and diffusion tensor imaging. J Anat. 2010;217:400–417. doi: 10.1111/j.1469-7580.2010.01260.x. [DOI] [PMC free article] [PubMed] [Google Scholar]
- Vasung L, Jovanov-Milosevic N, Pletikos M, Mori S, Judas M, Kostovic I. Prominent periventricular fiber system related to ganglionic eminence and striatum in the human fetal cerebrum. Brain Struct Funct. 2011;215:237–253. doi: 10.1007/s00429-010-0279-4. [DOI] [PubMed] [Google Scholar]
- Volpe JJ. Neurology of the newborn. 5th ed. Philadelphia: Philadelphia Elselvier; 2008. [Google Scholar]
- Widjaja E, Geibprasert S, Blaser S, Rayner T, Shannon P. Abnormal fetal cerebral laminar organization in cobblestone complex as seen on post-mortem MRI and DTI. Pediatr Radiol. 2009;39:860–864. doi: 10.1007/s00247-009-1255-0. [DOI] [PubMed] [Google Scholar]
- Wozniak JR, Muetzel RL, Mueller BA, McGee CL, Freerks MA, Ward EE, Nelson ML, Chang PN, Lim KO. Microstructural corpus callosum anomalies in children with prenatal alcohol exposure: an extension of previous diffusion tensor imaging findings. Alcohol Clin Exp Res. 2009;33:1825–1835. doi: 10.1111/j.1530-0277.2009.01021.x. [DOI] [PMC free article] [PubMed] [Google Scholar]
- Yamamoto A, Miki Y, Urayama S, Fushimi Y, Okada T, Hanakawa T, Fukuyama H, Togashi K. Diffusion tensor fiber tractography of the optic radiation: analysis with 6-, 12-, 40-, and 81-directional motion-probing gradients, a preliminary study. AJNR Am J Neuroradiol. 2007;28:92–96. [PMC free article] [PubMed] [Google Scholar]