

Abstract
Next-gen sequencing technologies have revolutionized data collection in genetic studies and advanced genome biology to novel frontiers. However, to date, next-gen technologies have been used principally for whole genome sequencing and transcriptome sequencing. Yet many questions in population genetics and systematics rely on sequencing specific genes of known function or diversity levels. Here, we describe a targeted amplicon sequencing (TAS) approach capitalizing on next-gen capacity to sequence large numbers of targeted gene regions from a large number of samples. Our TAS approach is easily scalable, simple in execution, neither time-nor labor-intensive, relatively inexpensive, and can be applied to a broad diversity of organisms and/or genes. Our TAS approach includes a bioinformatic application, BarcodeCrucher, to take raw next-gen sequence reads and perform quality control checks and convert the data into FASTA format organized by gene and sample, ready for phylogenetic analyses. We demonstrate our approach by sequencing targeted genes of known phylogenetic utility to estimate a phylogeny for the Pancrustacea. We generated data from 44 taxa using 68 different 10-bp multiplexing identifiers. The overall quality of data produced was robust and was informative for phylogeny estimation. The potential for this method to produce copious amounts of data from a single 454 plate (e.g., 325 taxa for 24 loci) significantly reduces sequencing expenses incurred from traditional Sanger sequencing. We further discuss the advantages and disadvantages of this method, while offering suggestions to enhance the approach.
Keywords: Next-gen sequencing, targeted amplicon sequencing, multiplex identifier, barcode, phylogenetics, population genetics, molecular systematics, Crustacea
Introduction
Next-generation sequencing is revolutionizing evolutionary biology, and the technology is likely to become more cost effective, faster, and widely available in the near future (Mardis 2008). Using these technologies has allowed for genome sequencing of many nonmodel organisms on a scale never before possible. Although the race to generate full genomes is progressing rapidly, the ability to fully maximize the technology has lagged behind (Lennon et al. 2010). Specifically, there are many systematic and population genetic applications that would benefit by having sequence data from a large number of samples for specific genes rather than whole genomes. In these fields, researchers have identified genes of particular interest (e.g., population genetic studies of specific genes, Naj et al. 2011; systematic studies targeting genes of particular divergence levels, Regier et al. 2010) and the research goal is to sequence these genes from thousands of individuals.
The question then becomes how can we capitalize on the next-gen platform to accommodate this targeted gene sequencing for a large volume of samples? Approaches using multiplexing identifiers (MIDs) or barcodes for targeting specific gene regions are becoming more scalable, fully automated, and efficient (e.g., Meyer et al. 2007 compared with Lennon et al. 2010), but we lack an inexpensive and fast approach that allows for rapid library preparation using a standard polymerase chain reaction (PCR) product of specific genes or gene regions via PCR for targeted next-gen sequencing. Such an approach would be ideal for use in higher level phylogenetics and population genetics and has broad application across biological disciplines (e.g., nuclear mitochondrial psuedogenes research [Song et al., 2008], DNA barcoding [Hebert et al. 2004; Kress et al. 2005], gene family evolution [Whipple et al. 2010; Briscoe et al. 2010], and resequencing [Romeo et al. 2007; Turner et al. 2010]).
A variety of approaches have been proposed to harness the power of this next-gen technology for targeted sequencing (e.g., Binladen et al. 2007; Crosby and Criddle 2007; Meyer et al. 2007; Meyer et al. 2008; Pertoldi et al. 2009). The first approach ligates an MID to the end of an amplicon but is costly and time consuming (Meyer et al. 2007). The second uses PCR to attach an MID (Binladen et al. 2007) but is exceptionally expensive because it requires the purchase of long primers (35–55 bp, depending on application) for every combination of primer and barcode to match each sample used in the study (e.g., 12 samples × 12 loci would require a total of 288 primer pairs). Another approach to amplicon sequencing supported by Fluidigm Corporation is similar to what is proposed herein (e.g., Pertoldi et al. 2009) but requires a costly initial investment and is not optimized for phylogenetic applications, especially those focused at higher taxonomic levels. This approach also does not offer researchers full control of PCR protocols and reagents, an absolutely essential part of doing any phylogenetics project, especially at these higher levels (e.g., ordinal, superfamily, etc.). A popular approach for targeted sequencing is sequence capture (e.g., Crosby and Criddle 2007). Although this method is suitable for studies on model organisms, closely related species, or groups of organisms where loci of interest are relatively conserved (e.g., vertebrate groups), it will likely not be successful assessing diversity in a broad set of organisms due to DNA sequence divergence (e.g., the broad diversity of species within Pancrustacea).
Because these methods are time consuming and costly, they are not viable options for a smaller PCR lab. Alternative approaches are not optimized for higher level phylogenetics or population genetics, where thousands of samples and potentially hundreds of loci could be used to generate a single phylogenetic estimate (e.g., Soltis et al. 2000; Goloboff et al. 2009; Kauwe et al. 2010; Lam et al. 2010; Regier et al. 2010; Rubin et al. 2010) because they require that each library for each sample be carefully prepared and/or conditions optimized to maximize results (e.g., nonscalable). Thus, next-gen technology still lacks a reliable method for targeted sequencing that is easily scalable, neither time nor labor intensive, relatively inexpensive, and can be applied to a broad diversity of organisms and/or genes.
We have developed a targeted amplicon sequencing (TAS) approach that is simple and cost effective. TAS is a two-step PCR process that allows researchers to amplify a targeted gene region (amplicon) using traditional PCR, followed by an additional PCR that attaches a known 10 bp tag, barcode, or MID to identify amplicons from different samples (taxa, in our case). This method results in tagged amplicons that are ready to be directly sequenced using a next-gen platform (for our purposes 454 is the most cost effective), without extensive amplicon preparation steps (e.g., several rounds of ligation and purification) or purchasing every possible combination of MID-locus specific primer. Also, this method allows researchers to have complete control of PCR protocols (e.g., temperatures, desired reagents, and reagent concentration) and is fully scalable, while still generating an MID tagged amplicon library.
Phylogenetics and population genetics are fields of science extremely dependent on both quality and quantity of DNA sequence data, as both disciplines provide more robust results by including more genes (i.e., more loci) and operational taxonomic units (OTUs) (Graybeal 1998; Hillis 1998; Mitchell et al. 2000; Wiens 2006; Baurain et al. 2007). Next-gen sequencing can be used to create a large volume of sequence data for potentially thousands of OTUs across hundreds of loci. To date, no other method has effectively applied the power of this technology to systematics or population genetics. Here, we present a novel molecular method that holds promise for TAS in a highly parallel fashion. An associated bioinformatics approach for efficiently analyzing the high volume of data from TAS is also presented. Although our approach is generally applicable to both population genetic and systematic questions, we focus on the question of pancrustacean relationships to demonstrate the utility of targeted amplicon next-gen sequencing.
Materials and Methods
PCR Primer Design
Two different primer pairs were designed for PCR 1 (locus specific amplification) and PCR 2 (OTU-specific MID attachment) (Fig. 1A and B). From 5′ to 3′, the primer pair for PCR 1 was composed of an adapter of 21 bp (GAA GGT GAC CAA GTT CAT GCT) provided by Fluidigm Inc. and a locus specific forward and reverse primer, usually 20–25 bp in length (see Targeted Genes). From 5′ to 3′, the primer pair for PCR 2 was composed of the forward or reverse 21-bp Titanium 454 primer plus a 4-bp key, a 10-bp MID (Roche Technical Bulletin No. 005-2009), and the 21-bp adapter. The adapter was attached to all primers used in PCR 1 (Fig. 1A) so that we could then attach any barcode or combination of barcodes desired during PCR 2 (Fig. 1B). Uncoupling the primers in this fashion allowed for tremendous freedom when attaching MIDs to amplicons and reduced the number of primers needed.
FIG. 1.—

PCR-based library preparation for targeted sequencing. (A) During PCR 1, a locus specific primer amplifies a targeted region of DNA while also attaching an adapter sequence that has been incorporated at the end of the locus specific primer. (B) PCR 2 uses the adapter sequence attached during PCR 1 and adds desired barcode and 454 primer resulting in amplicon libraries ready for purification, quantification, pooling (C), and subsequent emPCR. (C) Following pyrosequencing reads are separated via MID and provided to BarcodeCruncher for further refinement before phylogenetic reconstruction.
PCR Protocols
PCR 1 consisted of a standard three-step PCR protocol (i.e., denaturation, annealing, and extension) using gDNA + a locus specific primer + adapter resulting in an amplicon with the adapter attached at the 5′ end (Fig. 1A). Reactions were performed in 10 μl volumes containing 10-μM forward and reverse primer for each gene, red dye, PCR 5× buffer, 1-unit Taq polymerase (AccuPrime [2U/μl]), and 30–100 ng/μl extracted DNA. The thermal cycling profile conformed to the following parameters: initial denaturation for 1–2 min at 94 °C followed by 25–40 cycles of 30 s at 94 °C, 45 s at 46–58 °C (depending on gene region), 1 min at 72 °C, and a final extension of 10 min at 72 °C. PCR 1 was cleaned using ExoSap following manufacturer's instructions. One microliter of cleaned PCR product was used as the template for PCR 2. The protocol for PCR 2 followed PCR 1 with primers composed of a universal adapter + 10-bp taxon/sample specific barcode (Roche Technical Bulletin No. 005-2009) + 4-bp primer key (used to determine the quality of the read) + the forward or reverse 21-bp Titanium 454 primer (Fig. 1C). PCR 2 resulted in an amplicon with MID attached at both ends. Primers were digested from 10 μl of PCR 2 products using Exosap. Directly following primer digestion, a Sephadex cleanup was performed to remove any remaining small DNAs. The amount of double stranded DNA in each PCR 2 product was then measured using Quant-iT PicoGreen on a Fusion αHT Packard BioScience Company laser plate reader with the following settings: intensity = 5, time per row = 0.1, read per well = 1, high intensity (due to the expected high amounts of DNA). From this information, an EPmotion Robotics system from Eppendorf was used to normalize all PCR 2 products at 14 ng/μl (our cutoff of minimum DNA concentration for inclusion on the 454 run). From these standardized products, we pooled each sample according to the targeted gene region. To further purify the amplicons before 454 sequencing, a gel purification followed by AMpure bead purification was performed (done by the Brigham Young University [BYU] DNA sequencing facility) for each pooled sample. This was done to exclude remaining primers and primer dimers within the samples as the small molecular weight DNAs are preferentially bound and amplified during emPCR. Also, to avoid preferential amplification of shorter targeted sequences over the longer targeted sequences, each targeted gene region was amplified individually. Lastly, emPCR products were pooled and multiplexed using 454 pyrosequencing technology.
Bioinformatics
In order to deal with the large volume of data generated from the next-gen sequencing run, we developed a bioinformatics pipeline to computationally clean, trim, group, analyze, and simplify sequence data—dubbed BarcodeCruncher (available at: http://crandalllab.byu.edu/ComputerSoftware.aspx). The BarcodeCruncher pipeline begins by extracting the raw DNA sequence reads from the SFF (Standard Flowgram Format) output files generated from the 454 sequencer, separating each read into a FASTA file (Pearson and Lipman 1988) using its accompanying barcode. The separation process was performed by using the “sfffile” program found in the Genome Sequence Data Analysis Software package (http://www.genome-sequencing.com/).
Because the MIDs are designed with a difference of at least four nucleotides between each other, it is possible to easily “correct” up to one nucleotide error in the barcode (TB-0905 Roche MID Adaptors) without a decrease in accuracy. An error rate of zero or one nucleotide was allowed in the barcode to diminish the amount of data lost and to examine the amount of data recovered due to barcode “correction.” We found that allowing two nucleotide errors in barcodes resulted in large poor-quality data outputs.
Following the separation of each read into individual FASTA files representing each barcode, further contaminant control and adapter and primer removal was performed. This process left the reads clean of any contaminating unwanted sequence data. Next, the name of each barcode was replaced by the name of the corresponding taxon to make following the workflow of BarcodeCruncher much more intuitive.
Because the genes sequenced on the 454 were targeted or known, a local database of related query sequences gathered from GenBank was constructed to perform a Blast (Altschul et al. 1990) search for each read from each file. The Blast sorted each read into bins according to species (using MIDs) and gene (using Blast results), while further reducing contamination. All reads scoring an e-value greater than 1e-5 were discarded under the assumption that these were either poor-quality or contaminant reads. Because read lengths vary considerably and short reads have the possibility of randomly matching in a Blast comparison against the query samples, only trimmed reads of 100 bp or longer were used in the analysis.
Contigs were assembled from the individual sequence reads after being separated according to barcode/MID and gene. The contigs were created using the GS De Novo Assembler (Newbler) found in the Genome Sequence Data Analysis Software package (http://www.genome-sequencing.com/). The final function of BarcodeCruncher was to compress each contig into a consensus sequence and deposit these sequences into a FASTA file for each of the corresponding genes selected for the analysis (e.g., 28S mapped sequences from all species were all combined into a single FASTA file).
Following assembly, BarcodeCruncher analyzed both the best (lowest e-value) single read and assembled contig for each barcode and targeted gene to determine which had the highest overall quality. Using a combination of both sequence length and e-values, the sequence (resulting from either a single read or assembled contig) with the best-combined score for each taxon was returned to the appropriate final FASTA gene file for alignment and phylogenetic analysis. Additionally, data from each of the above steps (in the form of FASTA files) are accessible by the user for analysis and verification.
The following criteria were used for selection:
If either the assembled or single read sequence was both longer and had a lower e-value, it was selected.
The assembled sequence was selected if it was at least 2.5% longer than the unassembled sequence and had an e-value less than 1e-20.
The assembled sequence was selected if it was at least 5% longer than the best unassembled sequence with an e-value no more than twice that of the best unassembled sequence.
These selection criteria were chosen, as they seemed to provide a properly weighted balance between sequence length and accuracy for our project. The selection criteria attempted to make a reasonable choice when presented with assembled sequences that are significantly longer but result in a lower e-value. Users can alter these parameters to allow BarcodeCruncher to be either more stringent or relaxed in its selection of the best-assembled sequences over the best unassembled sequence for each species and gene. After sequence selection, information on the number of sequences for each species and gene as well as sequence scoring information for each step is output for easy user access and independent verification. The BarcodeCruncher log file provides the user with insight as to why each sequence was chosen over the alternative; using this, users can make their own informed decision and choose alternate sequences when deemed appropriate using BarcodeCruncher's archive of data from each processing step.
To streamline the use of BarcodeCruncher, the program was configured to use a control file. Use of the “-control” option on the command line automatically created the template for the control file. The control file accepts all of the data necessary to correctly run the experiment and create usable barcode data. All analyses were performed at the Fulton Supercomputing Lab at BYU on the marylou5 supercomputer (http://marylou.byu.edu/).
Filters
There are two types of informatic “filters” used by the 454 platform to identify poor reads, one designed for shotgun sequencing and another for amplicon sequencing. In essence, the shotgun filter identifies poor sequence data at the end of an individual read and trims the read back by removing base pairs until the read is acceptable to pass the filter, whereas the amplicon filter simply rejects any sequences that do not pass the minimum filter requirements. We filtered our 454 data output with both the shotgun and amplicon filters using the default settings and compared the resulting number of reads from both approaches. Because the number of reads alone is not a good measure of which filter might be superior in producing sequence data suitable for phylogenetics, the files produced from each filter were examined for average read length and number of contigs assembled (table 1).
Table 1.
Comparison of the 454 Bioinformatic Amplicon Filter versus Shotgun Filter
| Amplicon (Ambiguity = 1) | Shotgun (Ambiguity = 0) | Shotgun (Ambiguity = 1) | |
| Total number of reads | 211,633 | 221,347 | 221,347 |
| Number of rejected reads (no Blast hit) | 5,995 | 10,039 | 10,009 |
| Number of rejected short reads (>100 bp) | 8,396 | 9,499 | 9,545 |
| Average length of best read (bp) | 260.82 | 304.65 | 306.61 |
| Average length of used reads | 209.44 | 234.18 | 234.31 |
| # Of unique assembled contigs | 438 | 483 | 469 |
Plate Efficiency
A quarter of a 454 plate was used to generate the data in this analysis. To explore the efficiency of our method, that is the minimum size portion of a plate that would still recover an equal amount of data, a fractional analysis was performed (assuming that read number and distribution are linearly correlated). This was done by randomly selecting a specified fraction (i.e., one-eighth, one-fourth, and one-half) of the total number of reads from each file (amplicon and shotgun filtered files) and rerunning BarcodeCruncher on each fraction. From the fractional analysis, it is possible to examine just how efficiently future runs using the method outlined herein can be performed and how many more loci and/or taxa we could have included on a single 454 plate.
Targeted Genes
Phylogenetic studies within the Pancrustacea commonly target six genes that are relatively easy to isolate, amplify, and sequence (via Sanger methods) and are phylogenetically informative across our target group. These genes include 16S, large mitochondrial ribosomal subunit (∼550 bp, Crandall and Fitzpatrick 1996); 12S, small mitochondrial ribosomal subunit (∼400 bp, Buhay et al. 2007); 18S, small nuclear ribosomal subunit (∼1,900 bp, Whiting et al. 1997; Whiting 2002); 28S, large nuclear ribosomal subunit (∼2,500 bp, Whiting et al. 1997; Whiting 2002; Toon et al. 2009); H3, nuclear protein-coding gene (∼330 bp, Colgan et al. 1998); and COI, mitochondrial protein-coding gene (∼600 bp, Folmer et al. 1994).
Taxon Sampling
Our taxon sampling consists of 44 taxa from Pancrustacea (Appendix 1, Supplementary Material online). These taxa represent 16 decapods (one museum specimen preserved in 70% ETOH at room temperature for ∼20 years), eight insects, four brachiopods, two cumaceans, three stomatopods, four isopods, a tanaidacean, five mysidaceans, and one lophogastrid. Outgroup taxa consisted of a chelicerate (Damon annulatipes) and a myriapod (Dendrothereua homa).
Phylogenetics
We performed a phylogenetic analysis to fully understand the effectiveness of the barcoding process in producing quality sequence data (reads of 200 bp and longer were deposited in GenBank under accession numbers (JN800510–JN800720). The entire data set is available at the Crandall Lab Website: http://crandalllab.byu.edu/Publications.aspx). The FASTA files output from the BarcodeCruncher pipeline were used to generate an alignment for each gene using MAFFT v6.713b (Katoh et al. 2005). The “E-INS-i” alignment option was used for all alignments because it was suspected that the relatively small sized barcode sequence reads could potentially align into multiple conserved domains with long gaps in between. To further enhance the quality of the alignments and to eliminate regions of poor arrangement, each alignment was curated using Gblocks v0.91b (Castresana 2000). Options allowing for a less stringent blocking of the alignments were selected to decrease the amount of data lost to curation. All gene alignments were then concatenated into one large partitioned data set (∼5 kb).
Phylogenetic trees were created using RAxML 7.0.4 (Stamatakis et al. 2005), a fast maximum likelihood (ML) phylogenetic program, and MrBayes (Ronquist and Huelsenbeck 2003). The RAxML algorithms used in the analysis were the “-f a” and “-f d” options, and the likelihoods were compared to select the best tree. Likelihood settings followed the General Time Reversible Model with a gamma distribution (see Posada and Crandall 2001). RAxML estimated all free parameters for each of the partitioned data sets. Confidence in the resulting topology was assessed using nonparametric bootstrap estimates (Felsenstein 1985) with 10,000 bootstraps replications. MrBayes v3.1.2b4 (Ronquist and Huelsenbeck 2003) was run using three independent Bayesian analyses, each with 4 chains to check for convergence. Each analysis ran for 10,000,000 generations, sampling one tree every 1000 generations. To ensure that independent analyses converged on similar values, we graphically compared all likelihood parameters and scores (means and variances) using the program Tracer v1.4 (Drummond and Rambaut 2007). Burn-in and stationary distributions were determined by observing the likelihood (-LnL) scores and split frequencies for the data (∼10 million generations). A 50% majority-rule consensus tree was obtained from the remaining saved trees, once the data reached convergence. Posterior probabilities (Pp) for clades were compared for congruence and post–burn in trees were combined between individual runs. Pp values > 0.50 are presented on the ML phylogram (presented as percentages). All analyses were run on the Fulton Supercomputing computing cluster (Marylou6 Dell PowerEdge M610) at BYU.
Results
We used a total of 44 taxa to sequence six genes (12S, 16S, 18S, 28S, COI, and H3) simultaneously on a quarter plate using 454 pyrosequencing technology (Appendix 1, Supplementary Material online). Because 18S and 28S genes are longer than what the 454 is capable of sequencing (i.e., longer than 400 bp), these genes were divided into four overlapping regions of 400–600 bp for the two-step PCR process (resulting in 12 total amplicons). By sequencing overlapping or “tiled” amplicons for a larger gene, it was possible to assemble full-length genes. We recovered sequence data for ∼85% of the amplicons resulting from PCR 2 that were sequenced on the quarter 454 plate (table 2). Gene regions of less than 600 bp (i.e., those of optimal length for the 454 platform) yielded very different recovery percentages compared with those that were longer than 600 bp (table 2), with longer gene regions having reduced recovery rates. Ninety percentage of optimally sized amplicons were recovered (193 out of 215). Nonoptimally sized amplicons were recovered at only ∼80%. Additionally, the shotgun filter allowed for 9,714 more reads than the amplicon filter (table 1). For our phylogenetic purposes, where only a single high-quality read is enough to include in an alignment, an additional 10,000 reads is potentially exceptionally important data. The fractional analysis (i.e., randomly sampling one-eighth, one-fourth, and one-half of the reads generated in our 454 run and analyzing these reads to determine the number of total consensus sequences that were lost following the BarcodeCruncher pipeline) indicated that double the number of amplicons could have been included (or the same amount of amplicons could have been generated on an eighth of a 454 plate) and only minimal loss of data would have resulted (i.e., three amplicon sequences; table 3). Because the one-half fractional analysis resulted in a similar amount of contigs and consensus sequences as the total 454 run, we took the total number of reads generated from the one-half fractional analysis and divided this amount by the total number of taxa and targeted loci. The result provided an estimate of approximate coverage needed to produce a solid consensus sequence of a targeted locus for phylogenetic analysis. We estimate one needs ∼135× to create a robust consensus sequence for each targeted gene region. By examining the number of reads returned per barcode and performing a two-tailed test, we discovered that barcodes with high GC content returned significantly fewer reads (P value = 0.05).
Table 2.
(A) Amplicons Provided (“P”) to the 454 and Reads Recovered “R” for Each Targeted Gene Region and (B) Percentages Returned, Averaged Read Length, and Average Number of Reads for Amplicons of Optimal 454 Size versus Nonoptimal 454 Size
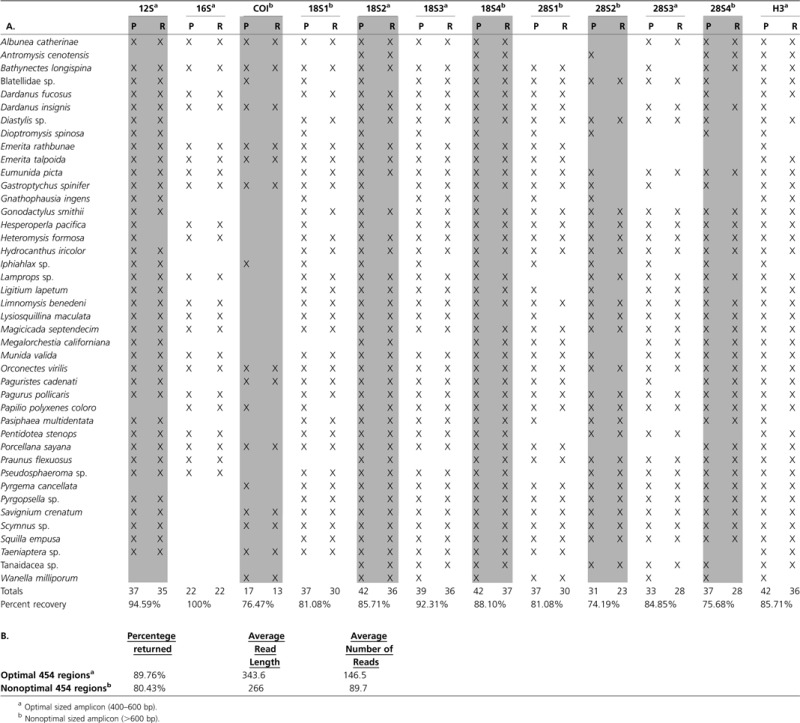 |
Table 3.
Fractional Analysis of Raw Returned 454 Sequence Data
| Shotgun |
Amplicon |
|||||||
| Total Reads | One-Half Reads | One-Fourth Reads | One-Eighth Reads | Total Reads | One-Half Reads | One-Fourth Reads | One-Eighth Reads | |
| Raw reads | 221,347 | 110,674 | 55,337 | 27,668 | 211,633 | 105,817 | 52,908 | 26,454 |
| Provided to BarcodeCruncher | 219,879 | 109,943 | 54,994 | 27,487 | 210,321 | 105,156 | 52,577 | 26,320 |
| Blasted to reference sequence | 56,021 | 24,641 | 12,789 | 7,044 | 37,782 | 17,481 | 10,905 | 6,076 |
| % Used reads | 99.34% | 99.34% | 99.38% | 99.35% | 99.38% | 99.38% | 99.37% | 99.49% |
| % Blasted | 25.31% | 22.26% | 23.11% | 25.46% | 17.85% | 16.52% | 20.61% | 22.97% |
Although the focus of this paper was on the potential of TAS, the phylogenetic estimate is robust with excellent backbone support (Figure 2) and resembles the current understanding of pancrustacean relationships (e.g., Regier et al. 2008, 2010). The data matrix consisted of 3,692 bp following curation with Gblocks v0.91b (Castresana 2000) (12S = 440 bp; 16S = 441 bp; 18S bp = 1,105; 28S bp = 748 bp; COI = 552 bp; and H3 = 406) and recovered the monophyly of all major groups (e.g., Insecta, Decapoda, Cirripedia, Stomatopoda, and Peracarida).
FIG. 2.—

Phylogenetic estimate of targeted sequence data. All data associated with in-group taxa were generated using 454 pyrosequencing technology. ML phylogram reflecting the topology recovered from both Bayesian and RAxML analyses. Bayesian topology had polytomies at nodes with little support, but all other nodes/relationships were in common. Bootstrap supports >70% and posterior probabilities >90% are shown below and above each branch, respectively.
Discussion
Filters: Shotgun versus Amplicon
We found that bypassing the amplicon filter and using the shotgun filter during 454 postinformatic processing for our purposes of phylogeny estimation provided more reads (∼10,000; table 1). These additional reads increased length of the assembled contigs by an average of 46 or 25 bp depending on ambiguity level (table 1). The shotgun filter also recovered 31 additional contigs following assembly of the data that were not found from the amplicon filtered data.
MIDs (Barcodes)
Repair
Due to 454 sequencing error, some barcodes contained ambiguities in the 10-bp barcode sequence. In some instances, reads that pass through the initial 454 filter but contain ambiguities in the barcode itself can be included in final analyses. This is possible because barcodes are constructed to have at least a four-nucleotide difference (Roche Technical Bulletin No. 005-2009). Thus, a barcode can be “repaired” as long as there are two or fewer ambiguities. We ran BarcodeCruncher on the data set generated from the shotgun filter while allowing for zero or one ambiguity. For most barcodes there was no significant increase in reads when the ambiguity in the barcode was allowed to vary (Appendix 1, Supplementary Material online).
Consistency and Bias
In order to investigate the consistency among barcodes, we attached different barcodes to the same PCR 1 product during PCR 2 (Appendix 1, Supplementary Material online). This was done for seven different PCR 1 products, each consisting of four to five different barcodes. In total, we were able to look at the relative consistency of 30 different barcodes. Although the number of recovered reads was consistent across nearly all barcodes, several barcodes recovered radically different read numbers when compared with others from the same PCR product (Appendix 1, Supplementary Material online). For example, we barcoded PCR 1 products for all 12 targeted gene regions from a squat lobster (Anomura), Gastroptychus spinifer, using barcodes 4–8 (Roche). Three of the MIDs produced reads in excess of 2,200 (MIDs 5–7; 2,524, 2,204, 2,565, respectively), whereas MIDs 4 and 8 produced only 466 and 621 reads, respectively. Barcode 8 likely performed poorly because of its GC content of 70%, yet there is no clear reason as to why barcode 4 also performed poorly. The 454 platform is biased against high GC content sequences. Sequences with high GC content are less likely to be sequenced as compared with more AT rich sequences. Interestingly, our results suggest that this bias can be within the first 30 bp after leaving the Titanium primer (P value = 0.05).
We acknowledge that these results also depend on perfect pipetting of reagents and PCR products during PCR 1 and 2, sample pooling, and sample preparation for the 454. Because we specifically wanted to make a method that was easily executed in the lab, with the exception of normalizing DNAs before pooling, all work was performed by hand in plate format with a multichannel pipette.
Efficiency
Plate Efficiency
Using a targeted sequencing approach and the 454 platform, it is possible to multiplex 325 taxa × 24 targeted loci at 135× coverage on a single 454 plate. This estimate is conservative as the 135× coverage is likely an overestimate and includes an ∼12% error rate. Assuming an error rate of 12% (our preliminary results recovered an error rate of 15%), it is possible to sequence 325 taxa × 24 loci at 135× coverage for $7,500.00 (the cost of a single 454 plate). To sequence the same amount of data, but producing only two reads (i.e., forward and reverse) per locus, using traditional Sanger methods (assuming a very conservative error rate of 5%) at a cost of $2.50 per read (including cycle sequencing) the cost is $40,950. Thus, targeted sequencing offers a savings of ∼80% over traditional Sanger methods when comparing the amount of data. Because Sanger sequences are generally longer than 454 sequences (650–800 bp and 400–450 bp, respectively) a per base pair comparison of 454 sequencing versus traditional Sanger sequencing is a more fair comparison. Nonetheless, a cost savings of 45% per bp (454 = 0.003 ¢/bp vs. Sanger = 0.0066 ¢/bp) is possible with 454 amplicons sequencing. With further refinement of the method (e.g., an enhanced ability to remove small DNA fragments, performing PCRs at 5 μl) and improved read length with 454-PLUS or among third generation next-gen platforms (e.g., PacBio), we anticipate improving the failure rate to between 5% and 10%. Not included in this savings of 80% is the fact that all PCRs for the approach outlined herein are conducted at 10 μl making the PCR portion of data generation cheaper than standard 25–50 μl PCR reactions performed in most labs.
Time Efficiency
All steps of our method were preformed manually, with the only exception of a robotic step used to normalize our PCR II samples before pooling. When compared with traditional Sanger sequencing (prepping an equal amount of samples), our method was only slightly more time consuming (i.e., labor intensive), due to the preparation time required for the 454 run (e.g., quantification and normalization of DNA prior to pooling). Such preparation is necessary because the 454 is sensitive to PCR concentration and a run may become easily biased by highly concentrated samples. Nonetheless, our method represents a significant savings in time in post sequence retrieval as the reads were cleaned, assembled, and put into alignment ready FASTA files using BarcodeCruncher. Using traditional Sanger sequencing, data require more manual labor and time to process.
Potential Improvements and Challenges to the Method
Small fragment DNAs as a serious challenge
Small fragment DNAs were a challenge to this research as they appear to have consumed nearly a third of our total reads. Using additional methods to clean samples would improve the method (e.g., membrane filters that exclude small fragment DNAs below a certain threshold (e.g., 200 bp) while preserving fragments of >400 bp). Also, the threshold for including a PCR 2 product in the final pooling step was set to a DNA concentration of 14 ng/μl. We chose this concentration because we wanted to investigate the potential of 454 to recover amplicons that might be present but were not detectable via gel electrophoresis. By selecting such a low threshold, we introduced undesirable PCR byproduct in the form of short DNAs (e.g., undigested primers, primer dimers, etc.). Had the threshold of DNA concentration been set higher prior to final pooling and/or a membrane filter been used to further purify the final pooled product, more small fragment DNAs could have been excluded.
We estimate the need for ∼135× to create a robust consensus sequence for each targeted gene region. This estimate is likely inflated due to 18S and 28S, both having lengthy inserts that acted to decrease overall read quality and made it necessary to have an increased amount of reads to produce a sequence that was high enough quality to pass our bioinformatic pipeline.
As mentioned, the short read length is due at least in part to the extreme insertions known to exist among Isopoda ribosomal genes (Wetzer R and S.M.B., personal communication). Such insertions make it difficult to form an entire contig because existing 454 sequence technology was limited to a maximum average read length of between 400 and 450 bp and 18S and 28S were divided into only four segments each. There was most certainly bias during emPCR against these long sequences with variable introns as well. Assembling entire genes by generating tiled PCR amplicons for larger genes, such as 18S and 28S, worked for other taxa, such as insects because insects have shorter insertions that are more consistent in length. Next-gen platforms are increasing read lengths and several of these platforms are approaching nearly 1,000 bp (e.g., 454 technology is launching a new chemistry capable of ∼700 bp and PacBio's system already averages ∼1,000 bp reads), which would have largely overcome our problems with ribosomal expansion regions. This issue is largely isolated to ribosomal genes and less of a problem among protein-coding genes where large insertions are relatively less common.
Initial experiments with the method yielded significant problems with primer dimerization (Bybee et al. 2011). This was due to very large primers (80–180 bp) and an inadequate method for PCR purification that would remove the large primers and primer dimers. By using a Taq polymerase with proofreading capability (AccuPrime Taq), we were able to significantly reduce the amount of primer dimer generated during the two-step PCR. However, even the minimal primer dimer remaining posed a problem due to short fragment bias during emPCR.
These data also posed a challenge during the alignment phase of phylogenetic reconstruction. Read quality from the 454 was exceptionally good but read length was shorter than desired. Amplicons are often cut short during 454 pyrosequencing. This resulted in several assembled contigs that were just under 200 bp (but most were between 400 and 600 bp) to be included in the alignment. Not only did these shorter reads pose problems during alignment but also the missing data are most likely the reason for some spurious relationships toward the tips of the tree (e.g., nonmonophyletic Coleoptera). There are several strategies to get around this issue. Our alignment only included data generated from the 454 for in-group taxa, but including several outgroup taxa with full-length complete data made for much more robust alignments and phylogenetic estimates. Another strategy may be to use the profile or skeletal alignments in MAFFT.
The experiment conducted herein is from one group of organisms and for only 12 gene regions but represents a significant step forward using TAS (e.g., Bybee et al. 2011). We also recognize that the taxon sampling and genetic component of this research are limited, however, we have sampled across the diversity of one of the most diverse groups of organisms on the planet. The bioinformatics is fairly simple and tailored to our current taxon sampling and our specific TAS approach. However, all preliminary work and the results presented herein strongly suggest that further experiments with hundreds of taxa and/or loci using this method will work well. As genomic resources for nonmodel and model organism come online in the very near future, TAS will not be limited by primer design to target specific loci. Furthermore, as bioinformatic approaches to deal with data generated via TAS become more user friendly and freely available (e.g., BarcodeCruncher and Hird et al. 2011), the method will become more useful to most PCR-based lab. For example, Hird et al. (2011) uses a series of Perl scripts to pipeline a set of programs that need no a priori reference genome to provide alignments, single-nucleotide polymorphisms calls, and summary statistics, whereas BarcodeCruncher is very much oriented toward phylogenetic applications and simply outputs a summary of the best sequence for each targeted locus that has been identified through basic Blast statistics. As TAS has broad application in systematic and population genetic studies, we anticipate further refinements to the method and the bioinformatic pipeline to accommodate the array of projects that might benefit from exceptional high throughput sequencing of targeted genes for large numbers of individuals.
Conclusions
Strengths and Potential for TAS
Our TAS method is fully scalable and easily optimized for robotics resulting in the ability to sequence hundreds of taxa for hundreds of genes (even thousands) allowing for more efficient generation of standard sequence data than Sanger-based methods. There are currently 151 ten bp barcodes that have been optimized by Roche such that misassigned reads after 454 sequencing are very low even with up to two errors in the barcode itself. By using a different barcode at each end of an amplicon, it is possible to produce a combination of over 22,800 unique barcodes. With such a method, there is also the potential for individual labs or multiple researchers from a single lab to generate PCR 1 and PCR 2 products that can then be pooled and multiplexed together.
The method also has great potential for ancient DNA research because it offers the potential to amplify desired gene regions via PCR followed by extremely sensitive next-gen sequencing platforms. Furthermore, because the next-gen sequencing approaches focus on shorter reads (50–400 bp), these are ideal read lengths for often fragmented ancient DNA and degraded DNA from preserved museum specimens (Stiller et al. 2009). Our TAS approach (for targeted genes) and the multiplexing PCR approach of Stiller et al. (2009) (for mitochondrial genome sequencing) both capitalize on the PCR amplification of target DNA (often degraded and/or fragmented) and couple this with the power of next-gen sequencing. Bybee et al. (2011) used our TAS approach to successfully amplify and sequence DNA from multiple museum specimens. We plan additional studies on museum samples to further explore the utility of this approach for obtaining robust sequence data from such problematic, yet often crucial (e.g., Crandall et al. 2009), samples.
TAS offers an excellent cost-effective option to both small and large labs as well as flexibility and speed. It can be easily applied to any question where targeted sequencing is desired (e.g., many population genetic and most systematic applications). Moreover, the amplicon preparation time is faster, more flexible, and much less costly than other methods for targeted sequencing and gene isolation (e.g., sequence capture and cloning). Although targeted sequencing can be coupled with any next-gen platform, currently 454 sequencing is best optimized because of the long read length. Our hope is that by demonstrating the utility and potential of next-gen sequencing for targeted gene products in phylogenetic applications, we will open up these methods for further optimization by the scientific community.
Supplementary Material
Supplementary Appendix 1 is available at Genome Biology and Evolution online (http://www.gbe.oxfordjournals.org/).
Acknowledgments
We are indebted to the staff of the DNA Sequencing Center at BYU for their careful processing of the 454 run. We are also grateful to Fluidigm Inc. for sharing their adapter sequence. We thank our collaborators, many of whom have been working with us for 15 years, for samples, advice, and comments. We thank two anonymous reviewers for helpful comments to improve our manuscript. The US National Science Foundation has provided support for this research (MRI-0821728, EF-0531762, IOS-1045243). We have also received generous financial support from BYU.
References
- Altschul SF, Gish W, Miller W, Myers EW, Lipman DJ. Basic local alignment search tool. J Mol Biol. 1990;215:403–410. doi: 10.1016/S0022-2836(05)80360-2. [DOI] [PubMed] [Google Scholar]
- Baurain D, Brinkmann H, Philippe H. Lack of resolution in the animal phylogeny: closely spaced cladogenses or undetected systematic errors? Mol Biol Evol. 2007;24:6–9. doi: 10.1093/molbev/msl137. [DOI] [PubMed] [Google Scholar]
- Binladen J, et al. The use of coded PCR primers enables high-throughput sequencing of multiple homolog amplification products by 454 parallel sequencing. PLoS One. 2007;2(2):e197. doi: 10.1371/journal.pone.0000197. [DOI] [PMC free article] [PubMed] [Google Scholar]
- Briscoe AD, et al. Positive selection of a duplicated ultraviolet-sensitive visual pigment coincides with wing pigment evolution in Heliconius butterflies. Proc Natl Acad Sci U S A. 2010;107:3628–3633. doi: 10.1073/pnas.0910085107. [DOI] [PMC free article] [PubMed] [Google Scholar]
- Buhay JE, Moni G, Mann N, Crandall KA. Molecular taxonomy in the dark: evolutionary history, phylogeography, and diversity of cave crayfish in the subgenus Aviticambarus, genus Cambarus. Mol Phylogenet Evol. 2007;42:435–448. doi: 10.1016/j.ympev.2006.07.014. [DOI] [PubMed] [Google Scholar]
- Bybee SM, Bracken-Grissom H, Hermansen R, Clement M, Crandall KA, Felder D. Directed next generation sequencing for phylogenetics: an example using Decapoda. Zool Anz. 2011;250(4):497–506. [Google Scholar]
- Castresana J. Selection of conserved blocks from multiple alignments for their use in phylogenetic analysis. Mol Biol Evol. 2000;17:540–552. doi: 10.1093/oxfordjournals.molbev.a026334. [DOI] [PubMed] [Google Scholar]
- Colgan DJ, et al. Histone H3 and U2 snRNA DNA sequences and arthropod molecular evolution. Aust J Zool. 1998;46:419–437. [Google Scholar]
- Crandall KA, Fitzpatrick JF. Crayfish molecular systematics: using a combination of procedures to estimate phylogeny. Syst Biol. 1996;45:1–26. [Google Scholar]
- Crandall KA, Robison HW, Buhay JE. Avoidance of extinction through nonexistence: the use of museum specimens and molecular genetics to determine the taxonomic status of an endangered freshwater crayfish. Conserv Genet. 2009;10:177–189. [Google Scholar]
- Crosby LD, Criddle CS. Gene capture and random amplification for quantitative recovery of homologous genes. Mol Cell Probe. 2007;21:140–147. doi: 10.1016/j.mcp.2006.09.003. [DOI] [PubMed] [Google Scholar]
- Drummond AJ, Rambaut A. BEAST: Bayesian evolutionary analysis by sampling trees. BMC Evol Biol. 2007;7:214. doi: 10.1186/1471-2148-7-214. [DOI] [PMC free article] [PubMed] [Google Scholar]
- Felsenstein J. Confidence-limits on phylogenies with a molecular clock. Syst Zool. 1985;34:152–161. [Google Scholar]
- Folmer O, Black M, Hoeh W, Lutz R, Vrijenhoek R. DNA primers for amplification of mitochondrial cytochrome c oxidase subunit I from diverse metazoan invertebrates. Mol Mar Biol Biotech. 1994;3:294–299. [PubMed] [Google Scholar]
- Goloboff PA, et al. Phylogenetic analysis of 73,060 taxa corroborates major eukaryotic groups. Cladistics. 2009;25:211–230. doi: 10.1111/j.1096-0031.2009.00255.x. [DOI] [PubMed] [Google Scholar]
- Graybeal A. Is it better to add taxa or characters to a difficult phylogenetic problem? Syst Biol. 1998;47:9–17. doi: 10.1080/106351598260996. [DOI] [PubMed] [Google Scholar]
- Hebert PDN, Penton EH, Burns JM, Janzen DH, Hallwachs W. Ten species in one: DNA barcoding reveals cryptic species in the neotropical skipper butterfly Astaptes fulgerator. Proc Natl Acad Sci U S A. 2004;101:14812–14817. doi: 10.1073/pnas.0406166101. [DOI] [PMC free article] [PubMed] [Google Scholar]
- Hillis DM. Taxonomic sampling, phylogenetic accuracy, and investigator bias. Syst Biol. 1998;47:3–8. doi: 10.1080/106351598260987. [DOI] [PubMed] [Google Scholar]
- Hird SM, Brumfield RT, Carstens BC. PRGmatic: an efficient pipeline for collating genome-enriched second-generation sequencing data using a ‘provisional-reference genome’. Mol Ecol Resour. 2011;11:743–748. doi: 10.1111/j.1755-0998.2011.03005.x. [DOI] [PubMed] [Google Scholar]
- Katoh K, Kuma K, Toh H, Myata T. MAFFT version 5: improvement in accuracy of multiple sequence alignment. Nucleic Acids Res. 2005;33:511–518. doi: 10.1093/nar/gki198. [DOI] [PMC free article] [PubMed] [Google Scholar]
- Kauwe JSK, et al. Suggestive synergy between genetic variants in TF and HFE as risk factors for Alzheimer's disease. Am J Med Genet B Neuropsychiatr Genet. 2010;153B:955–959. doi: 10.1002/ajmg.b.31053. [DOI] [PMC free article] [PubMed] [Google Scholar]
- Kress WJ, Wurdack KJ, Zimmer EA, Wiegt LA, Janzen DH. Use of DNA barcodes to identify flowering plants. Proc Natl Acad Sci U S A. 2005;102:8369–8374. doi: 10.1073/pnas.0503123102. [DOI] [PMC free article] [PubMed] [Google Scholar]
- Lam HM, et al. Resequencing of 31 wild and cultivated soybean genomes identifies patterns of genetic diversity and selection. Nat Genet. 2010;42:1053–1059. doi: 10.1038/ng.715. [DOI] [PubMed] [Google Scholar]
- Lennon NJ, et al. A scalable, fully automated process for construction of sequence-ready barcoded libraries for 454. Genome Biol. 2010;11:R15. doi: 10.1186/gb-2010-11-2-r15. [DOI] [PMC free article] [PubMed] [Google Scholar]
- Mardis ER. Next-generation DNA sequencing methods. Ann Rev Genom Hum G. 2008;9:387–402. doi: 10.1146/annurev.genom.9.081307.164359. [DOI] [PubMed] [Google Scholar]
- Meyer M, Stenzel U, Hofreiter M. Parallel tagged sequencing on the 454 platform. Nat Protoc. 2008;3:267–278. doi: 10.1038/nprot.2007.520. [DOI] [PubMed] [Google Scholar]
- Meyer M, Stenzel U, Myles S, Prufer K, Hofreiter M. Targeted high-throughput sequencing of tagged nucleic acid samples. Nucleic Acids Res. 2007;35(15):e97. doi: 10.1093/nar/gkm566. [DOI] [PMC free article] [PubMed] [Google Scholar]
- Mitchell A, Mitter C, Regier JC. More taxa or more characters revisited: combining data from nuclear protein-encoding genes for phylogenetic analyses of Noctuoidea (Insecta: Lepidoptera) Syst Biol. 2000;49:202–224. [PubMed] [Google Scholar]
- Naj AC, et al. Common variants at MS4A4/MS4A6E, CD2AP, CD33 and EPHA1 are associated with late-onset Alzheimer's disease. Nat Genet. 2011;43:436–441. doi: 10.1038/ng.801. [DOI] [PMC free article] [PubMed] [Google Scholar]
- Pearson WR, Lipman DJ. Improved tools for biological sequence comparison. Proc Natl Acad Sci U S A. 1988;85:2444–2448. doi: 10.1073/pnas.85.8.2444. [DOI] [PMC free article] [PubMed] [Google Scholar]
- Pertoldi C, et al. Depauperate genetic variability detected in the American and European bison using genomic techniques. Biol Direct. 2009;4:48. doi: 10.1186/1745-6150-4-48. [DOI] [PMC free article] [PubMed] [Google Scholar]
- Posada D, Crandall KA. A comparison of different strategies for selecting models of DNA substitution. Syst Biol. 2001;50(4):580–601. [PubMed] [Google Scholar]
- Regier JC, et al. Resolving arthropod phylogeny: exploring phylogenetic signal with 41 kb of protein-coding nuclear gene sequence. Syst Biol. 2008;57(6):920–938. doi: 10.1080/10635150802570791. [DOI] [PubMed] [Google Scholar]
- Regier JC, et al. Arthropod relationships revealed by phylogenetic analysis of nuclear protein-coding sequences. Nature. 2010;463:1079–1083. doi: 10.1038/nature08742. [DOI] [PubMed] [Google Scholar]
- Romeo S, et al. Population-based resequencing of ANGPTL4 uncovers variations that reduce triglycerides and increase HDL. Nat Genet. 2007;39:513–516. doi: 10.1038/ng1984. [DOI] [PMC free article] [PubMed] [Google Scholar]
- Ronquist F, Huelsenbeck JP. MrBayes 3: Bayesian phylogenetic inference under mixed models. Bioinformatics. 2003;19:1572–1574. doi: 10.1093/bioinformatics/btg180. [DOI] [PubMed] [Google Scholar]
- Rubin CJ, et al. Whole-genome resequencing reveals loci under selection during chicken domestication. Nature. 2010;464:587–591. doi: 10.1038/nature08832. [DOI] [PubMed] [Google Scholar]
- Soltis D, et al. Angiosperm phylogeny inferred from 18S rDNA, rbcl and atpB sequences. Bot J Linn Soc. 2000;133:381–461. [Google Scholar]
- Song H, Buhay JE, Whiting MF, Crandall KA. Many species in one: DNA barcoding overestimates the number of species when nuclear mitochondrial pseudogenes are coamplified. Proc Natl Acad Sci U S A. 2008;105:13486–13491. doi: 10.1073/pnas.0803076105. [DOI] [PMC free article] [PubMed] [Google Scholar]
- Stamatakis A, Ludwig T, Meier H. RAxML-III: a fast program for maximum likelihood-based inference of large phylogenetic trees. Bioinformatics. 2005;21:456–463. doi: 10.1093/bioinformatics/bti191. [DOI] [PubMed] [Google Scholar]
- Stiller M, Knapp M, Udo S, Hofreiter M, Meyer M. Direct multiplex sequencing (DMPS)—a novel method for targeted high-throughput sequencing of ancient and highly degraded DNA. Genome Res. 2009;19:1843–1848. doi: 10.1101/gr.095760.109. [DOI] [PMC free article] [PubMed] [Google Scholar]
- Toon A, Finley M, Staples J, Crandall KA. Decapod phylogenetics and molecular evolution. In: Martin JW, Crandall KA, Felder DL, editors. Decapod crustacean phylogenetics (crustacean issues 18) Bocan Raton (FL): CRC Press; 2009. pp. 14–28. [Google Scholar]
- Turner TL, Bourne EC, Von Wettberg EJ, Hu TT, Nuzhdin S. Population resequencing reveals local adaptation of Arabidopsis lyrata to serpentine soils. Nat Genet. 2010;42:260–263. doi: 10.1038/ng.515. [DOI] [PubMed] [Google Scholar]
- Whipple CJ, et al. A conserved mechanism of bract suppression in the grass family. Plant Cell. 2010;22:565–578. doi: 10.1105/tpc.109.073536. [DOI] [PMC free article] [PubMed] [Google Scholar]
- Whiting MF. Mecoptera is paraphyletic: multiple genes and phylogeny of Mecoptera and Siphonaptera. Zool Scr. 2002;31:93–104. [Google Scholar]
- Whiting MF, Carpenter JC, Wheeler QD, Wheeler WC. The Strepsiptera problem: phylogeny of the holometabolous insect orders inferred from 18S and 28S ribosomal DNA sequences and morphology. Syst Biol. 1997;46:1–68. doi: 10.1093/sysbio/46.1.1. [DOI] [PubMed] [Google Scholar]
- Wiens J. Missing data and the design of phylogenetic analyses. J Biomed Inform. 2006;39:34–42. doi: 10.1016/j.jbi.2005.04.001. [DOI] [PubMed] [Google Scholar]