Abstract
In the present work, the advantages of a new, 100kV platform equipped with a massive gold cluster source for the analysis of native biological surfaces are shown. Inspection of the molecular ion emission as a function of projectile size demonstrate a secondary ion yield increase of ~100x for 520 keV Au400+4 as compared to 130 keV Au3+1 and 43 keV C60. In particular, yields of tens of percent of molecular ions per projectile impact for the most abundant components can be observed with the 520 keV Au400+4 probe, respectively. A comparison between 520 keV Au400+4 ToF-SIMS and MALDI-MS data showed a similar pattern and similar relative intensities of lipids’ components across a rat brain sagittal section. The abundant secondary ion yields of analyte-specific ions makes 520 keV Au4004+ projectiles an attractive probe for sub-μm molecular mapping of native surfaces.
Keywords: secondary ion yield, molecular ion emission, cluster-SIMS
INTRODUCTION
Mass spectrometry imaging has become the method of choice for chemical mapping of organic and inorganic compounds from various surfaces, in particular for tissue sections (for more details see reviews 1–5). Three techniques are emerging as good candidates: MALDI-MS, nano-SIMS and ToF-SIMS. In MALDI-MS, molecular ion identification and localization with a 50 μm spatial and nanomolar sensitivity can be achieved over a wide mass range (typically, 400 - 40k Da), while analysis reproducibility strongly depends on the sample preparation method and matrix deposition. That is, the matrix remains a crucial choice for the chemical class to be studied in MALDI experiments and a number of new matrices have been developed (e.g., ionic liquids,6 nanoparticules,7,8 colloids,9 implantation of absorption sites,10 and engineered organic matrixes 11–14 for lipid analyses).
Nano-SIMS and ToF-SIMS, on the other hand, are perfectly suited for high spatial resolution and have the unique advantage that analysis can be performed on native surfaces. In the case of nano-SIMS, a very precise localization of elements or small fragments within few tens of nm is achievable. This mass range limitation requires strategies for molecular identification (e.g., isotopic labeling) which can limit their applicability.15
ToF-SIMS can detect molecular ions with a spatial resolution of 500 nm to a few microns. The selection of the primary ion in a ToF-SIMS experiment defines the mass range of the analysis. For example, mono-atomic projectiles (e.g., In, Ga and Cs ion sources) induce high surface damage and low intact molecular ion emission, leading mainly to the detection of fragment ions (e.g., head groups in the case of lipid samples).16 When small cluster ion sources (e.g., Au3+ and Bi3+) are used,17,18 ToF-SIMS can also generate molecular signals in the 1000–1500 mass range. Moreover, the use of larger cluster projectiles (e.g. C60 and Au400) with ToF-SIMS for surface analysis and characterization has shown significant advantages due to the enhanced emission of molecular ions and reduced molecular fragmentation.19–22 With temporally and spatially discrete cluster impacts, the small interaction volume (~103 nm3) and large ionized ejecta makes these massive probes promising candidates for surface molecule interrogation.23,24 Current challenges are in the development of new ToF-SIMS probes capable of generating signature secondary ions from a surface of interest. Recent efforts have focused on the use of higher energy and larger cluster projectiles (e.g., C60 and Au400) to increase the secondary ion signal.25–28
In the present paper, we introduce a massive gold projectile source installed in a new, 100 kV platform as a new generation ToF-SIMS probe for the analysis of native biological surfaces. Molecular ion emission profiles are compared with MALDI imaging data for model rat brain sagittal sections. In particular, secondary ion dependence on the projectile size and the advantages of 520 keV Au400+4 single impacts will be shown for surface molecule characterization and identification on native, rat brain sagittal sections.
EXPERIMETAL METHODS
Cluster - SIMS Experiments
A new, in-house built experimental setup comprising a massive gold cluster primary ion beam, an electron emission microscope and a ToF mass spectrometer have been developed. The gold cluster primary ion beam consists of a Au-Liquid Metal Ion Source (Au-LMIS) coupled to a 100 kV Pegase Platform.29 The Au-LMIS is floated to 20kV relative to Pegase Platform and can produce a variety of projectiles, ranging from atomic Au1+1,2 to polyatomic Au2–9+1 to massive Au100n+n clusters; more details on the primary ion distribution produce by the Au-LMIS can be found in ref 30. The primary ion projectiles can be mass-selected using a Wien filter and focused into the analysis chamber, where the primary ion current can be measured as a function of the projectile size (e.g., 150 nA for Au1+, 15 nA for Au3+ and 1 nA for Au400+4 without beam collimation/pulsing). Comparative studies were performed using a C60 in-house built ion source capable of producing 15–43 keV C60 ions; details of the C60 effusion source can be found elsewhere.31
All ToF-SIMS experiments were performed under single projectile impacts. To achieve the single impact analysis mode, the primary ion beam was pulsed and/or collimated to ensure an impact rate bellow 500 Hz of individual projectiles per pulse. All experiments were performed in negative ion mode and the target was set to −10 kV; under this conditions the primary ions experienced a total acceleration of 130 kV. Emitted electrons and negative secondary ions were collected per single projectile impact. Emitted electrons were accelerated from the target and then deflected using a weak magnetic field toward an electron emission microscope and used as a ToF start signal (negative ion mode detection).31 Secondary ions were accelerated and analyzed using an in-house built ToF analyzer (~1.7 meter long) equipped with a two-stage electrostatic mirror (mass resolution of ~1000–1500). ToF signals of the secondary ions were detected using a newly designed, pie-shaped 8-anode detector and were stored on a multi-channel time-to-digital converter (TDC). The multi-anode detector guarantees detection of high multiplicity secondary ions (up to eight isobaric ions). New data acquisition and processing programs (SAMPI) were developed in-house to optimize multiple secondary ion detection.
MALDI Imaging Experiments
MALDI imaging experiments were performed using a nitrogen laser (337 nm) in a commercial LTQ-XL instrument (Thermo Fisher Scientific Inc., Santa Clara, CA). Data was acquired in negative ion mode from a sagittal brain section (~ 12 × 25 mm) with a pixel resolution of 100×100 μm2. A saturated matrix solution of 2,6-dihydroxyacetophenone [DHA]/ammonium sulfate 125 mM/heptafluorobutyric acid [HFBA] 0.05% was used (more details in ref 14,32). Matrix solution (~2.5 mL) was sprayed on the tissue section with an artistic brush (Aztek A470/80 Airbrush system, Testor Corporation, Rockford, IL).33 To ensure sufficient evaporation of organic solvents, two minutes intervals between spray cycles were used. The spray nozzle was positioned 15–20 cm from the sample plate and matrix was sprayed at a temperature of ~4–10 °C.
Sample Preparation
Details of sample preparation can be found elsewhere.34 Briefly, Male Sprague- Dawley rats (Harlan Industries, Indianapolis, IN) between 300–420 g were euthanized with isoflurane and the brain quickly removed and frozen in isopentane for 15s, prior to storage at −80 °C. Before sectioning, brains were allowed to reach a temperature of −20 °C for 45 min in the cryostat chamber (CM 3050 S, Leica Microsystem Nussloch, Germany). The brain was attached to the cryostat specimen disk using ice slush made from distilled water.33 Brain sagittal sections 10 μm thick were cut and placed on a stainless steel support. Two consecutive sections were used for the ToF-SIMS and MALDI imaging.
RESULTS AND DISCUSSION
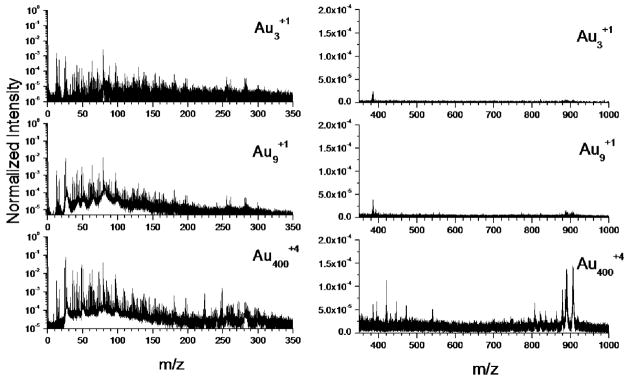
Previous studies have shown that secondary ion emission in ToF-SIMS strongly depends on the projectile size and energy.35,36 For example, from model organic samples, the secondary ion emission for small gold projectiles (e.g., Au3) reaches a maximum around 30–40 keV/atom.27 Figure 1 shows representative ToF-SIMS spectra for 130 keV Au3+1, 130 keV Au9+1 and 520 keV Au400+4 single impacts on the same region of native, rat brain sagittal section (~100X100 μm2 field of view). Inspection of Figure 1 shows that although similar in the low mass region, there is a strong increase in the molecular ion signal as the projectile size increases.
Figure 1.
Representative negative ion mode single event ToF-SIMS spectra for 130 keV Au3+1, 130 keV Au9+1 and 520 keV Au400+4 projectiles on a native rat brain section from the same 100×100 μm2 field of view. All spectra are normalized to the number of impacts (typically 106 impacts). Notice the increase in molecular ion emission for the massive cluster projectile.
For a more detailed inspection, secondary ion yields (number of molecular ions detected per projectile impact) are reported in Table 1. Multiple isobaric atomic and small fragment ions are observed per projectile impact for the case of 520 keV Au400+4. In the low mass region, similar MS signals are observed with the exception of gold adduct signals in the case of 520 keV Au400+4 (e.g., AuCN− and Au(CN)2−), as characteristic signatures of the massive projectile-target interaction.37 In the case of molecular ion emission, inspection shows that 520 keV Au400+4 secondary ion yields are ~10x and ~30–80x higher when compared to 130 keV Au9+1 and 130 keV Au3+1, respectively. Comparison with 43 keV C60 projectiles shows that the secondary ion yields lie between those obtain with 130 keV Au3+1 and Au9+1 projectiles, and are ~30x smaller than those obtained with 520 keV Au400+4 projectiles.
Table 1.
Secondary Ion yields per nominal mass of representative signals as a function of the projectile size from single event ToF-SIMS analysis on native rat brain sections.
| Secondary Ion | (m/z) | 130 keV Au3+ | 130 keV Au9+ | 43 keV C60+2 | 520 keV Au400+4 |
|---|---|---|---|---|---|
| CN− | 26 | 2.79E-02 | 3.75E-01 | 1.12E-01 | 3.56 |
| PO2− | 63 | 4.21E-02 | 2.25E-01 | 9.48E-02 | 8.64E-01 |
| PO3− | 79 | 2.60E-01 | 8.10E-01 | 2.75E-01 | 3.02 |
| Au− | 197 | 4.71E-03 | 9.43E-03 | - | 5.65E-02 |
| Au(CN) − | 223 | - | - | - | 3.78E-02 |
| Au(CN)2− | 249 | - | - | - | 1.47E-01 |
| ST 22:0 (OH) | 878.6 | 2.65E-04 | 9.01E-04 | 5.07E-04 | 1.49E-02 |
| PI 38:4 | 885.5 | 7.31E-04 | 2.35E-03 | 1.02E-03 | 1.50E-02 |
| ST 24:1 | 888.7 | 1.01E-03 | 2.46E-03 | 7.97E-04 | 3.11E-02 |
| ST 24:0 | 890.6 | 9.63E-04 | 2.32E-03 | 8.35E-04 | 2.82E-02 |
| ST 24:1 (OH) | 904.6 | 6.44E-04 | 1.63E-03 | 7.92E-04 | 2.53E-02 |
| ST 24:0 (OH) | 906.6 | 7.76E-04 | 2.26E-03 | 9.63E-04 | 3.42E-02 |
Three ion distributions are observed for ToF-SIMS with single 520 keV Au400+4 impacts: i) head group fragments, ii) fatty acid fragments and iii) lipid molecular ions. We attribute the high abundance of lipid secondary ion signal as compared to other chemical classes to the fact that lipids account for up to 50% of the dried weight of rat brain tissue sections. During 520 keV Au400+4 ToF-SIMS analysis, preferential emission of a particular chemical class is not observed. For example, 0.1–0.5 molecular ions per projectile impact can be obtained with 520 keV Au400+4 projectiles from model, single component peptide and lipid targets,38 where molecular ion abundance is a consequence of the ionization probability and the concentration in the sample.
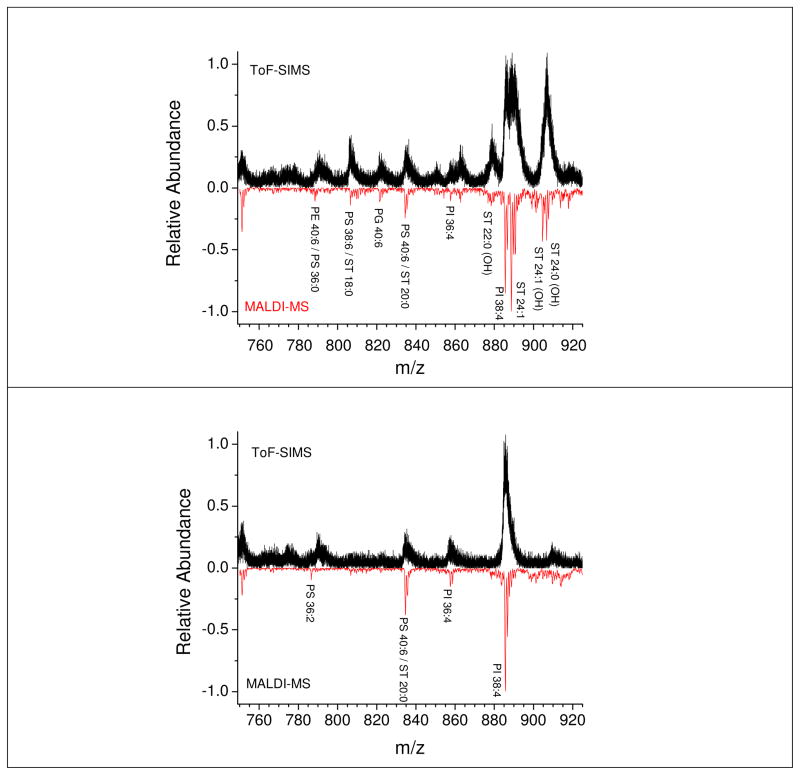
A complete identification of the lipid signal was performed using a combined ToF-SIMS and MALDI imaging strategy. Peak assignment was performed using the MALDI imaging data obtained from a consecutive rat brain sagittal section. For simplicity, here we limit the discussion to the grey and white matter regions of the rat brain cerebellum area. Representative 520 keV Au400+4 ToF-SIMS and MALDI-MS spectra of the white and grey region are shown in Figure 2 for equivalent areas (~100X100 μm2 field of view). Inspection of Figure 2 shows that the most abundant signals observed in ToF-SIMS and MALDI-MS are in good correspondence for both the white and grey matter regions; that is, the same lipid pattern is observed in both cases. The reduction in mass resolution observed in the ToF-SIMS spectra is related to the secondary ion focusing strategy used to maximized multiple ion detection and transmission; in the single impact TOF-SIMS mode surface charging is significantly reduced and has a minor effect on the mass resolution. A detailed list of the identified lipids is given in Table 2. It should be noted that for some mass peaks more than one lipid species is possible and assignment was made following MS/MS of the most abundant ones.39 In the grey matter region, the lipid distribution mainly contains phosphatidylserines (PS) and phosphatidylinotisols (PI). Moreover, the white matter region mainly contains phosphatidylserines (PS), phosphatidylglycerols (PG), and sulfatides (ST).
Figure 2.
Representative 520 keV Au400+4 ToF-SIMS and MALDI-MS spectra of: top) the grey and white matter interface and bottom) the grey matter regions. In all cases, spectra correspond to a ~100×100 μm2 field of view.
Table 2.
Lipid species identified in negative ion mode from 520 keV Au400+4 ToF-SIMS and MALDI-MS
| Species | Theoretical m/z | ToF-SIMS m/z | MALDI-MS m/z |
|---|---|---|---|
| PE 38:6/PS 34:0 | 762.51/762.53 | 762.3 | 762.53 |
| PE 40:6 | 774.54 | 774.4 | 774.55 |
| PS 36:2 | 786.53 | 786.5 | 786.55 |
| PE 40:6/PS 36:0 | 790.54/790.56 | 790.5 | 790.55 |
| PS 38:6/ST 18:0 | 806.50/806.55 | 806.4 | 806.81 |
| PG 40:6 | 821.53 | 821.5 | 821.83 |
| ST 18:0 (OH) | 822.54 | 822.5 | 822.69 |
| PS 40:6/ST 20:0 | 834.53/834.58 | 834.4 | 834.58 |
| PI 36:4 | 857.52 | 857.5 | 857.57 |
| ST 22:0 (OH) | 878.60 | 878.5 | 878.64 |
| PI 38:4 | 885.55 | 885.5 | 885.66 |
| ST 24:1 | 888.62 | 888.4 | 888.65 |
| ST 24:0 | 890.64 | 890.6 | 890.70 |
| ST 24:1 (OH) | 904.62 | 904.5 | 904.67 |
| ST 24:0 (OH) | 906.63 | 906.5 | 906.65 |
in red and blue are denoted lipid signals that are mostly observed in the white and grey matter, respectively.
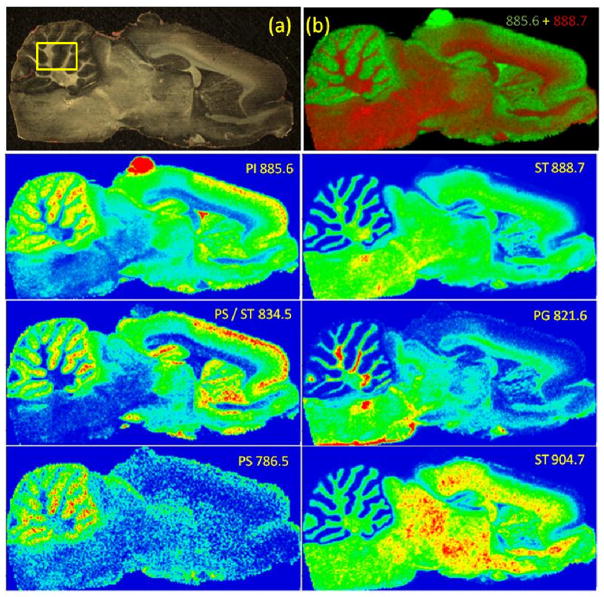
It is well know that lipids have a wide variety of biological functions. They are the major structural components of cell membranes, and are also involved in energy storage, cell-signaling and can function as anti-oxidants. Each cell type and physiological state of a cell population exhibits a different lipid composition and distribution. This is illustrated in Figure 3 for the whole rat brain sagittal section. A comparison with the optical image (Figure 3a) shows that lipids are distributed across the whole brain section according to tissue composition. For example, Figure 3b shows the complementary distribution of PI 38:4 (grey matter) and ST 24:1 (white matter) in the cerebellum.
Figure 3.
Molecular ion distributions (MALDI-MS) of representative lipid signals in the rat brain slice obtained with 100X100 μm2 pixel resolution. (a) Whole sagittal section optical image and (b) PI (885.6) and ST (888.7) signal overlay. On left and right columns are shown the most abundant lipids observed in the grey and white matter, respectively.
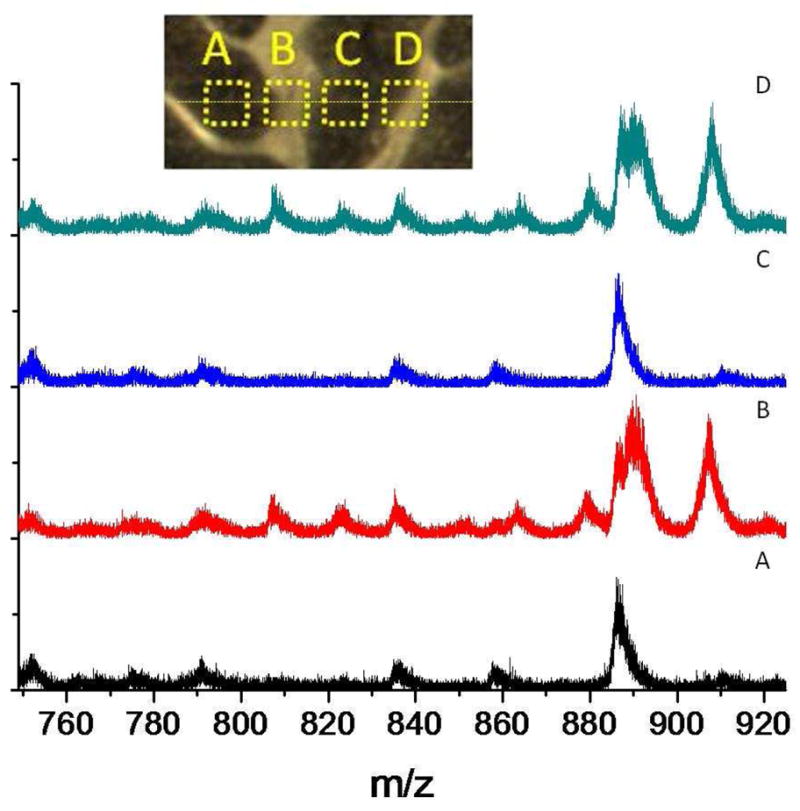
A ToF-SIMS line scan across the cerebellum is shown in Figure 4. Inspection of Figure 4 shows that, from A to D, the lipids relative abundances in the white and grey matter vary in good agreement with the MALDI molecular ion distribution shown in Figure 3. ST 24:1, ST 24:1 (OH) and ST 24:0 (OH) are lipids found in the white matter and are abundant in the B and D regions, and are absent in the A and C regions. Since the B and D regions contain some grey matter, PI 38:4 a lipid commonly seen in grey matter only changes relative abundance. The signal intensity can be further correlated with the surface density of analyte-specific signals; that is, the larger the signal (secondary ion yield) the larger the surface coverage.
Figure 4.

Representative 520 keV Au400+4 ToF-SIMS negative ion mode spectra from a line scan A-D across the cerebellum region (top inset, boxes not to scale) of the box highlighted in Fig 3a. All spectra correspond to a 100×100 μm2 field of view and 106 impacts.
It is worth mentioning that in single event 520 keV Au400+4 ToF-SIMS, the analytical information comes from the top 10 nm and the surface area interrogated over the whole analysis is less than 1% for a field of view of 100×100 μm2 with 106 impacts (assuming an area of emission of 102nm2 per impact); under this conditions, the surface integrity is preserved (i.e., non-destructive analysis) and no preparation is required. Further applications may include the generation of molecular ion maps from adjacent areas using a movable/automated sample stage, analogous to the MALDI imaging acquisition protocol. On the other hand, preliminary results suggest that Au400+4 projectiles can be focused to a 10X10 μm2 field of view which would permit ~100% surface interrogation over the same analysis time (~106 impacts).29
CONCLUSIONS
In the present study, we have shown the advantages of using high energy, massive gold projectiles for characterization of native biological surfaces. As the projectiles size/energy increases, while there is an increase in the secondary ion emission of fragment molecular ions (e.g., head groups and fatty acids for the lipid components). However, the most significant feature is the large increase in the emission yield of lipid molecular ions. For example, a near two order increase in molecular ion yield is obtained with 520 keV Au400+4 projectiles compared to 130 keV Au3+1 and 43 keV C60 projectiles. The comparison of ToF-SIMS and MALDI-MS secondary ion signals from rat brain sagittal sections shows that a good correspondence for the most abundant target components is observed. In particular, identification of lipid molecular ions can be performed for a field of view of 100×100 μm2 with ~106 impacts of 520 keV Au400+4.
The abundant secondary ion yields of analyte-specific ions makes 520 keV Au4004+ projectiles an attractive probe for sub-μm molecular mapping of native surfaces. The temporally and spatially discrete single impacts can be used to localize successive stochastic impacts on a ~10 μm diameter spot via the coordinates of the co-emitted electrons and hence construct a molecular ion map30. The ultimate limits for spatially resolved molecular maps will be set by the number of SIs and electrons ejected per impact (Poisson probability distributions). These as well as steps to enhance mass resolution remain to be explored.
Acknowledgments
This work was supported by the National Science Foundation (Grant CHE-0750377). F. A. F-L acknowledges the National Institute of Health support (Grant No. 1K99RR030188-01)
References
- 1.Chaurand P, Schwartz SA, Reyzer ML, Caprioli RM. Toxicologic Pathology. 2005;33:92. doi: 10.1080/01926230590881862. [DOI] [PubMed] [Google Scholar]
- 2.Zimmerman TA, Monroe EB, Tucker KR, Rubakhin SS, Sweedler JV. In: Methods in Cell Biology. John JC, William Detrich H III, editors. Vol. 89. Academic Press; 2008. p. 361. [DOI] [PMC free article] [PubMed] [Google Scholar]
- 3.Schwartz SA, Caprioli RM. Meth Molecular Biol. 2010;656:3. doi: 10.1007/978-1-60761-746-4_1. [DOI] [PubMed] [Google Scholar]
- 4.Amstalden van Hove ER, Smith DF, Heeren RMA. J Chrom A. 2010;1217:3946. doi: 10.1016/j.chroma.2010.01.033. [DOI] [PubMed] [Google Scholar]
- 5.Chughtai K, Heeren RMA. Chem Rev. 2010;110:3237. doi: 10.1021/cr100012c. [DOI] [PMC free article] [PubMed] [Google Scholar]
- 6.Meriaux C, Franck J, Wisztorski M, Salzet M, Fournier I. J Proteomics. 2010;73:1204. doi: 10.1016/j.jprot.2010.02.010. [DOI] [PubMed] [Google Scholar]
- 7.Sherrod SD, Diaz AJ, Russell WK, Cremer PS, Russell DH. Anal Chem. 2008;80:6796. doi: 10.1021/ac800904g. [DOI] [PubMed] [Google Scholar]
- 8.Stumpo KA, Russell DH. J Phys Chem C. 2009;113:1641. [Google Scholar]
- 9.Cha S, Song Z, Nikolau BJ, Yeung ES. Anal Chem. 2009;81:2991. doi: 10.1021/ac802615r. [DOI] [PubMed] [Google Scholar]
- 10.Tempez A, Ugarov M, Egan T, Schultz JA, Novikov A, Della-Negra S, Lebeyec Y, Pautrat M, Caroff M, Smentkowski VS, Wang HYJ, Jackson SN, Woods AS. J Proteome Res. 2005;4:540. doi: 10.1021/pr0497879. [DOI] [PubMed] [Google Scholar]
- 11.Sugiura Y, Setou M. Rapid Comm Mass Spectrom. 2009;23:3269. doi: 10.1002/rcm.4242. [DOI] [PubMed] [Google Scholar]
- 12.Jaskolla T, Fuchs B, Karas M, Schiller J. J Am Soc Mass Spectrom. 2009;20:867. doi: 10.1016/j.jasms.2008.12.028. [DOI] [PubMed] [Google Scholar]
- 13.Teuber K, Schiller J, Fuchs B, Karas M, Jaskolla TW. Chemistry and Physics of Lipids. 2010;163:552. doi: 10.1016/j.chemphyslip.2010.04.005. [DOI] [PubMed] [Google Scholar]
- 14.Colsch B, Jackson SN, Dutta S, Woods AS. Neuroscience ACS. 2011;2:213. doi: 10.1021/cn100096h. [DOI] [PMC free article] [PubMed] [Google Scholar]
- 15.Lechene C, Hillion F, McMahon G, Benson D, Kleinfold AM, Kampf JP, Distel D, Luyten Y, Bonventre J, Hentschel D, Park KM, Ito S, Schwartz M, Benichou G, Slodzian G. J BioI. 2006;5:20.1. doi: 10.1186/jbiol42. [DOI] [PMC free article] [PubMed] [Google Scholar]
- 16.Pacholski ML, Cannon DM, Ewing AG, Winograd N. Rapid Comm Mass Spectrom. 1998;12:1232. doi: 10.1002/(SICI)1097-0231(19980930)12:18<1232::AID-RCM319>3.0.CO;2-G. [DOI] [PubMed] [Google Scholar]
- 17.Bouneau S, Brunelle A, Della Negra S, Depauw J, Jacquet D, LeBeyec Y, Pautrat M, Fallavier M, Poizat JC, Andersen HH. Phys Rev B. 2002;65:144106. [Google Scholar]
- 18.Touboul D, Kollmer F, Niehuis E, Brunelle A, Laprevote O. J Am Soc Mass Spectrom. 2005;16:1608. doi: 10.1016/j.jasms.2005.06.005. [DOI] [PubMed] [Google Scholar]
- 19.Guillermier C, Della Negra S, Rickman RD, Pinnick V, Schweikert EA. Appl Surf Sc. 2006;252:6529. [Google Scholar]
- 20.Winograd N, Postawa Z, Cheng J, Skazal C, Kozole J, Garrison BJ. Appl Surf Sci. 2006;252:6836. [Google Scholar]
- 21.Tempez A, Schultz JA, Della-Negra S, Depauw J, Jacquet D, Novikov A, Lebeyec Y, Pautrat M, Caroff M, Ugarov M, Bensaoula H, Gonin M, Fuhrer K, Woods A. Rapid Comm Mass Spectrom. 2004;18:371. doi: 10.1002/rcm.1342. [DOI] [PubMed] [Google Scholar]
- 22.Brunelle A, Della-Negra S, Deprun C, Depauw J, Håkansson P, Jacquet D, le Beyec Y, Pautrat M. Int J Mass Spectrom Ion Processes. 1997;164:193. [Google Scholar]
- 23.Pinnick VT, Verkhoturov SV, Kaledin L, Bisrat Y, Schweikert EA. Anal Chem. 2009;81:7527. doi: 10.1021/ac9014337. [DOI] [PubMed] [Google Scholar]
- 24.Li Z, Verkhoturov SV, Schweikert EA. Anal Chem. 2006;78:7410. doi: 10.1021/ac0603779. [DOI] [PubMed] [Google Scholar]
- 25.Fernandez-Lima FA, Eller MJ, Verkhoturov SV, Della-Negra S, Schweikert EA. J Phys Chem Lett. 2010;1:3510. doi: 10.1021/jz1014345. [DOI] [PMC free article] [PubMed] [Google Scholar]
- 26.Fletcher JS, Conlan XA, Jones EA, Biddulph G, Lockyer NP, Vickerman JC. Anal Chem. 2006;78:1827. doi: 10.1021/ac051624w. [DOI] [PubMed] [Google Scholar]
- 27.Brunelle A, Della-Negra S, Depauw J, Jacquet D, Le Beyec Y, Pautrat M, Baudin K, Andersen HH. Phys Rev A. 2001;63:022902. [Google Scholar]
- 28.Della-Negra S, Depauw J, Guillermier C, Schweikert EA. Surf Interface Anal. 2011;43:62. doi: 10.1002/sia.3592. [DOI] [PMC free article] [PubMed] [Google Scholar]
- 29.Della-Negra S, Arianer J, Depauw J, Verkhoturov SV, Schweikert EA. Surf Interface Anal. 2011;43:66. [Google Scholar]
- 30.Bouneau S, Della-Negra S, Depauw J, Jacquet D, Le Beyec Y, Mouffron JP, Novikov A, Pautrat M. Nucl Instrum Methods Phys Res, Sect B. 2004;225:579. [Google Scholar]
- 31.Verkhoturov SV, Eller MJ, Rickman RD, Della-Negra S, Schweikert EA. J Phys Chem C. 2009;114:5637. [Google Scholar]
- 32.Delvolve AM, Colsch B, Woods AS. Analytical Methods. doi: 10.1039/c1ay05107e. [DOI] [PMC free article] [PubMed] [Google Scholar]
- 33.Jackson SN, Wang HYJ, Woods AS. J Am Soc Mass Spectrom. 2005;16:2052. doi: 10.1016/j.jasms.2005.08.014. [DOI] [PubMed] [Google Scholar]
- 34.Jackson SN, Ugarov M, Egan T, Post JD, Langlais D, Schultz JA, Woods AS. J Mass Spectrom. 2007;42:1093. doi: 10.1002/jms.1245. [DOI] [PMC free article] [PubMed] [Google Scholar]
- 35.Wehbe N, Fallavier M, Negra SD, Depauw J, Brunelle A, Andersen HH. Nucl Instrum Methods Phys Res, Sect B. 2010;268:2596. [Google Scholar]
- 36.Novikov A, Caroff M, Della-Negra S, Depauw J, Fallavier M, Le Beyec Y, Pautrat M, Schultz JA, Tempez A, Woods AS. Rapid Comm Mass Spectrom. 2005;19:1851. doi: 10.1002/rcm.1995. [DOI] [PubMed] [Google Scholar]
- 37.Hager GJ, Guillermier C, Verkhoturov SV, Schweikert EA. Appl Surf Sci. 2006;252:6558. [Google Scholar]
- 38.Fernandez-Lima FA, Eller MJ, DeBord JD, Verkhoturov SV, Della-Negra S, Schweikert EA. Nucl Instrum Methods Phys Res, Sect B. doi: 10.1016/j.nimb.2011.07.092. accepted. [DOI] [PMC free article] [PubMed] [Google Scholar]
- 39.Jackson S, Wang H, Woods A. J Am Soc Mass Spectrom. 2007;18:17. doi: 10.1016/j.jasms.2006.08.015. [DOI] [PubMed] [Google Scholar]


