

Abstract
Relay neurons in dorsal thalamic nuclei can fire high-frequency bursts of action potentials that ride the crest of voltage-dependent transient (T-type) calcium currents [low-threshold spike (LTS)]. To explore potential nucleus-specific burst features, we compared the membrane properties of dorsal lateral geniculate nucleus (dLGN) and pulvinar nucleus relay neurons using in vitro whole-cell recording in juvenile and adult tree shrew (Tupaia) tissue slices. We injected current ramps of variable slope into neurons that were sufficiently hyperpolarized to de-inactivate T-type calcium channels. In a small percentage of juvenile pulvinar and dLGN neurons, an LTS could not be evoked. In the remaining juvenile neurons and in all adult dLGN neurons, a single LTS could be evoked by current ramps. However, in the adult pulvinar, current ramps evoked multiple LTSs in >70% of recorded neurons. Using immunohistochemistry, Western blot techniques, unbiased stereology, and confocal and electron microscopy, we found that pulvinar neurons expressed more T-type calcium channels (Cav 3.2) and more small conductance potassium channels (SK2) than dLGN neurons and that the pulvinar nucleus contained a higher glia-to-neuron ratio than the dLGN. Hodgkin–Huxley-type compartmental models revealed that the distinct firing modes could be replicated by manipulating T-type calcium and SK2 channel density, distribution, and kinetics. The intrinsic properties of pulvinar neurons that promote burst firing in the adult may be relevant to the treatment of conditions that involve the adult onset of aberrant thalamocortical interactions.
Introduction
Most dorsal thalamic neurons fire in at least two different modes: single action potentials (tonic mode) and high-frequency bursts of action potentials (burst mode) that ride the crest of voltage-dependent transient (T-type) calcium currents [low-threshold spike (LTS)] (Llinás and Steriade, 2006). In vivo recordings have demonstrated that rhythmic burst firing in the thalamus is most common during sleep, while tonic firing is more common when animals are alert and attentive (Glenn and Steriade, 1982). Proposed functions of thalamic burst firing include disrupting the propagation of sensory signals to the cortex during sleep and/or consolidating memory traces acquired during the waking state (Llinás and Steriade, 2006). Burst firing can also occur when animals are awake (Guido and Weyand, 1995; Bezdudnaya et al., 2006; Wang et al., 2007), and analysis of activity patterns in the dorsal lateral geniculate nucleus (dLGN) suggests that burst firing can provide a nonlinear amplification of sensory signals (Guido et al., 1995). Burst firing activates cortical neurons more efficiently than tonic firing, potentially providing further amplification of the thalamocortical relay of sensory signals (Swadlow and Gusev, 2001; Boudreau and Ferster, 2005; Hull et al., 2009). Thus, burst firing may additionally serve as a cortical wake-up call for the detection of novel, previously unattended stimuli (Guido and Weyand, 1995).
Burst firing may also serve nucleus-specific functions. In vitro studies have revealed that the kinetics of LTSs in the thalamic reticular nucleus and centrolateral nucleus are distinct from those of most other dorsal thalamic nuclei (Huguenard and Prince, 1992; Steriade et al., 1993), and significant variations across dorsal thalamic nuclei in the percentage of spikes fired as a part of a burst have been found using in vivo recordings. In anesthetized guinea pigs, burst firing was much more common in the nonleminiscal versus the leminiscal subdivision of the medial geniculate nucleus (He and Hu, 2002); in awake primates, burst firing was found to be much more common in the mediodorsal nucleus and pulvinar nucleus compared with the dLGN (Ramcharan et al., 2005).
Identification of the mechanisms underlying nucleus-specific burst firing is important not only for understanding the functions of the burst firing mode, but also for developing treatments for conditions that involve aberrant burst firing (Huguenard and McCormick, 1992; Graef et al., 2009; Uhlhaas and Singer, 2010). To better understand these mechanisms, we compared the firing properties of neurons in the dLGN and the pulvinar of the tree shrew (Tupaia belangeri), a species similar to primates in terms of the functional organization of its visual system (Campbell, 1980). By using in vitro electrophysiology, immunocytochemistry, Western blot techniques, confocal and electron microscopy, stereology, and neuron modeling, we obtained results that suggest that, relative to the dLGN, pulvinar neurons display an increased propensity to fire in bursts. Pulvinar neurons express a greater density of T-type calcium channels, and T-channel density is a key factor in determining burst firing propensity.
Materials and Methods
A total of 23 tree shrews [Tupaia belangeri; 14 adults (>3 months old), 9 juveniles (3 weeks old)] were used for these experiments. All procedures were approved by the Institutional Animal Care and Use Committee of the University of Louisville.
Slice preparation.
Thalamic slices (400 μm) were prepared from seven juvenile and five adult male and female tree shrews (Li et al., 2003). Briefly, the animals were deeply anesthetized with carbon dioxide and decapitated, the brain was excised, and a block of tissue containing the thalamus was removed and placed in an ice-cold oxygenated solution of modified artificial CSF (ACSF) containing the following (in mm): 206 sucrose, 2.5 KCl, 1 CaCl2, 1 MgSO4 1 MgCl2, 1.25 NaH2PO4, 26 NaHCO3, 10 glucose at a pH of 7.4 and equilibrated with 95% O2/5% CO2. Parasagittal slices were cut on a vibratome (VT 1000E; Leica Microsystems) at a thickness of 400 μm and transferred into a holding chamber with ACSF containing the following (in mm): 124 NaCl, 2.5 KCl, 2 CaCl2, 1 MgSO4, 1.25 NaH2PO4, 26 NaHCO3, 10 glucose at a pH of 7.4 and equilibrated with 95% O2/5% CO2, where they incubated for at least 2 h before recording.
Electrophysiology.
Whole-cell recordings were obtained from dLGN and pulvinar relay neurons. All recordings were performed in the recording chamber and maintained at 33°C with ACSF (with 10 μm bicuculline and 2.5 μm CGP55845 added; Tocris Bioscience) continually superfused at a rate of 2.0 ml/min. Pipettes were pulled from borosilicate glass (Sutter Instrument) and had a tip resistance of 4–6 MΩ when filled with a solution containing the following (in mm): 115 K-gluconate, 2 MgCl2, 10 HEPES, 10 sodium phosphocreatine, 2 Na2-ATP, 20 KCl, 0.3 Na2-GTP with pH adjusted to 7.2 with KOH (osmolarity 290–295 mOsm). Biocytin (0.5%) was added to allow morphological reconstruction of the recorded neurons. Current-clamp recordings were made with an Axoclamp 2B amplifier (MDS Analytical Technologies), the bridge was continually monitored and adjusted as needed, and a liquid junction potential of 13 mV was corrected. Data were digitized and stored on an IBM-compatible computer for off-line analysis. Only recordings showing stable resting membrane potentials more negative than −50 mV and overshooting action potentials were included in this study (n = 59). For a subset of these cells (n = 4), a combination of tetrodotoxin (TTX; 3.1 μm; Tocris Bioscience), tetraethylammonium chloride (TEA; 20 mm; Sigma), and 4-aminopyridine (4AP; 6 mm; Sigma) was applied (through the broken tip of a pipette located 2 mm from the recording pipette) after initial categorization of LTS responses to examine the properties of the low-threshold calcium current, IT.
Histochemistry.
Neurons were filled with 0.5% biocytin by diffusion from the pipette during recording. At the end of each recording, slices were fixed at 4°C overnight in 4% paraformaldehyde and rinsed several times in 0.1 m phosphate buffer (PB). Slices were then incubated in 10% methanol in PB with 3% hydrogen peroxide to react with the endogenous peroxidase activity of red blood cells. After several rinses in PB, slices were incubated overnight at 4°C under agitation in a 1% solution of a complex of avidin and biotinylated-horseradish peroxidase (ABC; Standard Kit, Vector Laboratories) prepared in 0.3% Triton X-100. The slices were subsequently rinsed, reacted with nickel-intensified 3,3′-diaminobenzidine (DAB) for 5 min, and washed in PB. After rinses in phosphate buffer, slices were mounted onto slides and reconstructed with a Neurolucida system (Micro Bright Field). In some cases, biocytin-filled neurons were revealed by incubating slices in a 1:100 dilution of streptavidin conjugated to Alexa Fluor 546 (Invitrogen) and confocal images of the cells were obtained using an Olympus Fluoview laser scanning microscope (BX61W1).
Western blot analysis.
Six frozen tree shrew brains (3 juvenile and 3 adults) were cut into 250 μm sections using a cryostat (Leica) and mounted on slides. The dLGN and pulvinar were separately dissected from the sections and homogenized in ice-cold RIPA buffer (50 mm Tris–HCl, 150 mm NaCl, 1% Igepal, 0.5% sodium deoxycholate, 0.1% SDS, pH 8.0; Sigma) with a mixture of protease and phosphatase inhibitors (1:100; FabGennix). Tissue was centrifuged at 4°C under 14,000 rpm for 30 min. The supernatant was collected and the protein concentration was estimated using a BCA kit (Pierce Biotechnology). Equal amounts (15 μg) of protein were separated by SDS-PAGE on 10% gels (Bio-Rad) and transferred to PVDF membranes (Millipore). Membranes were blocked with 5% dry milk dissolved in Tris buffered saline, pH 8.0, plus 0.1% Tween 20 (TBST), and incubated at 4°C overnight with either a mouse anti-Cav 3.2 antibody (1:1000; NeuroMab), a rabbit anti-SK2 antibody (1:100, Alomone Labs), or mouse anti-β-actin (1:10,000; Sigma) in 5% bovine serum albumin dissolved in TBST. Antibody binding was detected with an anti-mouse or anti-rabbit antibody conjugated to horseradish peroxidase (1:10,000; Millipore Bioscience Research Reagents) and enhanced chemiluminescence Western blotting detection reagents (GE Healthcare Life Science). For quantitative analysis, the density of the labeled bands was measured with a computerized image analysis system (Alpha Innotech) as integrated density values, normalized to integrated density values of bands labeled for β-actin.
Immunohistochemistry.
Four tree shrews (1 juvenile and 3 adults) were given an overdose of sodium pentobarbital (250 mg/kg) and were perfused through the heart with Tyrode solution, followed by a fixative solution of 4% paraformaldehyde in 0.1 m PB. The brain was removed from the skull, sectioned into 50-μm-thick slices using a vibratome (Leica VT100E), and collected in a solution of 0.1 m PB. The sections were incubated at 4°C overnight with mouse monoclonal anti-Cav 3.2 antibody (1:200; NeuroMab), rabbit polyclonal anti-SK2 (1:100; Alomone Labs), or mouse anti-neurofilament protein (SMI-32; 1:5000; Sternberger Monoclonal) and rabbit polyclonal anti-SK2. The following day, the sections were rinsed in PB and incubated for 1 h in an anti-mouse antibody conjugated to Alexa Fluor 488 (1:100; Invitrogen) and/or an anti-rabbit antibody conjugated to Alexa Fluor 546 (1:100; Invitrogen). The sections were rinsed in PB and incubated for 30 min in the fluorescent DNA marker 4′,6-diamidino-2-phenylindole (DAPI; 3 μm; Invitrogen).The sections were subsequently rinsed in PB and mounted on slides for confocal microscopic examination. Additional sections were incubated at 4°C overnight with an antibody against glutamic acid decarboxylase (GAD; 1: 4000; Millipore Bioscience Research Reagents) and the following day the sections were rinsed in PB and incubated for 1 h in a biotinylated anti-rabbit antibody (1:100; Vector Laboratories). After several rinses in PB, the sections were incubated in ABC for 1 h, reacted with DAB for 5 min, and mounted onto slides for cell size analysis.
Stereology.
Three tree shrew (1 juvenile and 2 adult) brains were fixed and sectioned into 50-μm-thick slices using a vibratome (Leica VT100E). The sections were incubated at 4°C overnight with mouse monoclonal anti-neuronal nuclei (NeuN) antibody (1:200; Millipore Bioscience Research Reagents). The following day, the sections were rinsed in PB and incubated for 1 h in an anti-mouse antibody conjugated to Alexa Fluor 488 (1:100; Invitrogen) with DAPI (3 μm; Invitrogen) for 1 h. After being rinsed in PB, sections were mounted on slides for light and confocal microscopic examination.
Using the differential staining of neurons and glial cells with the NeuN antibody and DAPI as previously described (Azevedo et al., 2009), the densities of neurons and glia in the juvenile and adult dLGN and pulvinar were quantified using Stereo Investigator (version 7) software (MBF Bioscience). All experimenters were blind to age of the animals. A contour was drawn around the dLGN or pulvinar under low magnification (4×) and, within each traced contour, the computer determined the placement of random counting frames. The depth (z-axis) of the counting frame was equal to the minimal thickness of the section, minus a total guard zone of 6 μm (3 μm from the top and 3 μm from the bottom of the section). Neurons and glia were counted in the volume designated by each counting frame (25 μm2) and were only counted once, when they first came into focus. The total numbers of neurons and glial cells were then estimated for the entire volume using the optical fractionator probe (MBF Bioscience).
Cell size analysis and electron microscopy.
Sections from juvenile (n = 1) and adult (n = 3) tree shrew brains containing the dLGN or pulvinar were postfixed in 2% osmium tetroxide, dehydrated in an ethyl alcohol series, and flat embedded in Durcupan resin between two sheets of Aclar plastic (Ladd Research). Durcupan-embedded sections were first examined with a light microscope to select areas for further analysis. Selected areas of the dLGN or pulvinar were mounted on resin blocks and cut into 1 μm or ultrathin (70–80 nm; silver-gray interference color) sections with an ultramictrotome (Leica Ultracut E). One-micrometer-thick sections were collected on glass slides and stained with toluidine blue. A Neurolucida system and tracing software (MBF Bioscience) were used to measure the soma areas of dLGN and pulvinar neurons. Neuronal somata were measured only at the level where a clear nucleolus was visible in the section. Ultrathin sections were collected on Formvar-coated nickel slot grids. The grids were stained with a 10% solution of uranyl acetate in methanol for 30 min before examination with an electron microscope.
Statistical analysis.
Student's t tests or two-way ANOVA were used to test for statistical significance. Quantitative data are expressed as means ± SD. The significance level was set at p < 0.05 for all statistical comparisons.
Neuronal modeling.
A compartmental model of a thalamic relay neuron was developed to investigate the hypothesis formulated by the experimental results. The model had three compartments representing the soma, proximal dendrites, and distal dendrites. Voltage-dependent conductances were modeled using a Hodgkin—Huxley-type kinetic models (Hodgkin and Huxley, 1952).
The somatic compartment generated action potentials and contained a fast sodium current (INa), a delayed rectifier potassium current (IK), a leak current (Ileak), and an Na+/K+ pump, as well as calcium dynamics. Kinetics of INa and IK, based on Traub et al. (1991), had maximal conductances of gNa = 100 mS/cm2 and gK = 100 mS/cm2, with reversal potentials of ENa = 50 mV and EK = −100 mV. The two dendritic compartments also contained Ileak.
In addition, IT was distributed in all the compartments. Because no data currently exist to constrain the localization and kinetics of IT in the tree shrew, we used the kinetics of activation and inactivation of IT in thalamocortical (TC) cells from rodents (Huguenard and McCormick, 1992; Destexhe et al., 1998). This calcium current was described by the following Goldman–Hodgkin–Katz constant-field equations:
 |
 |
 |
where P̄Ca (cm/s) is the maximum permeability of the membrane to Ca2+ ions, and m and h are the activation and inactivation variables, respectively. G(V, Ca0, Cai) is a nonlinear function of voltage and ionic concentrations, as follows:
 |
where Z = 2 is the valence of calcium ions, F is the Faraday constant, R is the gas constant, and T is the temperature expressed in degrees Kelvin. Cai and Cao are the intracellular and extracellular Ca2+ concentrations (in M), respectively. Expressions for the steady-state activation and inactivation functions were taken from voltage-clamp experiments on dissociated TC cells (Huguenard and McCormick, 1992; Huguenard and Prince, 1992). Kinetics parameters for the activation time constant and the voltage dependence of the activation steady-state were varied to reproduce the differences observed between neurons with low, medium, and high burst propensities. Exploring the parameter space, the activation parameters were optimized to reproduce our experimental results in the presence of a slow depolarizing ramp, as follows:
 |
 |
with ϕ = 5(celsius − 24)/10, and where V1/2 = −82 mV for multiple occurrences of LTSs and V1/2 = −77 for a single occurrence of a LTS. The voltage-dependent time constant for activation was
 |
also optimized with ε = 1 for multiple occurrences of LTSs and ε = 5 for a single LTS. For inactivation, it was as follows:
 |
These functions correspond to an external Ca2+ concentration of 2 mm at a temperature of 36°C. Calcium handling was modeled by a first-order system representing Ca2+ transporters and buffers (McCormick and Huguenard, 1992) with a time constant for Ca2+ decay of 5 ms. At equilibrium, the free intracellular Ca2+ concentration was 240 nm and the extracellular Ca2+ concentration was 2 mm (i.e., ECa = 120 mV). A set of T-current densities ranging from 0 to 2 × 10⁻⁴ cm/s was simulated in perisomatic and dendritic compartments to reproduce the experimental observations.
The effect of the presence of small-conductance calcium-activated potassium (SK) channels in the relay cells was also assessed. SK2 channels produced a current described by
 |
where the conductance gSK = 2 mS · cm−2, and the gating parameter mSK follows
 |
The steady-state activation parameter mSK,∞[Ca2+]i had a fourth power (n = 4) dependence in [Ca2+]i, with the forward rate constant α = 0.5 × 10¹² ms−1mm−4 and β = 0.26 ms−1.
Simulations were performed with the NEURON computer program that used a Runge–Kutta fourth-order integration method. Analyses of computational data were performed with MatLab 7.
Results
Neurons with low, medium, and high burst propensity in the pulvinar and dLGN
Our electrophysiological results are based on whole-cell recordings from 59 neurons in the dLGN and pulvinar from slices of juvenile (n = 7) and adult (n = 5) tree shrew brains. The location of the dLGN and pulvinar recordings in parasagittal slices is indicated in Figure 1. Because the individual dLGN lamina could not be accurately identified in the slices, recordings were obtained in the central regions of the dLGN likely including layers 2–5. All recordings in the pulvinar were obtained from either the dorsal (Pd) or central (Pc) subdivisions, which receive input from the superior colliculus and temporal cortex (Chomsung et al., 2008, 2010). Biocytin was included in the recording pipette and all recovered cells (n = 20) displayed morphologies consistent with their identification as relay cells (widespread dendritic arbors; Fig. 1B). The soma sizes of filled cells in the pulvinar were significantly larger (224.13 ± 48.85 μm2; n = 8) than that of pulvinar interneurons stained with an antibody against GAD (96.38 ± 20.92 μm2; n = 50; p < 0.05). Burst and tonic firing (Fig. 1C–E) could be elicited in most neurons (48 of 59; 81%).
Figure 1.

In vitro recording methods. A, A parasagittal section of the tree shrew brain stained for Nissl substance illustrates the location of the whole-cell recordings in either the dLGN (outlined in green) or the pulvinar nucleus (PUL; outlined in red). D, dorsal, R, rostral, SC, superior colliculus. B, A confocal image of an adult pulvinar cell filled with biocytin during recording (scale bar, 20 μm). All successfully filled cells exhibited morphologies consistent with their identification as relay cells. C–E, Voltage fluctuations were recorded in response to the injection of depolarizing or hyperpolarizing current steps of varying size (C, adult pulvinar cell) as well in response to depolarization (D, adult pulvinar cell) or hyperpolarization (E, adult pulvinar cell) of the membrane potential through constant current injection.
To activate LTSs in thalamic relay neurons, cells must be depolarized after being sufficiently hyperpolarized to de-inactivate IT. To do so, neurons were either injected with a series of hyperpolarizing 500 ms current steps of varying size (−200 to −50 pA; Fig. 2A–C) or with a series of depolarizing current ramps varying in slope (duration varied from 0.5 to 10 s while the amplitude of the current ramp remained constant; Fig. 3). To ensure the full de-inactivation of IT during the ramp current injections, the membrane potential of the recorded neurons was adjusted to −80 mV before application of the current ramps. The amplitude and rate of rise of the current ramps were sufficient to pass the LTS activation zone and to subsequently activate tonic firing.
Figure 2.

Three types of neurons are distinguished by their responses to hyperpolarizing current steps. Injection of hyperpolarizing (−50 to −200 pA) current steps (500 ms in duration) revealed three categories of responses. A, Low burst propensity. An LTS could not be elicited in a small percentage of neurons in both the juvenile dLGN and pulvinar (shown is a juvenile dLGN neuron). B, Medium burst propensity. Most recorded neurons responded to hyperpolarizing current steps with a single rebound LTS (shown is a juvenile pulvinar neuron). C, High burst propensity. Most neurons in the adult pulvinar responded to hyperpolarizing current steps with multiple LTSs (shown is an adult pulvinar neuron). D, The proportion of the three types of cells recorded in the juvenile and adult dLGN and pulvinar (PUL) are indicated as a normalized percentage of neurons recorded in each group.
Figure 3.

Three types of neurons are distinguished by their responses to depolarizing current ramps. Current ramps of variable slope (400 pA; durations of 2, 4, 6, 8, and 10 s) were injected into neurons that were sufficiently hyperpolarized to de-inactivate T-type calcium channels (−80 mV). The ramps ensured that all cells were sufficiently depolarized to pass the LTS activation window to elicit tonic firing. A, Low burst propensity neuron. Current ramps evoke action potentials but not LTSs (juvenile dLGN neuron shown). B, Medium burst propensity neuron. Steep current ramps evoke a single LTS (juvenile pulvinar neuron shown). C, High burst propensity neuron. Current ramps of variable slope evoke multiple LTSs (adult pulvinar neuron shown).
Based on the responses to hyperpolarizing current steps or ramps, we identified three types of neurons that exhibited significant variation in their propensity to fire bursts of action potentials (Figs. 2, 3). In a minority of neurons within the juvenile dLGN (n = 2) and juvenile pulvinar nucleus (n = 9), we did not observe any LTSs (low burst propensity; Figs. 2A, 3A). In most neurons within the juvenile dLGN (n = 9) and juvenile pulvinar (n = 22), as well as all neurons in the adult dLGN (n = 7), only single LTSs could be produced (medium burst propensity; Figs. 2B, 3B). However, within the adult pulvinar, multiple LTSs were elicited by either current steps or ramps in the majority of the recorded neurons (high burst propensity; n = 7; Figs. 2C, 3C). The remaining neurons in the adult pulvinar responded to current ramps with a single LTS (n = 3). The proportions of these three types of neurons within the adult dLGN and pulvinar are illustrated in Figure 2D.
Comparison of medium and high burst propensity neurons
To compare the burst firing properties of medium and high burst propensity neurons, we quantified the effects of the slope (dV/dt) of depolarizing current ramps on the number of action potentials per LTS, the interspike intervals, and the maximum slope of the elicited LTSs. In medium burst propensity neurons, a strong positive correlation was observed between the number of action potentials riding the crest of an LTS and dV/dt (Fig. 4A,C). A similar relationship was observed between the maximum rate of rise of the LTS and the slope of depolarizating ramps in medium (single-LTS) burst propensity neurons (Fig. 4F). To measure the maximum rate of LTS rise, TTX, 4AP, and TEA were applied and voltage responses of the recorded cell to current ramps were obtained and temporally differentiated. In the differentiated trace, the voltage baseline was determined before the onset of current ramp and the maximum rate of LTS rise was measured.
Figure 4.

Current ramps reveal distinct firing characteristics of medium and high burst propensity neurons. A, C, Expanded traces from a medium burst propensity neuron in the juvenile pulvinar (A). The number of action potentials per LTS decreased with ramp slope (C). B, D, Expanded traces from a high burst propensity neuron in the adult pulvinar (B). Regardless of ramp slope, the number of action potentials that rode the crest of the first LTS remained constant, but each subsequent LTS initiated decreasing numbers of action potentials (D). E, Multiple LTSs evoked by a current ramp in a high burst propensity neuron in the adult pulvinar nucleus; a, b, and c indicate traces expanded below that evoke 6, 4, and 2 action potentials, respectively. F, The maximum slope of the LTS in medium and high burst propensity neurons increased with increasing ramp slope. G, In both medium and high burst propensity neurons, interspike intervals (ISI) increased with the addition of action potentials to the burst sequence.
In contrast, we found that the number of action potentials riding the crest of the first LTS elicited by each current ramp was relatively constant in high (multi-LTS) burst propensity neurons recorded in the adult pulvinar nucleus (Fig. 4B).There was no correlation between the number of action potentials and the slope dV/dt (Fig. 4D), although there was still a positive correlation preserved between the maximum rate of LTS rise and dV/dt (Fig. 4F). In both medium and high burst propensity neurons, interspike intervals increased with the addition of action potentials to the burst sequence (Fig. 4G). In high burst propensity neurons, the number of triggered LTSs decreased with increases in dV/dt (Fig. 4D). Although the number of action potentials riding the first LTS triggered by each current ramp was unrelated to dV/dt (Fig. 4B,D), the number of action potentials riding each subsequent LTS decreased (Fig. 4D,E).
Cav 3.2 expression in the pulvinar and dLGN
We also wanted to determine whether the greater propensity of pulvinar neurons to fire in burst mode could be due to an increased density of calcium channels. To do this, we used an antibody against the α-1H subunit of the voltage-dependent T-type calcium channel (Cav 3.2) for immunocytochemistry and Western blot techniques. The Cav 3.2 antibody stains neurons in both the dLGN and pulvinar (Fig. 5A,B). Glial cells, identified by dense nuclear staining with DAPI (Fig. 6), were not stained with the Cav 3.2 antibody.
Figure 5.
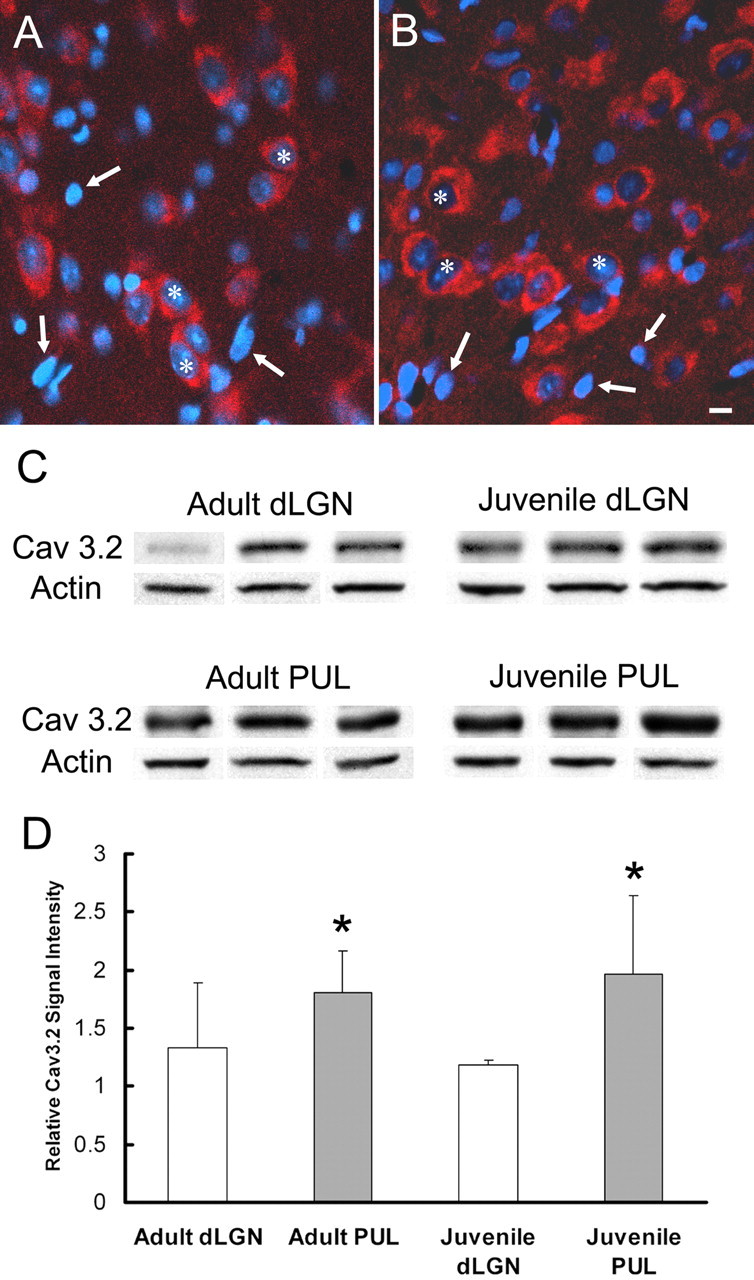
The pulvinar nucleus contains more T-type calcium channels than the dLGN. A, B, Confocal images of the pulvinar (A) and dLGN (B) stained for the α-1H subunit of the T-type calcium channel (Cav 3.2; red) and DAPI (blue) illustrate Cav 3.2 labeling of neurons (asterisks indicate nuclei lightly stained with DAPI) but not glial cells (arrows indicate nuclei intensely stained with DAPI). Scale bar: (in B) A, B. C, Western blots of dLGN and pulvinar (PUL) tissue samples from three juvenile and three adult animals illustrate greater staining intensity of the Cav 3.2 antibody in the pulvinar, regardless of age. An antibody against β actin was used to correct for loading errors. D, Quantification of the Western blot signal intensities reveals significantly more intense staining in the pulvinar compared with the dLGN (pulvinar vs dLGN, p = 0.05, using a two-way ANOVA test, indicated by asterisks).
Figure 6.

The pulvinar nucleus contains fewer neurons than the dLGN. A–F, Correlation of light microscopic images of DAPI staining (A, E) and electron microscopic images (B–D, F) of the pulvinar (A–D) and dLGN (E, F) illustrates the distinct density and distribution of DNA within neuronal and glial cell nuclei. In neurons, regions of condensed chromatin (A, B, E, F, black asterisks) surround nucleoli (B, F, white asterisks) or are sparsely distributed in the nucleus. In contrast, chromatin is relatively condensed through glial cell nuclei, resulting in intense staining of the entire nucleus with the DAPI stain (A, B). Using these staining characteristics to identify neurons and glial cells, as well as NeuN immunocytochemical staining as a second means to identify neurons, unbiased stereological techniques were used to count neurons and glial cells within the dLGN and pulvinar. G, H, Confocal images of the pulvinar (G) and dLGN (H) stained for DAPI (blue) and NeuN (red) illustrate examples of neurons (white asterisks) and glial cells (arrows). Scale bars: (in A) A, E, 2 μm; (in F) B–D, F, 1 μm; (in H) G, H, 10 μm. I, There were no significant differences between the cell densities (neurons + glia) counted within the juvenile and adult dLGN and pulvinar (PUL). J, At each age, the glia-to-neuron ratio was significantly higher in the pulvinar when compared with the dLGN (adult, p = 0.036; juvenile, p = 0.0005, using a t test, indicated by asterisks).
We performed a quantitative comparison of Cav 3.2 expression in samples of pulvinar and dLGN tissue collected from three juvenile and three adult brains. An antibody against β-actin was used to correct for sample loading discrepancies (Fig. 5C). This analysis revealed no significant difference between expression levels in juvenile versus adult tissues. However, at both ages, pulvinar tissue was found to contain a higher relative density of Cav 3.2 (juvenile, 1.96 ± 0.67; adult, 1.80 ± 0.35) than dLGN tissue (juvenile, 1.18 ± 0.03; adult, 1.32 ± 0.57). This difference was found to be significant at p = 0.05 level using a two-way ANOVA test (Fig. 5D).
Neuron size and density in the pulvinar and dLGN
To relate the Western blot results to neuronal Cav 3.2 channel density, we used unbiased stereology techniques to compare the neuron and glial cell densities in the dLGN and pulvinar. In neurons, regions of condensed chromatin (Fig. 6A,B,E,F, black asterisks) surround nucleoli (Fig. 6B,F, white asterisks) or are sparsely distributed in the nucleus. In contrast, chromatin is relatively condensed through glial cell nuclei, resulting in intense staining of the entire nucleus with the DAPI stain (Fig. 6A,E). Using these staining characteristics to identify neurons and glial cells, as well as NeuN immunocytochemical staining as a second means to identify neurons, unbiased stereological techniques were used to count neurons and glial cells within the dLGN and pulvinar.
There were no significant differences in cell density in each nucleus (in cells/mm2: juvenile dLGN, 5112 ± 1514; adult dLGN, 6510 ± 1742; juvenile pulvinar, 4653 ± 459; adult pulvinar, 3929 ± 488; Fig. 6I), but we found a nearly equal number of glia and neurons in the dLGN (glia-to-neuron ratio 1.21:1 in juvenile and 1.19:1 in adult), while the pulvinar nucleus contained a significantly higher percentage of glial cells (glia-to-neuron ratio 2.23:1 in juvenile and 2.72:1 in adult; p = 0.0005 juvenile, p = 0.036 adult, using a t test; Fig. 6J). Therefore, the neuron density in the dLGN is 1.6–2.8 times higher than that found in the pulvinar nucleus. Additionally, although there was no significant difference in the size of neurons in the juvenile dLGN and pulvinar, we found that adult dLGN cells were significantly larger as a group when compared with pulvinar cells (p < 0.001 using a two-way ANOVA test). The combined Western blot analysis, stereology, and cell size measurements suggest that the membrane density of T-type calcium channels expressed by individual pulvinar neurons is significantly higher than that expressed by individual dLGN neurons.
T-channel density changes burst firing propensity
To further assess our working hypothesis that differences in the burst firing propensity of dLGN and pulvinar neurons stem from variations in the density of the T-type calcium channel (Cav 3.2), we developed a computational model of a thalamic relay cell composed of three compartments representing the soma, the proximal dendrites, and the distal dendrites, each of which contained T-type calcium channels (see Materials and Methods, above). As the densities of T-type calcium channels varied in the perisomatic and distal dendritic compartments, we were able to produce five qualitatively distinct firing patterns in response to a 2 s depolarizing current ramp injection (Fig. 7).
Figure 7.

T-channel density changes burst firing propensity. Five representative types of responses to depolarizing current injection (2 s current ramp) from rest were obtained by varying the T-channel density in the perisomatic (0–10−5 cm/s) or distal dendritic (0.75 × 10⁻⁴ to 2 × 10⁻⁴ cm/s) compartments. Variations in T-channel density in the distal dendritic compartment were most effective in altering burst firing propensity. Below a distal dendritic T-channel density of 10−4 cm/s, the model's response was passive (A, gray). As the distal dendritic T-channel density was increased to values close to 10−4 cm/s, a calcium spike was generated without crowning actions potentials (B, blue). With distal dendritic T-channel density >10−4 cm/s, a single LTS burst was elicited (C, green). Further increases in distal dendritic T-channel density resulted in multiple LTS bursts (D, orange), and at 2 × 10⁻⁴ cm/s, the current ramp elicited multiple LTS bursts as well as rhythmic bursts following current ramp offset (E, pink).
Below a distal dendritic T-channel density of 10−4 cm/s, the model's response was passive during the depolarizing ramp, incapable of eliciting a calcium spike [Fig. 7, Passive (A), gray]. As the distal dendritic T-channel density was increased to values close to 10−4 cm/s, a calcium spike could be elicited by the current ramp, but the LTS amplitude was insufficient to trigger action potentials [Fig. 7, Subthreshold (B), blue]. When the distal dendritic T-channel density was further increased to values >10−4 cm/s, a single LTS burst was elicited by the current ramp [Fig. 7, Single-LTS (C), green]. Further increases in the distal dendritic T-channel density resulted in a transition to multiple LTS bursts in response to the current ramp [Fig. 7, Multi-LTS (D), orange]. Finally, when the density of T-channels in the distal dendrite compartment was increased up to 2 × 10⁻⁴ cm/s, the current ramp elicited multiple LTS bursts as well as rhythmic bursts following current ramp offset [Fig. 7, Multi-LTS/rhythmic (E), pink].
In contrast to the dramatic changes in firing properties produced by variations in T-channel density within the distal dendritic compartment, density variations for that channel within the perisomatic compartment did not significantly alter burst firing propensity, as illustrated in Figure 7 (perisomatic vs distal dendritic T-channel densities). The nearly vertical transitions between the five firing modalities indicate that burst firing propensity is primarily influenced by dendritic T-channel density, although varying the perisomatic T-channel density did affect the number of action potentials crowning the calcium spike (data not shown).
We further modified our model to more faithfully replicate our in vitro experimental data by adjusting the kinetic properties of the T-type calcium channels (Fig. 8). Using the kinetics of IT described for rodent thalamocortical cells (see Materials and Methods, above) (Huguenard and McCormick, 1992; Destexhe et al., 1998), our model initially produced one or more subthreshold LTSs following the single-LTS pattern (Fig. 8A, left, black trace). However, these subsequent subthreshold LTSs were never observed following a single LTS with Na+ spikes in our electrophysiological recordings (Fig. 3B). To increase the correspondence with our experimental data, we slowed down the channel kinetics by shifting the steady-state inactivation variable, h∞, toward more depolarized potentials (Fig. 8B, red curve), and by increasing the voltage-dependent activation time constant, τm, by fivefold as a result of a search in their respective parameter space (Fig. 8C, red curve). These modifications led to a slower T-channel activation and smaller subthreshold burst responses, which increased the correspondence with our experimental results (Fig. 8A, right, red trace).
Figure 8.
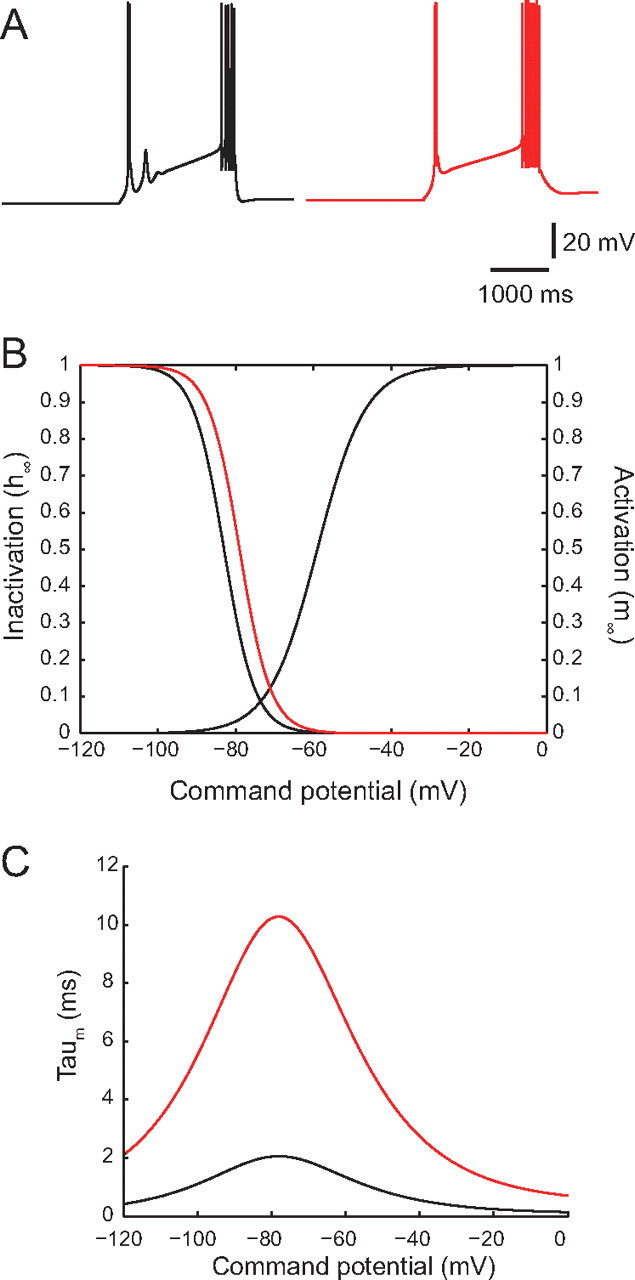
Slower T-channel kinetics were required to replicate medium burst propensity (single-LTS) responses. A, Our initial model faithfully replicated the experimental high burst propensity (multi-LTS) responses, but medium burst propensity responses produced by the model included one or more subthreshold LTSs following the single-LTS pattern (left, black trace), which were not present in our experimental data. B, C, To increase correspondence of the model with experimental data, it was necessary to modify the T-channel kinetics by shifting the steady-state inactivation variable, h∞, toward more depolarized potentials [B; from V1/2 = −82 mV (left, black curve) to V1/2 = −77 mV (left, red curve); with the steady-state activation variable unchanged (right, black curve)], and increasing the voltage-dependent activation time constant, τm, (C, black curve) by fivefold (C; red curve) to produce a single-LTS response which more faithfully reproduced our experimental results (A; right, red trace).
Using the combination of parameters for dendritic densities and kinetics for the T-current described above, we were able to faithfully reproduce the essential properties of the firing patterns recorded in vitro (compare Figs. 3 and 4 to Fig. 9). With a low T-channel density in both somatic and dendritic compartments, no LTS was elicited in response to a depolarizing current ramp (Fig. 9A; compare to Fig. 3A, low burst firing propensity neuron). Because the channel density was too low to elicit any LTS, channel kinetics were irrelevant in this case. By inhomogeneously increasing the density of T-channels in the three-compartment neuron model—the density in the distal dendrites being the most critical—and coupling it with slow channel kinetics, steep depolarizing current ramps elicited a single LTS burst, and subthreshold LTSs were elicited with reduced ramp slopes (Fig. 9B; compare to Fig. 3B, medium burst firing propensity neuron). Further increases of T-channel densities in the distal dendrites, along with modified, faster channel kinetics, produced multiple LTS bursts in response to depolarizing current ramps of varying slopes (Fig. 9C; compare to Fig. 3C, high burst firing propensity neuron).
Figure 9.

Cell models reproduce experimental results. Current ramps of variable slope (duration varying from 2 to 10 s) were simulated and injected into a computational model of a thalamic relay cell. Before the injection of the depolarized current ramp, the cell membrane voltage was maintained at a potential of −80 mV for 2 s to ensure proper de-inactivation of T-type calcium channels. All cells were depolarized sufficiently by the current ramp to elicit regular tonic firing. A, In the presence of a low density of T-type calcium channels in both somatic and dendritic compartments (perisomatic density: 8.5 × 10⁻⁶ cm/s; dendritic density: 3.78 × 10⁻⁵ cm/s), the current ramp failed to elicit any LTS (similar to low burst propensity neurons; compare to Fig. 3A). Tonic spiking was unaffected. B, Increasing the density of T-type calcium channels inhomogeneously in all three compartments of the model cell caused a single LTS to be elicited for steep current ramps (similar to medium burst propensity neurons; compare to Fig. 3B). Note that a calcium spike, but no sodium spikes, was generated when the ramp became more gradual. Distal dendrites had a T-current density significantly larger than the proximal and somatic T-current densities (perisomatic density: 1.9 × 10⁻⁵ cm/s; dendritic density: 1.0 × 10⁻⁴ cm/s). C, Further increasing T-current densities and altering T-channel kinetics in both soma and dendrites (perisomatic density: 1.9 × 10⁻⁵ cm/s; dendritic density: 1.8 × 10⁻⁴ cm/s) led to multiple LTSs in response to the application of the current ramp (similar to high burst propensity neurons; compare to Fig. 3C). D, Expanded traces from B. The delay of the single triggered LTS was inversely proportional to the slope of the current ramp (durations of 2, 4, 6, and 8 s) and the number of action potentials on the crown of the LTS increased with the ramp slope (compare to Fig. 4A). E, Expanded traces from the multi-LTS model in C. The time of occurrence of the first LTS is dependent on the ramp slope (inverse relationship), but unlike in D, the number of action potentials crowning the first LTS was less dependent on the slope (compare to Fig. 4B).
Finally, we examined the influence of the current ramp slope, dV/dt, on the number of action potentials per LTS. For medium burst propensity neurons, the number of action potentials crowning the calcium spike increased proportionally to the current ramp slope (Fig. 9D), as observed in our experimental data (Fig. 4A). Increasing the current ramp duration by 100% reduced the number of action potentials riding the crest of the LTS by 50%. In contrast, the number of action potentials crowning the first LTS in a high burst propensity neuron was less dependent on the current ramp slope; for the first three expanded traces in Figure 9E, increasing the current ramp duration by 100% reduced the number of action potentials in the first LTS by only 14.45% (compare to Fig. 4B).
SK2 expression in the dLGN and pulvinar
The small-conductance calcium-activated potassium channel, SK2, has been found to be densely distributed in the thalamic reticular nucleus, which also exhibits a high burst propensity (Cueni et al., 2008). Therefore, we tested whether pulvinar neurons express a higher density of SK2 channels relative to dLGN neurons, using an antibody against the intracellular domain of the SK2 channel for immunocytochemistry and Western blot techniques. The SK2 staining was distributed primarily within dendrites in both the pulvinar nucleus and dLGN. This is illustrated in Figure 10, A and B, in tissue stained with the SK2 antibody and the neurofilament protein antibody, SMI-32, which stains dendrites (Bickford et al., 1998, 2008).
Figure 10.
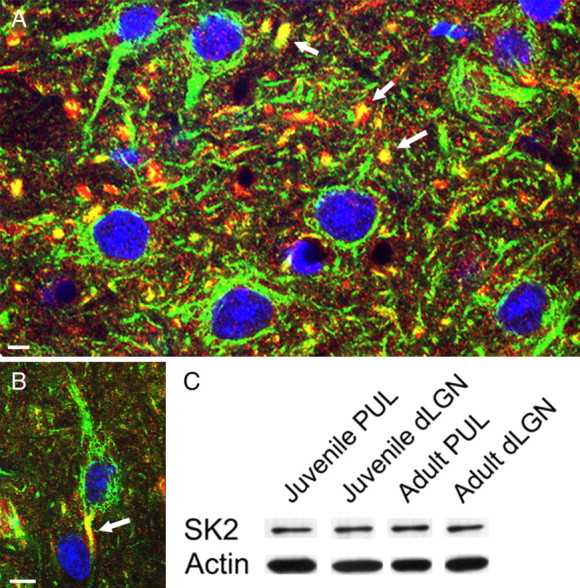
SK2 channels are distributed in dendrites of pulvinar and dLGN neurons. A, B, Confocal images of the dLGN (A) and pulvinar nucleus (B) stained for SK2 (red), high-molecular-weight neurofilament protein (SMI-32 antibody, green), and DAPI (blue) illustrate SK2 labeling of dendrites (yellow and arrows). Scale bars: A, 5 μm; B, 10 μm. C, Western blots of dLGN and pulvinar (PUL) tissue samples from juvenile and adult animals showed no significant differences in staining intensity with the SK2 antibody. An antibody against β actin was used to correct for loading errors.
Western blot analysis revealed no significant difference in the density of SK2 channels in samples of dLGN and pulvinar tissue (Fig. 10C). However, since neuron density in the dLGN is up to 2.8-fold higher than that in the pulvinar nucleus, individual pulvinar neurons could express a greater number of SK2 channels than do dLGN neurons.
SK2 channels do not increase burst firing propensity
We manipulated our model to test whether a change in SK2 channel density could account for the differences in burst firing observed in the pulvinar and dLGN. The addition of SK2 channels to the dendrites of our models of medium and high burst propensity neurons decreased the number of action potentials elicited by each burst, and also decreased burst propensity (Fig. 11A). To match our experimental results, it was necessary to further increase the T-channel density to 3 × 10⁻⁴ cm/s to elicit multiple bursts (Fig. 11B).
Figure 11.

SK2 channels do not increase burst firing propensity. Current ramps of variable slope (duration varying from 2 to 10 s) were simulated and injected into a computational model of a thalamic relay cell, including both T-type calcium current and SK current. Before the injection of the depolarized current ramp, the cell membrane voltage was maintained at a potential of −80 mV for 2 s to ensure proper de-inactivation of T-type calcium channels. All cells were depolarized sufficiently by the current ramp to elicit regular tonic firing. A, The addition of SK2 channels to our model of medium and high burst propensity neurons (illustrated in Fig. 9) decreased burst firing propensity. B, With the same SK2 channel density used in A, T-channel density needed to be increased up to 3 × 10⁻⁴ cm/s to match our in vivo recordings.
Discussion
Pulvinar and dLGN burst propensity
Our results support those of Ramcharan et al. (2005), who found that pulvinar neurons fire bursts of action potentials more often than dLGN neurons, and further indicate that the increased T-type channel density of pulvinar neurons relative to dLGN neurons may be a key factor responsible for this difference. In vivo, the increased T-type channel density of pulvinar neurons may work in concert with a variety of other factors to increase the propensity of pulvinar neurons to fire in bursts. For example, several in vitro studies in other species have noted differences in the responses of pulvinar and dLGN neurons to neurotransmitters such as serotonin and acetylcholine (Monckton and McCormick, 2002; Varela and Sherman, 2007, 2009), which may maintain pulvinar neurons in a more hyperpolarized state relative to dLGN neurons. Indeed, Ramcharan et al. (2005) found that, in vivo, pulvinar neurons have a lower spontaneous firing rate compared with dLGN neurons, suggesting that they are relatively more hyperpolarized.
Ramcharan et al. (2005) also found that pulvinar neurons can fire rhythmically in the awake state, even during the execution of visual tasks, whereas rhythmic firing was never detected in the awake dLGN. Our results suggest that the membrane properties of the pulvinar may also contribute to this phenomenon. Even in vitro, with all ascending and descending inputs transected and all intrinsic GABAergic connections pharmacologically blocked, we found that pulvinar neurons are more prone to fire with a rhythmic burst pattern than dLGN neurons.
Surprisingly, our compartmental model demonstrated that increased oscillatory activity could simply result from increased T-channel densities, even when all other channel densities and kinetics remained unchanged. This suggests that the increased T-channel densities in pulvinar neurons relative to dLGN neurons may be a critical component underlying burst firing propensity. However, given the complex interplay of ion channels involved in initiating and maintaining rhythmic burst firing, it is quite likely that other ion channels are expressed at different densities in pulvinar neurons relative to dLGN neurons. For example, in vitro studies of the dLGN and thalamic reticular nucleus indicate that the burst afterhyperpolarization, as well as the hyperpolarization-activated potassium current Ih, are particularly important in generating rhythmic burst patterns (Avanzini et al., 1989; Bal and McCormick, 1993; Hughes et al., 1998, 1999). High threshold calcium channels, as well as SK channels, have also recently been shown to be important for rhythmic burst firing in the thalamic reticular nucleus (Cueni et al., 2008; Zaman et al., 2011).
To begin to address whether channels other than Cav 3.2 contribute to burst firing propensity, we examined the expression of SK2 channels in the dLGN and pulvinar nucleus. Although we found no significant difference in the density of SK2 channels within dLGN and pulvinar tissue, because the dLGN contains a higher density of neurons than the pulvinar, we concluded that SK2 channels may be expressed at higher levels by individual pulvinar neurons when compared with dLGN neurons. However, our computational efforts revealed that an increase in SK2 channels alone was ineffective in increasing burst firing propensity. In fact, the addition of SK2 channels to our model required us to increase the T-channel density even further to replicate our in vitro recording results. Thus, although further studies are needed to fully explain the mechanisms underlying the high burst firing propensity of pulvinar neurons, these initial experiments suggest that T-channel density may be particularly influential.
Development of burst firing
Comparison of the membrane properties of neurons recorded in juvenile and adult tissues suggests that the high burst propensity displayed by pulvinar neurons develops after 3 weeks of age. This increase in burst propensity is possibly correlated with eye opening, which occurs at that time in tree shrews, although larger sample sizes collected at more time points are needed to confirm this hypothesis. These changes in the thalamic relay neurons observed during development were closely matched in the model by increasing T-channel density within distal dendrites and making small changes in T-channel kinetics. Previous studies have demonstrated developmental changes in T-channel kinetics consistent with these findings (Ramoa and McCormick, 1994).
Within-burst coding
In contrast to previous studies, which observed little variation in the number of spikes elicited by each LTS (Zhan et al., 1999; Gutierrez et al., 2001), we found that for medium burst propensity neurons, the number of action potentials per LTS proportionally increased with the current slope. Furthermore, for high burst propensity neurons, although the number of action potentials that rode the crest of the first LTS remained relatively constant, each subsequent LTS had decreasing numbers of action potentials. These results suggest that bursts are not all-or-none events, and information can be conveyed by the dynamics within each burst. Thus, variations in the T-channel density across nuclei could, in principle, increase the coding repertoire of the thalamus.
Neuron-to-glia ratio in the pulvinar and dLGN
Our investigations of neuron density—performed to more precisely interpret our Western blot data—revealed an interesting difference in the structure of the dLGN and pulvinar. We found a much lower density of neurons in the pulvinar nucleus compared with dLGN, although the overall cell density in each nucleus was similar. This is because the pulvinar nucleus contains a much higher density of glial cells relative to the dLGN. In the dLGN, neurons and glial cells are present in approximately equal numbers, whereas in the pulvinar, the glial cells outnumber neurons by a ratio of 2.5:1.
The glia-to-neuron ratio varies considerably in the brain. A recent stereological study of human brain tissue found a 1:1 ratio for the thalamus as a whole, and a 7:1 for the cortex as a whole (Azevedo et al., 2009). Although we did not identify the subtypes of glial cells in the pulvinar, the majority are likely to be astrocytes, the processes of which surround most synapses (Halassa et al., 2007b). Recent evidence suggests that astrocytes can modulate synaptic transmission and plasticity, and that gap junctions between astrocytes may enhance the rhythmic firing of adjacent neurons (Crunelli et al., 2002). Astrocytes may also contribute to disease states that involve rhythmic firing, such as epilepsy and schizophrenia (Halassa et al., 2007a).
Functional implications
In contrast to the dLGN, which projects to single discrete sites within V1 (Conley et al., 1984), the regions of the pulvinar recorded in this study project to multiple targets within the temporal cortex (Chomsung et al., 2010) as well as the striatum and amygdala (Day-Brown et al., 2010). The prevalence of burst firing in the pulvinar could synchronize the activity of these multiple widespread targets and/or function as a form of gain control (Saalmann and Kastner, 2009). The pulvinar neurons recorded in this study receive convergent input from superior colliculus axons that encircle their proximal dendrites, and convergent input from temporal cortex axons that innervate their distal dendrites (Chomsung et al., 2008, 2010). Our computational model suggests that T-channel densities in distal dendrites may be particularly important in modifying burst firing propensity. A recent in vitro recording and imaging study of the thalamic reticular nucleus indicates that distally located T-channels may function to amplify afferent inputs to distal dendrites (Crandall et al., 2010). If, as our model suggests, pulvinar neurons contain a high density of T-channels in their distal dendrites, then these calcium currents may amplify descending inputs from the temporal cortex to the distal dendrites of pulvinar neurons, ensuring their integration with more proximal tectal inputs. The activation of pulvinar neurons via synchronous cortical and tectal inputs could potentially signal the match of ongoing to predicted sensory events. Such a mechanism might underlie the recent observation that pulvinar activity reflected the perceptual awareness of a visual stimulus (Wilke et al., 2009).
Finally, the unique membrane properties of pulvinar neurons may be relevant to the treatment of conditions that involve atypical brain rhythms. For example, schizophrenia is characterized by abnormal electroencephalograms in both waking and sleeping states, which are thought to be related to the perceptual aberrations experienced by these patients (Uhlhaas and Singer, 2010). The pulvinar and mediodorsal nuclei are reduced in size in schizophrenic brains compared with controls (Byne et al., 2009) and pulvinar inactivation has been shown to affect cortical oscillations (Molotchnikoff and Shumikhina, 1996). The high burst propensity of pulvinar neurons in adult tissue relative to juvenile tissue may also be relevant to the treatment of conditions, such as schizophrenia, in which symptoms typically manifest in the adult (Uhlhaas and Singer, 2010). Further study of the nucleus-specific and age-specific properties of the dorsal thalamus may contribute to our understanding and treatment of anomalous thalamocortical interactions.
Footnotes
This work was supported by the Howard Hughes Medical Institute, Salk Institute for Biological Studies (T.J.S. and M.B.), Division of Biological Sciences, University of California, San Diego (T.J.S. and M.B.), and National Institutes of Health Grants R01 EB009282 (T.J.S.), R01 EY01655 (M.E.B. and H.M.P.), and R01 NS35377 (M.E.B.). We thank Drs. Nigel Cooper, Meixia Zhang, Chris Whitaker, Mengsheng Qiu, and Hong Li for their help with the Western blots; Arkadiusz Slusarczyk and Cathie Caple for their help with tissue processing and electron microscopy; and Donna Dillihay for helpful discussions.
References
- Avanzini G, de Curtis M, Panzica F, Spreafico R. Intrinsic properties of nucleus reticularis thalami neurones of the rat studied in vitro. J Physiol. 1989;416:111–122. doi: 10.1113/jphysiol.1989.sp017752. [DOI] [PMC free article] [PubMed] [Google Scholar]
- Azevedo FA, Carvalho LR, Grinberg LT, Farfel JM, Ferretti RE, Leite RE, Jacob Filho W, Lent R, Herculano-Houzel S. Equal numbers of neuronal and nonneuronal cells make the human brain an isometrically scaled-up primate brain. J Comp Neurol. 2009;513:532–541. doi: 10.1002/cne.21974. [DOI] [PubMed] [Google Scholar]
- Bal T, McCormick DA. Mechanisms of oscillatory activity in guinea-pig nucleus reticularis thalami in vitro: a mammalian pacemaker. J Physiol. 1993;468:669–691. doi: 10.1113/jphysiol.1993.sp019794. [DOI] [PMC free article] [PubMed] [Google Scholar]
- Bezdudnaya T, Cano M, Bereshpolova Y, Stoelzel CR, Alonso JM, Swadlow HA. Thalamic burst mode and inattention in the awake LGNd. Neuron. 2006;49:421–432. doi: 10.1016/j.neuron.2006.01.010. [DOI] [PubMed] [Google Scholar]
- Bickford ME, Guido W, Godwin DW. Neurofilament proteins in Y-cells of the cat lateral geniculate nucleus: normal expression and alteration with visual deprivation. J Neurosci. 1998;18:6549–6557. doi: 10.1523/JNEUROSCI.18-16-06549.1998. [DOI] [PMC free article] [PubMed] [Google Scholar]
- Bickford ME, Wei H, Eisenback MA, Chomsung RD, Slusarczyk AS, Dankowsi AB. Synaptic organization of thalamocortical axon collaterals in the perigeniculate nucleus and dorsal lateral geniculate nucleus. J Comp Neurol. 2008;508:264–285. doi: 10.1002/cne.21671. [DOI] [PMC free article] [PubMed] [Google Scholar]
- Boudreau CE, Ferster D. Short-term depression in thalamocortical synapses of cat primary visual cortex. J Neurosci. 2005;25:7179–7190. doi: 10.1523/JNEUROSCI.1445-05.2005. [DOI] [PMC free article] [PubMed] [Google Scholar]
- Byne W, Hazlett EA, Buchsbaum MS, Kemether E. The thalamus and schizophrenia: current status of research. Acta Neuropathol. 2009;117:347–368. doi: 10.1007/s00401-008-0404-0. [DOI] [PubMed] [Google Scholar]
- Campbell CBG. The nervous system of tupaiidae: its bearing on phyletic relationships. In: Luckett WP, editor. Comparative biology and evolutionary relationships of tree shrews. New York: Plenum; 1980. pp. 219–242. [Google Scholar]
- Chomsung RD, Petry HM, Bickford ME. Ultrastructural examination of diffuse and specific tectopulvinar projections in the tree shrew. J Comp Neurol. 2008;510:24–46. doi: 10.1002/cne.21763. [DOI] [PMC free article] [PubMed] [Google Scholar]
- Chomsung RD, Wei H, Day-Brown JD, Petry HM, Bickford ME. Synaptic organization of connections between the temporal cortex and pulvinar nucleus of the tree shrew. Cereb Cortex. 2010;20:997–1011. doi: 10.1093/cercor/bhp162. [DOI] [PMC free article] [PubMed] [Google Scholar]
- Conley M, Fitzpatrick D, Diamond IT. The laminar organization of the lateral geniculate body and the striate cortex in the tree shrew (Tupaia glis) J Neurosci. 1984;4:171–197. doi: 10.1523/JNEUROSCI.04-01-00171.1984. [DOI] [PMC free article] [PubMed] [Google Scholar]
- Crandall SR, Govindaiah G, Cox CL. Low-threshold Ca2+ current amplifies distal dendritic signaling in thalamic reticular neurons. J Neurosci. 2010;30:15419–15429. doi: 10.1523/JNEUROSCI.3636-10.2010. [DOI] [PMC free article] [PubMed] [Google Scholar]
- Crunelli V, Blethyn KL, Cope DW, Hughes SW, Parri HR, Turner JP, Tòth TI, Williams SR. Novel neuronal and astrocytic mechanisms in thalamocortical loop dynamics. Philos Trans R Soc Lond B Biol Sci. 2002;357:1675–1693. doi: 10.1098/rstb.2002.1155. [DOI] [PMC free article] [PubMed] [Google Scholar]
- Cueni L, Canepari M, Lujan R, Emmenegger Y, Watanabe M, Bond CT, Franken P, Adelman JP, Luthi A. T-type Ca2+ channels, SK2 channels and SERCAs gate sleep-related oscillations in thalamic dendrites. Nat Neurosci. 2008;11:683–692. doi: 10.1038/nn.2124. [DOI] [PubMed] [Google Scholar]
- Day-Brown JD, Wei H, Chomsung RD, Petry HM, Bickford ME. Pulvinar projections to the striatum and amygdala. Front Neuroanat. 2010;4:143. doi: 10.3389/fnana.2010.00143. [DOI] [PMC free article] [PubMed] [Google Scholar]
- Destexhe A, Neubig M, Ulrich D, Huguenard J. Dendritic low-threshold calcium currents in thalamic relay cells. J Neurosci. 1998;18:3574–3588. doi: 10.1523/JNEUROSCI.18-10-03574.1998. [DOI] [PMC free article] [PubMed] [Google Scholar]
- Glenn LL, Steriade M. Discharge rate and excitability of cortically projecting intralaminar thalamic neurons during waking and sleep states. J Neurosci. 1982;2:1387–1404. doi: 10.1523/JNEUROSCI.02-10-01387.1982. [DOI] [PMC free article] [PubMed] [Google Scholar]
- Graef JD, Nordskog BK, Wiggins WF, Godwin DW. An acquired channelopathy involving thalamic T-type Ca2+ channels after status epilepticus. J Neurosci. 2009;29:4430–4441. doi: 10.1523/JNEUROSCI.0198-09.2009. [DOI] [PMC free article] [PubMed] [Google Scholar]
- Guido W, Weyand T. Burst responses in thalamic relay cells of the awake behaving cat. J Neurophysiol. 1995;74:1782–1786. doi: 10.1152/jn.1995.74.4.1782. [DOI] [PubMed] [Google Scholar]
- Guido W, Lu SM, Vaughan JW, Godwin DW, Sherman SM. Receiver operating characteristic (ROC) analysis of neurons in the cat's lateral geniculate nucleus during tonic and burst response mode. Vis Neurosci. 1995;12:723–741. doi: 10.1017/s0952523800008993. [DOI] [PubMed] [Google Scholar]
- Gutierrez C, Cox CL, Rinzel J, Sherman SM. Dynamics of low-threshold spike activation in relay neurons of the cat lateral geniculate nucleus. J Neurosci. 2001;21:1022–1032. doi: 10.1523/JNEUROSCI.21-03-01022.2001. [DOI] [PMC free article] [PubMed] [Google Scholar]
- Halassa MM, Fellin T, Haydon PG. The tripartite synapse: roles for gliotransmission in health and disease. Trends Mol Med. 2007a;13:54–63. doi: 10.1016/j.molmed.2006.12.005. [DOI] [PubMed] [Google Scholar]
- Halassa MM, Fellin T, Takano H, Dong JH, Haydon PG. Synaptic islands defined by the territory of a single astrocyte. J Neurosci. 2007b;27:6473–6477. doi: 10.1523/JNEUROSCI.1419-07.2007. [DOI] [PMC free article] [PubMed] [Google Scholar]
- He J, Hu B. Differential distribution of burst and single-spike responses in auditory thalamus. J Neurophysiol. 2002;88:2152–2156. doi: 10.1152/jn.2002.88.4.2152. [DOI] [PubMed] [Google Scholar]
- Hodgkin AL, Huxley AF. A quantitative description of membrane current and its application to conduction and excitation in nerve. J Physiol. 1952;117:500–544. doi: 10.1113/jphysiol.1952.sp004764. [DOI] [PMC free article] [PubMed] [Google Scholar]
- Hughes SW, Cope DW, Crunelli V. Dynamic clamp study of Ih modulation of burst firing and delta oscillations in thalamocortical neurons in vitro. Neuroscience. 1998;87:541–550. doi: 10.1016/s0306-4522(98)00170-5. [DOI] [PubMed] [Google Scholar]
- Hughes SW, Cope DW, Tóth TI, Williams SR, Crunelli V. All thalamocortical neurones possess a T-type Ca2+ ‘window’ current that enables the expression of bistability-mediated activities. J Physiol. 1999;517:805–815. doi: 10.1111/j.1469-7793.1999.0805s.x. [DOI] [PMC free article] [PubMed] [Google Scholar]
- Huguenard JR, McCormick DA. Simulation of the currents involved in rhythmic oscillations in thalamic relay neurons. J Neurophysiol. 1992;68:1373–1383. doi: 10.1152/jn.1992.68.4.1373. [DOI] [PubMed] [Google Scholar]
- Huguenard JR, Prince DA. A novel T-type current underlies prolonged Ca(2+)-dependent burst firing in GABAergic neurons of rat thalamic reticular nucleus. J Neurosci. 1992;12:3804–3817. doi: 10.1523/JNEUROSCI.12-10-03804.1992. [DOI] [PMC free article] [PubMed] [Google Scholar]
- Hull C, Isaacson JS, Scanziani M. Postsynaptic mechanisms govern the differential excitation of cortical neurons by thalamic inputs. J Neurosci. 2009;29:9127–9136. doi: 10.1523/JNEUROSCI.5971-08.2009. [DOI] [PMC free article] [PubMed] [Google Scholar]
- Li J, Bickford ME, Guido W. Distinct firing properties of higher order thalamic relay neurons. J Neurophysiol. 2003;90:291–299. doi: 10.1152/jn.01163.2002. [DOI] [PubMed] [Google Scholar]
- Llinás RR, Steriade M. Bursting of thalamic neurons and states of vigilance. J Neurophysiol. 2006;95:3297–3308. doi: 10.1152/jn.00166.2006. [DOI] [PubMed] [Google Scholar]
- McCormick DA, Huguenard JR. A model of the electrophysiological properties of thalamocortical relay neurons. J Neurophysiol. 1992;68:1384–1400. doi: 10.1152/jn.1992.68.4.1384. [DOI] [PubMed] [Google Scholar]
- Molotchnikoff S, Shumikhina S. The lateral posterior-pulvinar complex modulation of stimulus-dependent oscillations in the cat visual cortex. Vision Res. 1996;36:2037–2046. doi: 10.1016/0042-6989(95)00311-8. [DOI] [PubMed] [Google Scholar]
- Monckton JE, McCormick DA. Neuromodulatory role of serotonin in the ferret thalamus. J Neurophysiol. 2002;87:2124–2136. doi: 10.1152/jn.00650.2001. [DOI] [PubMed] [Google Scholar]
- Ramcharan EJ, Gnadt JW, Sherman SM. Higher-order thalamic relays burst more than first-order relays. Proc Natl Acad Sci U S A. 2005;102:12236–12241. doi: 10.1073/pnas.0502843102. [DOI] [PMC free article] [PubMed] [Google Scholar]
- Ramoa AS, McCormick DA. Developmental changes in electrophysiological properties of LGNd neurons during reorganization of retinogeniculate connections. J Neurosci. 1994;14:2089–2097. doi: 10.1523/JNEUROSCI.14-04-02089.1994. [DOI] [PMC free article] [PubMed] [Google Scholar]
- Saalmann YB, Kastner S. Gain control in the visual thalamus during perception and cognition. Curr Opin Neurobiol. 2009;19:408–414. doi: 10.1016/j.conb.2009.05.007. [DOI] [PMC free article] [PubMed] [Google Scholar]
- Steriade M, Curró Dossi R, Contreras D. Electrophysiological properties of intralaminar thalamocortical cells discharging rhythmic (approximately 40 HZ) spike-bursts at approximately 1000 HZ during waking and rapid eye movement sleep. Neuroscience. 1993;56:1–9. doi: 10.1016/0306-4522(93)90556-u. [DOI] [PubMed] [Google Scholar]
- Swadlow HA, Gusev AG. The impact of ‘bursting’ thalamic impulses at a neocortical synapse. Nat Neurosci. 2001;4:402–408. doi: 10.1038/86054. [DOI] [PubMed] [Google Scholar]
- Traub RD, Wong RK, Miles R, Michelson H. A model of a CA3 hippocampal pyramidal neuron incorporating voltage-clamp data on intrinsic conductances. J Neurophysiol. 1991;66:635–650. doi: 10.1152/jn.1991.66.2.635. [DOI] [PubMed] [Google Scholar]
- Uhlhaas PJ, Singer W. Abnormal neural oscillations and synchrony in schizophrenia. Nat Rev Neurosci. 2010;11:100–113. doi: 10.1038/nrn2774. [DOI] [PubMed] [Google Scholar]
- Varela C, Sherman SM. Differences in response to muscarinic activation between first and higher order thalamic relays. J Neurophysiol. 2007;98:3538–3547. doi: 10.1152/jn.00578.2007. [DOI] [PubMed] [Google Scholar]
- Varela C, Sherman SM. Differences in response to serotonergic activation between first and higher order thalamic nuclei. Cereb Cortex. 2009;19:1776–1786. doi: 10.1093/cercor/bhn208. [DOI] [PMC free article] [PubMed] [Google Scholar]
- Wang X, Wei Y, Vaingankar V, Wang Q, Koepsell K, Sommer FT, Hirsch JA. Feedforward excitation and inhibition evoke dual modes of firing in the cat's visual thalamus during naturalistic viewing. Neuron. 2007;55:465–478. doi: 10.1016/j.neuron.2007.06.039. [DOI] [PMC free article] [PubMed] [Google Scholar]
- Wilke M, Mueller KM, Leopold DA. Neural activity in the visual thalamus reflects perceptual suppression. Proc Natl Acad Sci U S A. 2009;106:9465–9470. doi: 10.1073/pnas.0900714106. [DOI] [PMC free article] [PubMed] [Google Scholar]
- Zaman T, Lee K, Park C, Paydar A, Choi JH, Cheong E, Lee CJ, Shin HS. Ca(V)2.3 channels are critical for oscillatory burst discharges in the reticular thalamus and absence epilepsy. Neuron. 2011;70:95–108. doi: 10.1016/j.neuron.2011.02.042. [DOI] [PubMed] [Google Scholar]
- Zhan XJ, Cox CL, Rinzel J, Sherman SM. Current clamp and modeling studies of low-threshold calcium spikes in cells of the cat's lateral geniculate nucleus. J Neurophysiol. 1999;81:2360–2373. doi: 10.1152/jn.1999.81.5.2360. [DOI] [PubMed] [Google Scholar]