

Abstract
We have designed an immobilization bed that accommodates mice of all ages and sizes, to improve image registration for multimodal scans and for longitudinal preclinical imaging studies. Stationary pegs were placed such that they effectively immobilized mice and reduced set-up time. 22Na fiducial markers were placed into the pegs at unique depths to provide 3D references to facilitate image registration. Multiple users registered positron emission tomographic (PET) and CT data obtained with and without the bed to examine the effect of the bed on registration accuracy and interuser variability. The image registrations performed by different users were evaluated for their similarity by using the Entropy Correlation Coefficient as a metric. The immobilization bed significantly reduced variations in body movement and interuser variability. Average differences in quantification of tumor PET signal among users when registering images without versus with the fiduciary-marker bed fell from 9.1% to 0.8% for maximal percentage injected dose per gram (%ID/g), from 15.6% to 2.3% for mean %ID/g, and from 9.4% to 0.7% for the 90th percentile of the maximum %ID/g. The bed improves animal immobilization, greatly reduces interuser variability, and supports registration of image data acquired from different imaging sessions.
Abbreviations: ECC, entropy correlation coefficient; NMI, normalized mutual information; PET, positron emission tomography; ROI, region of interest; SUV, standardized uptake value
Preclinical molecular imaging techniques such as positron emission tomography (PET) are crucial platforms for evaluating new therapeutic methods and exploring novel biologic functions in vivo.1 PET is a functional imaging modality that can provide direct information about the spatial distribution of specific biologic processes. However, the resulting images are often difficult to interpret because they lack sufficient anatomic context. Therefore, registration and fusion of relatively coarse-resolution PET image sets with fine-resolution CT or MRI image sets is invaluable for anatomic orientation and for accurately delineating regions of interest (ROI).
Combined PET–CT systems are now common in the clinical setting. Although preclinical multimodal systems gradually are becoming more common, their high cost means that many preclinical imaging centers still use separate microPET and microCT scanners.1 However, using separate systems introduces differences in body position in each scan, thereby complicating the registration process. Moving an animal among multiple imagers introduces the opportunity for various errors, increases the overall duration of the study, and prolongs the time that an animal is anesthetized. Because resulting changes in anatomy are often nonlinear, standard techniques for registering image data, such as software-based rigid registration and manual translations and rotations, will not be sufficient to produce well-registered images. This problem is amplified when one considers the myriad of other imaging modalities used in preclinical research, including MRI, optical imaging, ultrasonography, and so on.
Several approaches can be used to improve the registration of data acquired from 2 or more different systems. One is to use advanced nonrigid registration algorithms that can estimate realistic biomechanical tissue deformations.2 Such algorithms are mathematically complicated and computationally expensive to run. In addition, such methods generally rely on the similarity of information in the images, whereas PET images (which show locations of metabolic activity) very often lack sufficient similarity with their corresponding CT images (which show anatomy as weighted according to electron density) for nonrigid registration to yield acceptable accuracy.10 Another method to improve data registration is to constrain an animal's position to minimize body movements between scans. An ideal constraining mechanism would feature the following properties: (1) it would facilitate multimodal image registration by minimizing opportunities for animal movement; (2) it would require minimal set-up to improve throughput and reduce the overall time that the animal was constrained; (3) it would be reproducible, so that the animal could be consistently imaged at multiple time points, and the resulting image data would be in close alignment with previously acquired images. This last property would greatly facilitate longitudinal studies, such as those comparing tumor PET tracer uptake before and after therapy.
Several types of constraints are described in the literature. Some labs used a unique mold for each animal imaged.14,15 However, if the study involves a large number of mice, this approach is less attractive. In addition, the location of any subcutaneous tumors could affect the fit of the mold as tumors and mice grow. One available device involves extending the limbs of a mouse rostrocaudally and immobilizing them.2 Although this method is superior to simply laying a mouse on a bed, it is time-consuming and still allows for considerable rotation of the animal's body. Other authors designed a system to immobilize rats by fixing each animal's teeth at the front of the instrument, restraining each ear in a clamp-like device, and wedging the body between multiple ‘torso fixation’ devices.13 This design successfully stabilizes the head and neck but permits considerable trunk movement and is time-consuming to set up. Still other researchers have designed immobilization beds for specific body parts (primarily the head only).12 A system for combining PET, MRI, and histology uses 3 fiducial rods, which transfix the tumor and are held in place by a large device on a mouse's leg.7
Here we describe the design of a mouse bed that is optimized for PET–CT imaging. The design was inspired by a set-up used in a study that immobilized rats for prostate radiotherapy5 and used pegs to immobilize the limbs in a simple manner. Our bed builds on that premise and features a mouse-optimized and flexible peg design, along with PET–CT-visible fiducial markers for facilitating registration by using point-matching–based algorithms. Use of this apparatus confers a significant operational benefit to multisystem imaging by reducing mouse movement and interuser variability, both within and between studies.
Materials and Methods
Before experiments began, protocols were approved by the Administrative Panel on Laboratory Animal Care (APLAC), the IACUC at Stanford University. Protocols were followed during all animal use.
Bed design and construction.
Multiple mice of various ages and species were measured to optimize the bed and size and locations of restraining pegs. The pegs were placed in stationary positions that effectively immobilized the majority of mice and facilitated high-throughput imaging by avoiding adjustments for every mouse. Pegs were placed on either side of each of the animals’ limbs, closely adjacent to their bodies. An additional set of pegs was placed caudolaterally to the most posterior restraining pegs to guide the hindlimbs in a reproducible direction. 22Na PET–CT point sources with active region dimensions of 1 mm in diameter and 0.5 mm height and with outer dimensions of 3 mm × 3 mm × 8 mm were used as fiducial markers and were placed inside the pegs of the imaging bed. The depths of the markers within the pegs are unique to each peg, thus producing a unique 3D arrangement that can be easily identified in image data. Figure 1 (top panel) is a schematic diagram (produced by using Google Sketchup, http://sketchup.google.com) of the bed design.
Figure 1.

Bed design. Top: The schematic design of the multimodality immobilization bed. Bottom: Photo of the bed. Mice younger and smaller than the 2-mo-old mouse shown rarely are used in imaging studies. This bed also has been used with fully grown, 2-y-old mice. About 75% of mice fit in this configuration. For the other 25% (that is, very large mice), placing the front legs in front of the most anterior pegs retains the full functionality of the bed. Given the nature of most research studies and mouse strains, subjects rarely grow to full size, and the typical configuration (shown) is used nearly always. Black arrows indicate the locations of the fiducial markers, which are small and embedded in the pegs.
Tumor xenografts and imaging.
Foxn1nu mice (age, 2 mo) were used for the experiment; each mouse was injected subcutaneously with 1 × 10⁶ HT29 colon carcinoma tumor cells in each flank. Imaging began once the tumors reached an average size of about 0.15 mL (approximately 2 wk after injection).
Mice received approximately 200 µCi 18F-fluorodeoxyglucose by intraperitoneal injection and were imaged 1 h thereafter. Mice were anesthetized with 2% isofluorane prior to PET imaging (Siemens–Concorde microPET R4, Concorde Microsystems, Knoxville, TN) for 10 min. Acquired list-mode image data were reconstructed by using an ordered-subsets expectation-maximization (OSEM) algorithm.6 Immediately after microPET imaging, CT images were acquired (SPECT-CT imager, Gamma Medica-Ideas, Northridge, CA) by using a 70-kV, 215-µA beam with a 50-µm spot size; 256 projections were acquired; and images were reconstructed to a final resolution of 0.17 mm.
Intrascan mouse movement.
Using serial CT imaging, we performed 2 tests to assess the amount of intrascan variation in body position. The first test estimated the upper limits of mouse body movement within a single imaging session. To this end, we scanned the upper body of an anesthetized nude mouse that was placed in the immobilization bed. To test the bed's immobilization ability, anesthesia was discontinued and the mouse was allowed to regain consciousness while in the bed; once conscious, the mouse was scanned a second time to define its maximal movement. During the second test, the magnitude of mouse body displacement across multiple imaging sessions was estimated. A single mouse with subcutaneous tumors was imaged on multiple days, and the overall difference in body position was estimated.
Interuser registration variability.
To investigate the influence of the imaging bed on interuser variability in registering PET scans to CT scans, 10 mice were imaged on 5 different days (days 1, 3, 5, 11, and 16); 5 mice were scanned while in the immobilization bed and the other 5 while in the standard bed used in the imaging center. The standard bed was constructed by using a large syringe cut in half along the long axis; a mouse was placed inside this device when moved from one system to another for imaging. This approach is commonly used approach for multimodal preclinical scans at the Stanford Small Animal Imaging Facility.3
Images were fused by using a 2-step process. The initial registration was accomplished by using a semiautomatic rigid registration algorithm based on point matching (RTImage, an IDL-based free preclinical imaging software suite; http://rtimage.sourceforge.net).4 The registration algorithm used mutual information (described below) of the PET and CT scans to compute the similarity between the images. After this automated registration, users manually transformed the images further to refine the alignment. This manual adjustment was performed by using identifiable landmarks such as the urinary bladder, eyes, and kidneys; these structures all were easily identified on both CT and fluorodeoxyglucose-PET scans. The PET images were transformed relative to the CT images, thus allowing the variation in PET image transformations by different users to be computed.
To compare user variability, we needed a measure of similarity between the 2 registered PET images. Mutual information provides such a metric. The mutual information (MI) of 2 images, A and B, is given by the following equation:
where H(A) and H(B) are the entropies of images A and B, respectively. Entropy is an information-theory metric that describes the amount of information encoded in a signal or image.9 Mutual information has a lower limit of 0 but no inherent upper limit, which varies depending on image content and size. To provide an upper limit, normalized mutual information (NMI) can be used:
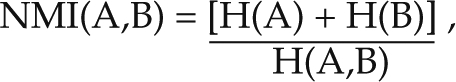 |
where H(A,B) denotes the joint entropy of A and B. This measure has a lower limit of 1 and an upper limit of 2. Because such limits are more awkward to process than are the intuitive limits of 0 and 1, NMI often is converted into an entropy correlation coefficient (ECC):
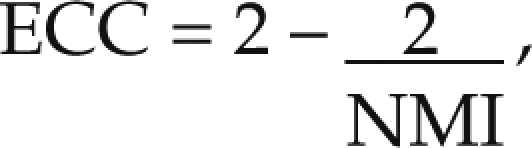 |
An ECC of 1 indicates that the images were identical and perfectly registered, whereas an ECC of 0 shows that the images were completely independent and did not match at all.9 We calculated the ECC between identical PET scans registered by different users.
Regions of interest (ROI) delineating the bilateral tumors were drawn on the CT scans. Because all users registered the PET scans to the corresponding CT scans, the ROI were used to quantify each user's PET data. Therefore any differences in PET quantification would be due to these slight misregistrations only. These differences were evaluated by using multiple methods for assessing PET signal from a tumor. Although the standardized uptake value (SUV) is the standard unit for PET scans in the clinical setting, preclinical PET scans usually are quantified in percentage injected dose per gram of tumor (%ID/g).8 There are three standard methods used frequently to measure SUV and %ID/g. One is to measure just the maximum voxel in the ROI (%ID/g-max or SUVmax), another is to compute the mean of all voxels in the ROI (%ID/g-mean or SUVmean), and a third method is to use a threshold such that only the brightest 10% of voxels are averaged (%ID/g-0.9max or SUV0.9max). These methods are the standard ways of measuring the units of both %ID/g and SUV.11 We used all 3 quantitation methods to reveal possible correlations between user variability and either tumor size or signal intensity.
Results
Bed design and construction.
Figure 1 (bottom) shows a photograph of an anesthetized nude mouse immobilized in our bed. Experienced users could to place mice in the bed within 20 s.
Intrascan mouse movement.
Figure 2 shows 2 coregistered CT scans of an immobilized nude mouse that was imaged first while anesthetized and then imaged again after anesthesia was discontinued and the mouse had awoken. The images show dorsal displacement of approximately 3 mm and negligible lateral and rostrocaudal displacement. This experiment simulated a ‘worst-case scenario’ regarding displacement between multiple scans within the same imaging session.
Figure 2.

‘Worst-case’ intraexamination movement. Two views of fused CT scans of the same mouse, one with and one without anesthesia. The first scan was taken while the mouse was under anesthesia and is shown in a green–black scale. The second scan was taken while the mouse was conscious in the bed and is shown in a red–black scale. The left panel (coronal view) shows that the mouse was able to move vertically 3 mm mid-scan. The right panel (transverse view) shows that the 3-mm vertical movement did not translate into noteworthy movement in any other direction.
Figure 3 shows 2 coregistered CT scans of a nude mouse with subcutaneous tumors that was immobilized in the bed; the second scan was obtained 11 d after the first. The coregistered image shows maximal dorsal body displacement of 0.7 mm. The coregistered data enable direct comparison of the subcutaneous tumors, which grew substantially over this period.
Figure 3.

Longitudinal reproducibility. Two coregistered CT scans (time between the 2 scans, 11 d) of a subcutaneous-tumor–bearing nude mouse. The mouse shows maximal dorsal body displacement of 0.7 mm. The slight displacement between these 2 scans can be seen as either red (the earlier scan) or green (the later scan). Tumor growth over 11 d is visible and easily tracked. The left panel shows the coronal view, the top-right panel shows the transverse view, and the bottom-right panel shows the sagittal view.
Interuser registration variability.
When we compared the similarity of registered PET scans performed by several users, the scans performed with the immobilization bed had an average ECC of 0.563 ± 0.072 whereas those obtained without using our bed had an average ECC of 0.337 ± 0.060; this difference between ECC values is statistically significant (P < 0.00005; Figure 4). Images acquired with the immobilization bed and then registered were therefore more similar (that is, more closely registered) than were those acquired and registered with the standard bed. The worst (that is, lowest) ECC was 0.25 and corresponded to a misregistration of slightly less than 3 mm.
Figure 4.

Image registration. Multiple users registered a set of PET scans to their corresponding CT scans. The registered PET scans then were compared with each other by using the ECC metric to assess user variability. The immobilization bed facilitated significantly (P < 0.00005) improved registration through reduction in user variability. Error bars, 95% confidence interval.
Figures 5 and 6 show the relationship between tumor size (as determined from ROI drawn on the CT scans) and the variation in intratumoral PET signal in images registered by different users; each point in the figures represents a specific PET–CT image pair. Using the standard bed led to a wide range in interuser PET measurements, particularly for tumors with volumes less than 0.4 mL (Figure 5). The immobilization bed significantly decreased variation in PET measurements for tumors of all sizes (Figure 6). For scans performed without the immobilization bed, differences (mean ± SE) in quantification between users were 9.1% ± 4.8%, 15.6% ± 4.5%, and 9.4% ± 4.7% for %ID/g-max, %ID/g-mean, and %ID/g-0.9max, respectively. The corresponding differences for scans performed with the immobilization bed were 0.8% ± 0.85%, 2.3% ± 0.7%, and 0.7% ± 0.3%, respectively (P < 0.03, P < 0.00004, and P < 0.02, respectively). These differences are compared directly in Figure 7.
Figure 5.

User variability and registration accuracy on PET quantification with a standard bed. This shows the relationship between tumor size and the variation in intratumoral PET signal found in registrations performed by different users. Each point represents a specific PET–CT image pair. A broad spread of variations can be seen, particularly for tumors with a volume less than 0.4 mL.
Figure 6.

User variability and registration accuracy on PET quantification with the immobilization bed. This shows the relationship between tumor size and the variation in intratumoral PET signal found in registrations performed by different users. Each point represents a specific PET–CT image pair.
Figure 7.

Comparison of user variability for the 3 most frequently used units in preclinical PET imaging. The data points from Figures 5 and 6 are averaged here to show the enhanced registration accuracy and decreased user variability achieved with the immobilization bed. The error bars show the 95% confidence interval.
Discussion
Fusing multimodal preclinical images is a challenging task in cases when the imaging modalities are available only as separate devices. Using fiducial markers and constraining the animal prior to imaging can assist the fusion process greatly. If these measures can be incorporated in a reproducible manner that ensures identical anatomic positioning, then registration and fusion of images acquired at different times would be facilitated as well. Most protocols attempt to limit animal movement by restraining the animal in a makeshift bed to which some sort of low-activity radioactive marker has been attached. These techniques, however, do not eliminate intrascan movement, and they are difficult to achieve reproducibly on different dates.
We developed an immobilization bed that holds mice in a consistent position and facilitates the registration of multiple images acquired on separate PET and CT imagers. The bed contains integrated PET–CT-visible fiducial markers, and the peg-based design ensures that the mouse is held in a similar position on different imaging sessions. As a result, our immobilization bed also facilitates the registration of images acquired in different sessions, thus enabling longitudinal imaging studies to be performed more efficiently.
Here we describe the design the bed and its use in several validation studies. We performed 2 types of studies to quantify intrascan variation in mouse body position while using the bed. The worst-case-scenario test involved waking an anesthetized mouse and measuring the difference in body position. The results showed a maximal displacement of 3 mm in only one direction. The longitudinal test resulted in maximal body displacement (not including tumors) of 0.7 mm between scans. Given that all imaging exams are performed under anesthesia, these test results indicate the immobilization bed very effectively minimizes intra- and interscan movement.
We also compared interuser variability between the immobilization bed and a standard hemicylindrical bed. Using a measure of similarity based on mutual information,9 we found that use of the immobilization bed yielded more closely registered images and decreased the variation in registration results generated by different users. The use of different methods of physically positioning the mouse into the bed by individual users created slightly different body positions for scans performed across users. However, these differences did not appreciably affect variations in tumor ROI PET measurements after registration.
Whereas PET ROI measurements obtained while using our imaging bed had no dependence on tumor size, these data showed significant dependence on tumor volume when obtained while using a standard bed. Although our data are too noisy to state conclusively, interuser variability increases as tumor size deceases. In particular, the PET signal measured from tumors as large as 0.38 mL still showed significant variability among users. However, it should be stated that our choice of tumor line may have contributed to the high level of variability observed with the standard bed. In several scans, the HT29 tumors we used in this study showed very little fluorodeoxyglucose uptake, and in some cases, the background signal in the gut was higher than the tumor signal. As a result, our test metrics are very sensitive to variations in image alignment, further highlighting the significance of interuser variability. Our bed is therefore suitable for registering PET images where there is low tumor-specific contrast, as is frequently the case with novel experimental imaging tracers that are in the process of being optimized.
We plan to improve our bed further in future work. First, we are working on methods to make the bed MRI-compatible, including the development of MR-visible fiducial markers. In addition, we are integrating sensors for monitoring vital signs, namely heart rate and breathing, thereby allowing gating and monitoring while a mouse is immobilized. Finally, we plan to use our bed in studies of tumor treatment response, in which longitudinal PET data from pre- and posttreatment imaging scans can be overlaid and compared directly.
In conclusion, intra- and interscan movement adds opportunity for error in longitudinal PET studies. Although differences in registration can be small and seemingly negligible, they can lead to large differences in PET signal measurements. Our immobilization bed mitigates these issues and results in a greatly decreased level of interuser variability in PET–CT registration, both in scans acquired during a single imaging session and among those acquired during different imaging sessions. As a result, our immobilization bed has the potential to greatly facilitate multimodal and longitudinal preclinical imaging studies in which image data need to be registered accurately.
References
- 1.Cherry SR. 2006. Multimodality in vivo imaging systems: twice the power or double the trouble? Annu Rev Biomed Eng 8:35–62 [DOI] [PubMed] [Google Scholar]
- 2.Chow PL, Stout DB, Komisopoulou E, Chatziioannou AF. 2006. A method of image registration for small-animal, multimodality imaging. Phys Med Biol 51:379–390 [DOI] [PMC free article] [PubMed] [Google Scholar]
- 3.Doyle T. [Internet] 2009. Construction and use of a simple multi-modality, multi-animal mouse holder. Abstracts presented at the World Molecular Imaging Conference, Montreal, Canada, 23–26 September 2009. [Cited October 2011]. Available at: www.wmicmeeting.org/abstracts/start.html
- 4.Graves EE, Quon A, Loo BW. 2007. RT_image: an open-source tool for investigating PET in radiation oncology. Technol Cancer Res Treatment 6:111–121 [DOI] [PubMed] [Google Scholar]
- 5.Hillman GG, Maughan RL, Grignon DJ, Yudelev M, Rubio J, Tekyi-Mensah S, Layer A, Che M, Forman JD. 2001. Neutron or photon irradiation for prostate tumors: enhancement of cytokine therapy in a metastatic tumor model. Clin Cancer Res 7:136–144 [PubMed] [Google Scholar]
- 6.Hudson HM, Larkin RS. 1994. Accelerated image reconstruction using ordered subsets of projection data. IEEE Trans Med Imag 13:601–609 [DOI] [PubMed] [Google Scholar]
- 7.Humm JL, Ballon D, Hu YC, Ruan S, Chui C, Tulipano PK, Erdi A, Koutcher J, Zakian K, Urano M, Zanzonico P, Mattis C, Dyke J, Chen Y, Harrington P, O'Donoghue JA, Ling CC. 2003. A sterotactic method for the 3-dimensional registration of multimodality biologic images in animals: NMR, PET, histology, and autoradiography. Med Phys 30:2303–2314 [DOI] [PubMed] [Google Scholar]
- 8.Lee JR, Madsen MT, Bushnel D, Menda Y. 2000. A threshold method to improve standardized uptake value reproducibility. Nucl Med Commun 21:685–690 [DOI] [PubMed] [Google Scholar]
- 9.Pluim JP, Maintz JB, Viergever MA. 2003. Mutual-information–based registration of medical images: a survey. IEEE Trans Med Imaging 22:986–1004 [DOI] [PubMed] [Google Scholar]
- 10.Schnabel J, Rueckert D, Quist M, Blackall JM, Castellano-Smith AD, Hartkens T, Penney GP, Hall WA, Liu H, Truwit CL, Gerritsen FA, Hill DLG, Hawkes DJ. 2001. A generic framework for nonrigid registration based on nonuniform multilevel freeform deformations. Lect Notes Comput Sci 2208:579–581 [Google Scholar]
- 11.Vallabhajosula S. 2009. Pharmacokinetics and modeling, p 205–206 : Vallabhajosula S. Molecular imaging: radiopharmaceuticals for PET and SPECT. Berlin (Germany): Springer–Verlag [Google Scholar]
- 12.Vaquero JJ, Desco M, Pascau J, Santos A, Lee I, Seidel J, Green MV; National Institute of Health 2001. PET, CT, and MR image registration of the rat brain and skull. IEEE Trans Nucl Sci 48:1440–1445 [Google Scholar]
- 13.Yang C, Wu TH, Lin MH, Huang YH, Guo WY, Chen CL, Wang TC, Yin WH, Lee JS. 2006. Multimodality imaging combination in small animals via point-based registration. Nucl Instrum Methods Phys Res A 569:240–244 [Google Scholar]
- 14.Zanzonico PB. 2006. Broad-spectrum multimodality image registration: from PET, CT, and MRI to autoradiography, microscopy, and beyond. Conf Proc IEEE Eng Med Biol Soc 1:1584–1588 [DOI] [PubMed] [Google Scholar]
- 15.Zanzonico PB, Campa J, Polycarpe-Holman D, Forster G, Finn R, Larson S, Humm J, Ling C. 2006. Animal-specific positioning molds for registration of repeat imaging studies: comparative microPET imaging of F18-labeled fluorodeoxyglucose and fluoromisonidazole in rodent tumors. Nucl Med Biol 33:65–70 [DOI] [PubMed] [Google Scholar]