Abstract
Early cortical folding and the emergence of structural brain asymmetries have been previously analyzed by neuropathology as well as qualitative analysis of magnetic resonance imaging (MRI) of fetuses and preterm neonates. In this study, we present a dedicated image analysis framework and its application for the detection of folding patterns during the critical period for the formation of many primary sulci (20–28 gestational weeks). Using structural information from in utero MRI, we perform morphometric analysis of cortical plate surface development and modeling of early folding in the normal fetal brain. First, we identify regions of the fetal brain surface that undergo significant folding changes during this developmental period and provide precise temporal staging of these changes for each region of interest. Then, we highlight the emergence of interhemispheric structural asymmetries that may be related to future functional specialization of cortical areas. Our findings complement previous descriptions of early sulcogenesis based on neuropathology and qualitative evaluation of 2D in utero MRI by accurate spatial and temporal mapping of the emergence of individual sulci as well as structural brain asymmetries. The study provides the missing starting point for their developmental trajectories and extends our understanding of normal cortical folding.
Keywords: cortex, development, fetus, folding, lateralization
Introduction
During the initial stages of brain development in the human fetus, a smooth cortical sheet forms by cell migration from the proliferative ventricular and subventricular zones that line the cerebral vesicles. Between the fifth and the sixth month of gestation, the cortex begins to fold forming a distinct pattern of gyri and sulci. The growth of the convoluted cerebral cortex, achieved predominately by an increase in the surface area of a uniform sheet rather than its thickness, has led to the postulation of the radial unit hypothesis of cortical development and its expansion during evolution (Rakic 1988; Rakic et al. 2009). The process of cortical folding has also been simulated via mathematical formulations of the underlying mechanisms including differential growth of cortical layers (Richman et al. 1975), tension forces applied by white matter fibers connecting cortical areas (Van Essen 1997), elasticity and plasticity (Toro and Burnod 2005), an intermediate progenitor model (Striegel and Hurdal 2009), and a reaction-diffusion system (Lefevre and Mangin 2010).
Early cortical folding has been extensively studied in the context of normal developmental neuroanatomy and neuropathology (Retzius 1896; His 1904; Hochstetter 1919; Bartelmez 1923; Barbe 1938; Fontes 1944; Bartelmez and Dekaban 1962; Larroche 1966; Chi et al. 1977a, 1977b; Feess-Higgins and Larroche 1988; O'Rahilly and Muller 1999). According to postmortem observations of fetal brains, the primary and secondary sulci form according to a specific spatiotemporal schedule during normal gestation. The timing of the emergence of these sulci is so precise that they are used as reliable landmarks in estimation of gestational age (Garel et al. 2001, 2003). Postmortem studies have also analyzed structural asymmetries of the fetal brain and reported the earlier folding of the peri-Sylvian region in the right hemisphere (Retzius 1896; Fontes 1944; Chi et al. 1977a, 1977b).
Magnetic resonance imaging (MRI) of preterm neonates has provided in vivo confirmation of the postmortem observations regarding early brain folding (Dubois, Benders, Borradori-Tolsa, et al. 2008; Dubois, Benders, Cachia, et al. 2008). The pattern of cortical convolutions in preterm infants has been determined as a good phenotypic marker of overall brain development (Barkovich et al. 1988), an indicator of functional maturity (Dubois, Benders, Borradori-Tolsa, et al. 2008), and a strong predictor of future neurodevelopmental outcomes (Woodward et al. 2006). However, due to the effects that complications of prematurity may have on the brain, these studies are not fully representative of normal development (Ajayi-Obe et al. 2000; Kapellou et al. 2006).
In parallel, MRI of the human fetus has become an important tool for clinical assessment of brain growth in utero. MRI offers the ability to visualize boundaries between transient layers of developing brain tissues (Kostovic et al. 2002; Rados et al. 2006; Kostovic and Vasung 2009) and, therefore, is essential for the study of normal and abnormal brain development in utero (Glenn and Barkovich 2006; Prayer et al. 2006; Rutherford et al. 2008). Analysis of early cortical folding from fetal MRI has so far been restricted to qualitative evaluation of a limited number of 2D sections (Levine and Barnes 1999; Garel et al. 2001, 2003). Similarly, quantitative analysis of structural asymmetries in the fetal brain has been based on manual measurements from thick 2D MRI slices (Kasprian et al. 2011). Recent advances in motion-corrected 3D MRI reconstruction (Rousseau et al. 2006; Kim et al. 2010) and automatic atlas-based segmentation of developing tissues in the fetal brain (Habas, Kim, Corbett-Detig, et al. 2010; Habas, Kim, Rousseau, et al. 2010) have opened up the possibility of advanced surface-based analysis and quantitative modeling of early cortical folding at fine spatial resolution.
In this study, we focus on the early stage of the second half of pregnancy, from 20 to 28 gestational weeks (GW). This period is critical in early cortical folding and the formation of many primary sulci. Using structural information from in utero MRI and a dedicated image analysis framework, we perform morphometric analysis of cortical plate surface development and modeling of early folding in the normal fetal brain. First, we identify regions of the fetal brain that undergo significant folding changes during this developmental stage and provide precise temporal staging of these changes for each region of interest (ROI). Then, we highlight the emergence of early interhemispheric structural asymmetries that may be related to future functional specialization of cortical areas. The study findings are compared with previously published descriptions of early sulcogenesis based on neuropathology of the fetal brain (Chi et al. 1977a, 1977b) as well as qualitative evaluation of 2D MRI acquired in utero (Garel et al. 2001). Our study adds to these by identifying spatial and temporal patterns of progressive changes in area and curvature of the inner cortical plate surface associated with the formation of individual sulci and the emergence of interhemispheric asymmetries.
Materials and Methods
Study Population
The study was performed using 40 MRI scans of 38 fetuses (19 males, 19 females) between 20 and 28 GW as determined by mothers’ reported last menstrual period. This developmental stage corresponds to approximately 18–26 postovulatory weeks, a measure of prenatal age that has been used in multiple in vitro studies (Kostovic et al. 2002; Rados et al. 2006). The mothers were referred for MRI due to a prior abnormal pregnancy (8 cases), questionable findings on prenatal ultrasound (9 cases) or recruited as volunteers (21 cases). All subjects’ MRI scans were read as normal by an experienced pediatric neuroradiologist with expertise in fetal MRI (O.A.G.). This study was approved by our institutional review board (IRB), and informed consent was obtained from each mother.
Fetal MRI
Fetal MRI was performed according to an IRB-approved clinical protocol using a 1.5T scanner and a commercially available 8-channel phased-array torso coil (GE Healthcare). For each subject, the position of the fetal head was first determined based on a low-resolution localizer sequence. Then, during free maternal breathing, 2–4 stacks of single-shot fast spin-echo T2w slice images (repetition time = 3100–13300 ms, echo time = 91 ms, in plane pixel size 0.5 mm × 0.5 mm, slice thickness ∼3 mm, no gap between slices) were obtained in each of the approximately axial, sagittal, and coronal planes with respect to the fetal brain. The acquisition of the multiple T2w stacks needed for this study took between 15 and 25 min per subject. The total time of the imaging procedure, including planning and additional MRI sequences not used in this study (e.g., diffusion-weighted imaging), ranged from 45 to 60 min per subject.
Automatic Tissue Segmentation
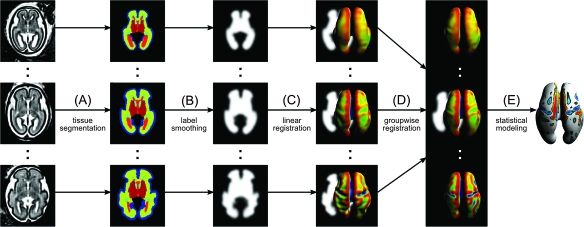
To account for spontaneous fetal movement during scanning, the T2w 2D MRI slices of each subject were registered using the slice intersection motion correction technique (Kim et al. 2010) and reconstructed into high-resolution 3D volumes with isotropic voxel size of 0.5 mm. Using an atlas-based approach (Fig. 1A), reconstructed MRI volumes were automatically segmented into ventricles, deep gray nuclei (including basal ganglia, basal forebrain, and thalamus), the germinal matrix (the ventricular zone), transient layers (including the periventricular, subventricular, intermediate, and subplate zones), and the cortical plate. Although neurons from the subplate are incorporated into the cortex by 36 GW (Kostovic and Rakic 1990; Allendoerfer and Shatz 1994; Kostovic and Judas 2006, 2010; Ayoub and Kostovic 2009; Kanold and Luhmann 2010), the current clinical MRI protocol does not provide enough T2w contrast between the subplate and the intermediate zone to consistently distinguish between these two fetal zones over the entire range of the study (Corbett-Detig et al. 2011). A similar combination of zones has been previously used by others in a study of early cortical folding in preterm infants (Dubois, Benders, Cachia, et al. 2008).
Figure 1.
A dedicated image analysis framework for the mapping of early cortical folding from in utero MRI. (A) Motion-corrected 3D MRI volumes of the fetal brain are automatically segmented into individual tissue types using an atlas-based technique. (B) Tissue maps extracted from automatic segmentations are smoothed with a Gaussian kernel. (C) To account for the overall brain growth, the maps are linearly registered to a reference anatomy and then tessellated into triangular meshes to reconstruct the inner cortical plate surface of the fetal brain. (D) Local measurements of mean surface curvature are mapped onto a population-average inner cortical plate surface established via volumetric groupwise registration. (E) Statistical modeling is performed for each vertex of the population-average surface to detect local patterns of early cortical folding.
A computational atlas of MRI intensity, tissue probability, and shape of the fetal brain was previously created from manual segmentations of subjects with normal brain development using a spatiotemporal modeling framework (Habas, Kim, Corbett-Detig, et al. 2010). From this continuous model of fetal brain growth, a synthetic age-specific MRI intensity template and an age-specific tissue probability map were generated for the gestational age of each subject to be analyzed. The subject MRI was aligned to the age-matched MRI template using a global linear registration driven by maximization of normalized mutual information (Studholme et al. 1999) followed by a sequence of nonlinear deformations driven by maximization of MRI intensity correlation within a fixed mask. Based on the inverse of the estimated spatial transformation, the age-matched tissue probability map was aligned with the subject MRI and used as a source of spatial priors for automatic atlas-based segmentation of developing brain tissues (Habas, Kim, Rousseau, et al. 2010).
Surface Reconstruction
Combined maps of transient layers, deep gray nuclei, and the germinal matrix extracted from automatic tissue segmentation of each subject were smoothed using a 2-mm full width at half-maximum (FWHM) Gaussian kernel (Fig. 1B). To account for the overall brain growth, the maps were linearly registered to a reference anatomy (Fig. 1C). Then, the tissue map of each subject was tessellated into a triangular mesh using a topology-preserving marching cubes algorithm (Lopes and Brodlie 2003) to reconstruct the interface between the developing cortical plate and the transient layers and define the inner cortical plate surface of the fetal brain.
Recent attempts to quantify early brain folding make use of surface curvature that measures the amount by which the analyzed surface deviates from a plane (Batchelor et al. 2002; Pienaar et al. 2008; Rodriguez-Carranza et al. 2008). Two fundamental scalar invariants, a maximal and a minimal curvature, defined at each point on the surface give rise to a number of intrinsic and extrinsic local shape measures (Do Carmo 1976). Among them, mean curvature (H) provides an intuitive indication of a physically interpretable measure of surface geometry—positive values of H express the convexity of a region, whereas negative values of H indicate the level of local concavity. Unlike Gaussian curvature, which indicates whether a surface is locally isometric to a sphere or a saddle, mean curvature provides a measure of local surface folding (Van Essen and Drury 1997). In this study, mean curvature of the inner cortical plate surface was calculated locally at each mesh vertex by fitting quadrics to a patch of its 2-ring neighbors (Petitjean 2002).
Spatial Normalization
For the purpose of temporal modeling of local surface folding, spatial mapping was defined between subject anatomies with different gestational ages and a common coordinate system. As direct surface registration is not feasible for young fetuses due to the lack of consistent structural features such as the primary sulci across all gestational ages, volumetric groupwise registration of tissue maps was performed (Fig. 1D). Tissue maps extracted from 40 automatic segmentations and their 40 copies flipped along the longitudinal fissure were smoothed with 1-mm FWHM Gaussian kernel and then coaligned using a template-free approach (Studholme and Cardenas 2004). The registration procedure estimated a symmetric minimum deformation anatomy of the group and 80 diffeomorphic mappings from this population-average anatomy to each individual subject and its flipped copy. The mappings were regularized using a Gaussian smoothing operator (Modersitzki 2004) with a 1.5-mm FWHM kernel. The size of the kernel was selected experimentally to ensure that topology was preserved during registration. A symmetric population-average inner cortical plate surface was obtained by tessellation of the established population-average anatomy.
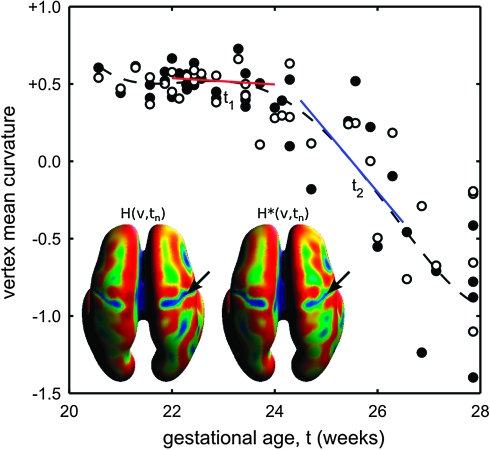
For each study subject with gestational age tn (n = 1, 2, . . ., 40), a pair of maps H(v,tn) and H*(v,tn) was created by transferring of local curvature values from the individual subject's cortical plate surface onto the population-average surface (Figs 1D and 2). For each vertex v of this reference surface, the value of H(v,tn) was calculated using the spatial mapping estimated during groupwise registration for the subject's original tissue map. The value of H*(v,tn) was obtained using the spatial mapping from the population-average anatomy to the subject's tissue maps flipped along the longitudinal fissure.
Figure 2.
Statistical modeling of the formation of the right CS at vertex v. A temporal model H(v,t) is fitted to local measurements of mean surface curvature H(v,tn) (filled dots) and H*(v,tn) (unfilled dots) mapped onto the population-average inner cortical plate surface from subjects with different gestational ages tn. At time point t1, the age-specific rate of curvature changes Hr(v,t1) corresponding to the slope of the red line is close to zero. At time point t2, Hr(v,t2) is significantly different from zero (blue line) indicating ongoing folding at vertex v.
Temporal Modeling of Folding
Age-related changes in local surface curvature at vertex v were represented using a general linear model aimed at describing location-specific temporal folding patterns (Fig. 2):
The symmetry term Hs(v,t) captured the common temporal folding pattern shared by both hemispheres. The curvature asymmetry term Ha(v,t) provided a temporal model of interhemispheric differences in local surface folding. For each vertex v, the coefficients β(v) and α(v) as well as their covariance matrices and were found through joint least-squares fitting to 40 location- and age-specific measurements of H(v,tn) and 40 location- and age-specific measurements of H*(v,tn).
Statistical Analysis
Regions of the fetal brain surface undergoing folding at gestational age t were identified using analysis of variance. For each vertex v, the instantaneous rate of folding Hr(v,t) at age t was calculated as the temporal derivative of the curvature model H(v,t). Then, a test statistic  where σr(v,t) is the uncertainty of Hr(v,t) derived from and , was used to assess whether the local rate of curvature changes at vertex v was significantly different from zero at gestational age t. To account for multiple comparisons, the critical value (P = 0.05) of the test statistic Tr(t) for gestational age t was found in a nonparametric way by performing 10 000 iterations of permutation testing (Nichols and Holmes 2002). If the magnitude of Tr(v,t) exceeded Tr(t), vertex v was deemed as a site of significant folding at gestational age t.
The presence of statistically significant interhemispheric asymmetries in local cortical folding at gestational age t was evaluated using a test statistic  where σa(v,t) is the uncertainty of the asymmetry term Ha(v,t). As previously, to account for multiple comparisons, the critical (P = 0.05) age-specific value of the test statistic Ta(t) was found via 10 000 iterations of permutation testing. Vertices v with values of the test statistic Ta(v,t) exceeding Ta(t) were identified as sites of significant interhemispheric folding asymmetries at gestational age t.
Results
Surface Area Analysis
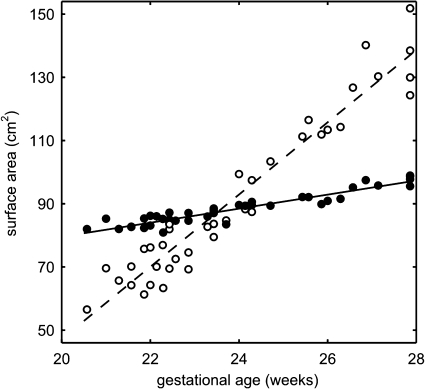
The inner cortical plate surface was initially reconstructed in the native space of each subject based on the results of automatic tissue segmentation (Fig. 3). The area of the inner cortical plate surface was calculated as a sum of mesh triangles within a cortical plate mask excluding vertices on the ventral surface of deep gray nuclei. The surface area increased linearly with age (R2 = 0.92, P < 0.01) at the average rate of 11.4 cm2/week, from approximately 47 cm2 at 20 GW to 139 cm2 at 28 GW (Fig. 4, unfilled dots, dashed line). This effect, however, can be attributed to both the overall growth of brain volume and the early cortical folding.
Figure 3.
Inner cortical plate surfaces of typical fetal brain anatomies between 21 and 28 GW. Colors represent surface area measured within a cortex mask in the native space of each subject. The age-related increase in the surface area can be attributed to both the overall brain growth and the early cortical folding.
Figure 4.
Area of the inner cortical plate surface of the fetal brain before (unfilled dots, dashed line) and after (filled dots, solid line) volume-based normalization.
To separate these two phenomena and measure only changes in surface area due to cortical folding, tissue maps of all study subjects were linearly registered to an average shape reference anatomy associated with the spatiotemporal atlas used for automatic tissue segmentation. After linear scaling, the volume enclosed by the reconstructed inner cortical plate surface of each subject was approximately the same (46 ± 1 cm3). The volume-normalized surface area, measured within a linearly transformed cortical plate mask, increased linearly with age (R2 = 0.88, P < 0.01) at the average rate of 2.2 cm2/week, from approximately 79 cm2 at 20 GW to 97 cm2 at 28 GW (Fig. 4, filled dots, solid line).
Surface Curvature Analysis
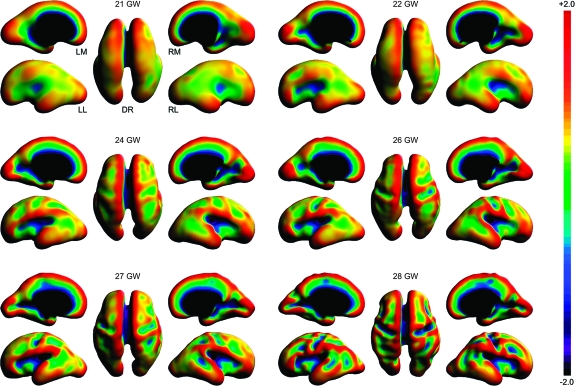
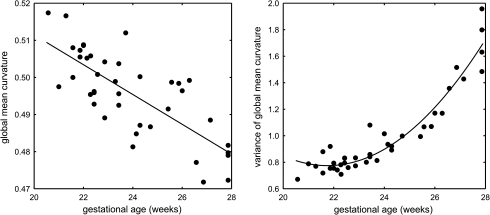
Figure 5 shows maps of mean curvature for typical fetal brain anatomies between 20 and 28 GW. Two summary measures were calculated from each subject's surface within its cortical plate mask—global mean curvature and variance of global mean curvature (Fig. 6). The global mean curvature decreased linearly with gestational age (R2 = 0.57) as the brain surface evolves from smooth and mostly convex (positive curvature) to more complex with expanding concave regions (negative curvature) corresponding to emerging sulci. Additionally, we observed quadratic growth (R2 = 0.91) of the variance of global mean curvature over the analyzed age range, indicating the formation of sharp gyral crests and sulcal fundi with extreme curvature values. Accelerated increase of the variance started around 24–25 GW and corresponded to the emergence of multiple major landmarks including the central sulcus (CS), the superior frontal sulcus (SFS), the superior temporal sulcus (STS), and the middle temporal gyrus (MTG).
Figure 5.
Dorsal (DR), left medial (LM), left lateral (LL), right medial (RM), and right lateral (RL) views of mean curvature (H) maps of typical inner cortical plate surfaces between 21 and 28 GW after volume-based normalization. Warm colors represent local convexity (H > 0); cool colors represent local concavity (H < 0).
Figure 6.
Global mean curvature and variance of global mean curvature of the inner cortical plate surface as a function of the gestational age of the subject.
Analysis of Early Folding Patterns
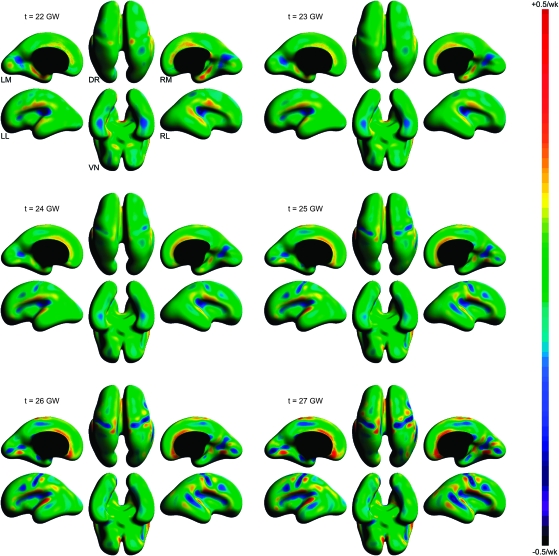
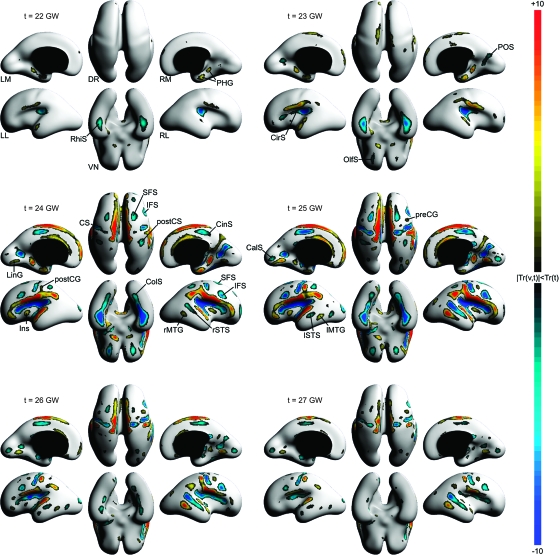
To detect the evolution of the inner cortical plate surface and precisely stage the formation of individual sulci and gyri during early cortical folding, maps of the instantaneous rate of folding Hr(v,t) were calculated for selected time points between 21 and 27 GW (Fig. 7). The test statistic Tr(v,t) was used to assess whether the location- and age-specific rate of folding was significantly different from zero. Figure 8 shows regions of the fetal brain surface where the local rate of folding passed the significance test at P = 0.05 (corrected) for selected time points between 22 and 27 GW.
Figure 7.
Dorsal (DR), ventral (VN), left medial (LM), left lateral (LL), right medial (RM), and right lateral (RL) views of age-specific maps of the instantaneous rate of changes in surface curvature Hr(v,t) indicating spatiotemporal patterns of early cortical folding. Warm colors represent regions of increasing convexity at gestational age t indicating the formation of a gyrus; cool colors represent regions of increasing concavity at gestational age t occurring along a forming sulcus.
Figure 8.
Dorsal (DR), ventral (VN), left medial (LM), left lateral (LL), right medial (RM), and right lateral (RL) views of age-specific maps of Tr(v,t) indicating regions of the fetal brain surface where the age-specific rate of local folding Hr(v,t) is significantly different from zero at gestational age t. All maps are thresholded at significance level P = 0.05 (corrected). Warm colors represent regions of significant increases in convexity (forming gyri); cool colors represent regions of significant increases in concavity (forming sulci).
The earliest significant changes in surface curvature were detected in the region of the Sylvian fissure, which is already present in the fetal brain at 20 GW. The most posterior part of the Sylvian fissure and the circular sulcus (CirS) underwent folding changes up to 26 GW reflected by significant increases in concavity of these regions. The folding progressed in the anterior direction along the superior and inferior aspects of the CirS through 27 GW. Complementary significant increases in convexity occurred along the posterior operculum in a similar temporal pattern. The convexity of the insula (Ins) increased significantly over a short period from 24 to 26 GW.
The significant increases in curvature along the temporal operculum extended over the developing superior temporal gyrus. The formation of the left STS (lSTS) and the right STS (rSTS) was detected around 24–25 GW, which further defined the superior temporal gyrus. The STS showed continuous significant increases in concavity after 25 GW, whereas the left MTG (lMTG) and the right MTG (rMTG) exhibited continuous significant increases in convexity at the same time. At 27 GW, these structures were visible on both MRI and reconstructed cortical plate surfaces over the posterior two-thirds of the temporal lobe.
The first indication of the emergence of the CS was the bilaterally increasing convexity of the interhemispheric margins around 23 GW. By 24 GW, the CS was significantly increasing in concavity starting from the superior margin and progressing toward the Sylvian fissure through 27 GW. At this stage, changes in curvature of the precentral gyrus (preCG), the postcentral gyrus (postCG), and the postcentral sulcus were focal since only isolated regions of significant changes were detected.
In the frontal lobe, two regions of significant increase in concavity were detected by 24 GW. First, the most anterior and the most posterior parts of the SFS emerged. Second, a broad region of the ventrolateral surface, directly anterior to the future preCG, increased in concavity. This change, associated with branching of the Sylvian fissure, represented the formation of the opercular and triangular parts of the inferior frontal gyrus. In addition, the orbital surface of the frontal lobe significantly increased in concavity. This change was not clearly associated with one particular sulcus and could be related to the growth of the frontal lobe over the orbits or to the development of the multiple gyri and sulci.
The views of the medial surface show a number of distinct changes in surface curvature. From 20 GW forward, the posterior part of the cingulate sulcus (CinS) significantly increased in convexity. The anterior part of the sulcus did not start to show significant curvature changes until after 23 GW. The superior margin of the hemisphere increased in convexity in the frontoparietal region for nearly the entire age range of the study. The prefrontal part of the margin changed significantly only between 24 and 25 GW. Already present at 20 GW, the parieto-occipital sulcus (POS) underwent further increases in curvature through 27 GW, with the most expansive changes observed between 24 and 26 GW. During this time interval, the adjacent developing precuneus increased in convexity. Like the POS, the calcarine sulcus (CalS) was also visible on both MRI and reconstructed cortical plate surfaces at 20 GW, and changes in its curvature were paired with gyral formation. In contrast, however, significant increases in concavity of the CalS and convexity along the adjacent lingual gyrus (LinG) were not detected until 24 GW.
In the medial temporal lobe, the parahippocampal gyrus (PHG) showed significant increase in convexity from 20 to 25 GW. The emergence of the ventrally bordering rhinal sulcus (RhiS) was first detected at 23 GW as reflected by significant increases in concavity. These changes were then extended posteriorly to the collateral sulcus (ColS), which formed at around 24 GW.
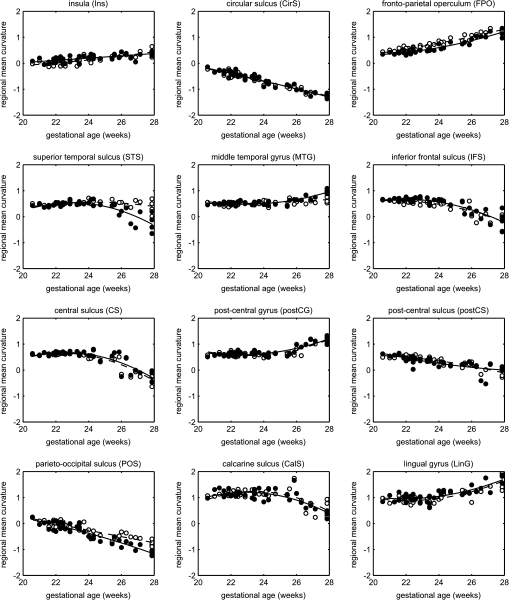
The regions of significant changes in surface curvature at 25 GW were used to define ROIs corresponding to the forming cortical landmarks. For 12 of these ROIs, including most primary sulci and gyri, regional mean curvature was calculated by averaging of subject-specific measurements of surface curvature within an ROI and plotted as a function of gestational age (Fig. 9). The resulting graphs show different developmental trajectories of individual sulci and gyri, some of which (e.g., CirS, POS) develop at almost constant rate throughout the age range of the study, whereas others (e.g., CS, LinG) demonstrate clear growth acceleration after 24–25 GW. The plots of regional mean curvature also reveal interhemispheric asymmetries in the formation of the frontoparietal operculum (FPO), STS, MTG, and POS.
Figure 9.
Changes in regional mean curvature of selected primary sulci and gyri forming between 20 and 28 GW. Unfilled dots and dashed lines represent the left hemisphere; filled dots and solid lines represent the right hemisphere.
Analysis of Folding Asymmetries
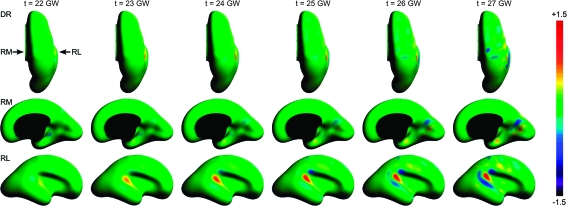
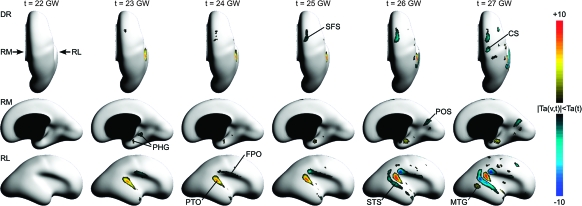
Age-specific maps of the asymmetry term Ha(v,t) (Figs 10 and 11) further visualize spatiotemporal patterns of the emergence of interhemispheric asymmetries during early cortical folding. On the lateral surface, significant differences in curvature were detected mainly in the posterior peri-Sylvian area. Beginning at 23 GW, the FPO was more convex whereas the posterior temporal operculum (PTO) was more concave on the right hemisphere. The regions of significant interhemispheric differences in curvature of the inner cortical plate surface shifted more posteriorly with age. The formation of the STS was detected approximately 1 week earlier on the right (24 GW) than the left (25 GW) hemisphere. The significant interhemispheric asymmetries in surface curvature remained apparent after the STS was present bilaterally (25–27 GW). At this stage, the MTG had significantly greater focal convexity on the right than the left hemisphere.
Figure 10.
Dorsal (DR), right medial (RM), and right lateral (RL) views of age-specific maps of Ha(v,t) revealing the emergence of interhemispheric asymmetries during early cortical folding. Warm colors represent regions that are more convex on the right hemisphere at gestational age t; cool colors represent regions that are more concave on the right hemisphere at gestational age t.
Figure 11.
Dorsal (DR), right medial (RM), and right lateral (RL) views of age-specific maps of Ta(v,t) indicating regions of the fetal brain surface with significant interhemispheric folding asymmetries at gestational age t. All maps are thresholded at significance level P = 0.05 (corrected). Warm colors represent regions that are significantly more convex on the right hemisphere; cool colors represent regions that are significantly more concave on the right hemisphere.
Although the formation of the CS was detected at approximately the same age on both hemispheres (24–25 GW), its dorsolateral part was significantly more concave on the right hemisphere at 27 GW. Interhemispheric asymmetries were also found at the area of the SFS that was more concave on the right than the left hemisphere. These differences in surface curvature were detected in the most anterior part of this sulcus as early as 23 GW, expanding in the posterior direction with age (24–27 GW). On the medial surface of the brain, the dorsal part of the right POS was significantly more concave at 26 GW and later. Beginning at 23 GW, an area of significantly greater concavity was also found along the anterior part of the right PHG.
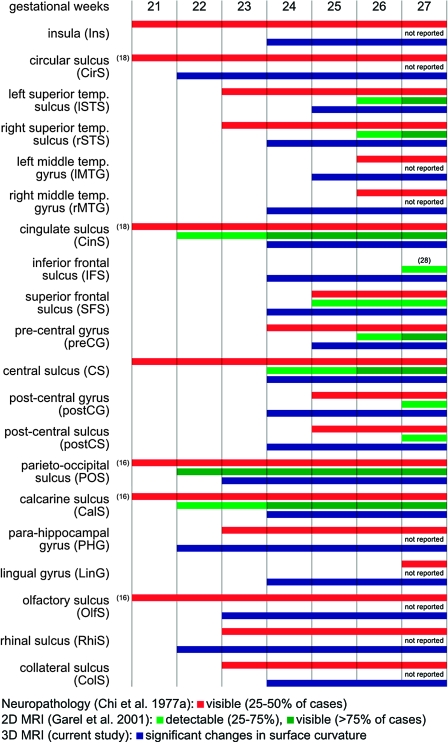
Timetable of Early Cortical Folding
Figure 12 summarizes the study findings in the form of a timetable of early cortical folding with separate entries for the left and the right hemisphere for the STS and the MTG. Overall, the spatiotemporal pattern of cortical folding detected in the current study is more similar to the sequence of sulcogenesis drawn from neuropathology (Chi et al. 1977a) rather than previous analysis of 2D and 3D MRI of the developing brain (Levine and Barnes 1999; Garel et al. 2001, 2003; Dubois, Benders, Cachia, et al. 2008). The reduced lag between the time individual sulci are visible in postmortem tissue and the time they become detectable from in utero imaging indicates higher temporal sensitivity of the presented methodology with respect to previous MRI studies.
Figure 12.
A timetable of early cortical folding based on neuropathology (Chi et al. 1977a), qualitative evaluation of 2D MRI slices (Garel et al. 2001), and quantitative analysis of motion-corrected 3D MRI volumes (current study). For the neuropathology study, the timing of the formation of sulci and gyri corresponds to the gestational age when the structure was “visible” in 25–50% of the analyzed brains. For the 2D MRI study, a structure was deemed “detectable” when it was present in 25–75% and “visible” when it was present in more than 75% of the analyzed brains. For the current 3D MRI study, the formation of individual sulci and gyri is detected based on significant changes in local curvature of the inner cortical plate surface (Fig. 8).
Discussion
Building upon recent advances in motion-corrected 3D reconstruction of in utero MRI (Rousseau et al. 2006; Kim et al. 2010) and quantitative analysis of the fetal brain (Habas, Kim, Corbett-Detig, et al. 2010; Habas, Kim, Rousseau, et al. 2010; Corbett-Detig et al. 2011), this study introduces a novel image analysis framework for the detection and mapping of early cortical folding from in utero MRI. Unlike previous 2D MRI studies of fetal brain folding, the presented methodology does not depend on a particular slice orientation and provides reliable and reproducible quantification of cortical plate surface development during midgestation. First, motion-corrected 3D MRI volumes of the fetal brain are automatically segmented using age-specific tissue probability atlases, which allows for accurate and consistent reconstruction of the inner cortical plate surface over a period of rapid changes in brain size and shape. Then, spatiotemporal patterns of early cortical folding during normal brain development are extracted based on measurements of local surface curvature mapped to a common reference space from subjects with different gestational ages. Finally, statistical testing is employed to detect the precise timing of the formation of most primary sulci and gyri known to develop between 20 and 28 GW as well as the emergence of structural interhemispheric asymmetries in the fetal brain.
Early cortical folding and the emergence of structural asymmetries in the developing brain have been previously analyzed by postmortem studies (Chi et al. 1977a, 1977b; Feess-Higgins and Larroche 1988). However, conventional neuropathological examination is limited by the effects of delivery on the brain and the substantial fluid loss during histological processing, which may affect conclusions of autopsy regarding the presence of a particular cortical landmark. Similarly, MRI of preterm infants (Dubois, Benders, Borradori-Tolsa, et al. 2008; Dubois, Benders, Cachia, et al. 2008) is subject to the effects of the many complications of prematurity upon brain development (Ajayi-Obe et al. 2000; Kapellou et al. 2006). Even in the absence of obvious focal pathologies, preterm-born infants may have reduced cortical folding at term compared with term-born controls (Kapellou et al. 2006). Therefore, these studies cannot provide an accurate representation of normal in utero brain development (Rutherford et al. 2008).
Recent technical developments enable MRI of human fetuses in utero to provide information about truly normal brain growth and allow for image-based mathematical modeling of early cortical folding. Qualitative and quantitative analysis of these kinds of observations has been previously limited to processing of 2D MRI slices (Levine and Barnes 1999; Garel et al. 2001, 2003; Kasprian et al. 2011). Although this may be a practical approach in a clinical setting, it exhibits significant methodological limitations. Firstly, it is not feasible to fully control for an absolutely consistent 2D imaging plane during in utero MRI scanning. Secondly, exact locations of tissue boundaries may be difficult to find on 2D MRI slices with thickness of 3–4 mm due to partial volume effect. Finally, analysis of orthogonal 2D MRI sections does not take into account the inherent 3D nature of the brain surface. In the current study, these challenges are overcome by building high-resolution isotropic 3D images of the fetal brain from multiple stacks of 2D MRI slices acquired in different orientations. This approach opens up the possibility of reconstructing the entire inner cortical plate surface and performing 3D morphometric analysis at fine spatial resolution.
Previous MRI studies of early cortical folding typically have not attempted to map local measures of surface geometry across subjects to examine spatiotemporal patterns of early cortical folding. This restricted quantitative analysis of folding and asymmetries to summary measures derived from the entire brain or a large region such as sulcation index and surface area (Dubois, Benders, Borradori-Tolsa, et al. 2008; Dubois, Benders, Cachia, et al. 2008) or the length and height of the temporal lobe and the maximum depth of the STS (Kasprian et al. 2011). In the current study, in addition to summary measures of brain development such as the overall area as well as global and regional curvature of the inner cortical plate surface, surface curvature is calculated at thousands of vertices over the whole fetal brain surface. These local measurements of surface geometry from multiple subjects with different gestational ages are then mapped onto a common reference surface defined via unbiased groupwise registration of the study population. While accurate spatial mapping of brain regions across individuals enable statistical analysis of temporal development of individual sulci, mapping between hemispheres makes it possible to detect the emergence of interhemispheric asymmetries during early cortical folding. As this modeling approach takes into account the natural intersubject variability and the uncertainty in fetal age estimation, it provides better statistical representation of structural changes in the analyzed population and can detect population-level patterns of early cortical folding.
Temporal Staging of Early Folding
Comprehensive timetables of early cortical folding have been previously generated based on postmortem examination of the fetal brain (Chi et al. 1977a, 1977b; Feess-Higgins and Larroche 1988). The tables report the approximate timing of emergence of individual sulci in terms of gestational age. Early prenatal imaging studies demonstrated an average lag of 2 weeks between the time sulci are detected in postmortem brain tissue and the time they are visible on 2D in utero MRI (Levine and Barnes 1999; Garel et al. 2001, 2003). The lag varied for different primary sulci with the greatest differences observed for the cingulate sulcus (18 vs. 22–23 GW), the calcarine fissure (16 vs. 22–23 GW), the STS (23 vs. 26 GW), and the CS (20 vs. 24–25 GW) (Garel et al. 2001). Although all these studies used a visually perceivable indentation in the brain surface as an indication of a forming sulcus, the consistently delayed emergence of individual sulci on prenatal MRI may have been a consequence of uncertainty in the location and orientation of 2D MRI slices as well as partial volume averaging in each 3- to 5-mm thick slice affecting qualitative assessment of early cortical folding from this type of imaging data.
A postnatal MRI study of premature neonates (Dubois, Benders, Cachia, et al. 2008) reported a similar though delayed temporal sequence of early cortical folding in comparison with postmortem (Chi et al. 1977a) and prenatal analyses (Garel et al. 2001). For example, the presence of the CS was detected at 26.7 GW (vs. 20 and 24–25 GW in the postmortem and the prenatal study, respectively) and the STS at 27 GW (vs. 23 and 26 GW, respectively). As in previous qualitative studies, a sulcus was considered to be present if it was identified in an arbitrarily selected percentage of analyzed cases. Moreover, the age range of the neonatal study (26–36 GW) precluded the observance of the actual emergence of some primary sulci as they were already present in all subjects.
Overall, the estimated timing of emergence of individual sulci resembles that drawn from neuropathology (Chi et al. 1977a) rather than the sequence described in previous 2D and 3D MRI studies of early folding (Garel et al. 2001, 2003; Dubois, Benders, Cachia, et al. 2008). The formation of many primary sulci is detected at the same time or no more than a week after these structures are visible on postmortem examination. The emergence of some cortical landmarks, including the inferior and SFSs, is actually timed before they have been identified by either autopsy or 2D MRI. In addition, the formation of the postCG, LinG, and PHG is detected before the gestational age at which their presence in postmortem brains is typically observed by neuropathologists. This may be partially explained by the fact that the human eye is less sensitive to local convexities indicating forming gyri than small surface indentations associated with emerging sulci.
Emergence of Folding Asymmetries
Structural asymmetries in the human brain have been previously documented in adults (Galaburda and Geschwind 1981; Galaburda et al. 1987; Shapleske et al. 1999; Davatzikos and Bryan 2002; Toga and Thompson 2003; Mangin et al. 2004; Ochiai et al. 2004; Van Essen 2005; Hill et al. 2010), children (Galaburda and Geschwind 1981; Sowell et al. 2002) as well as term (Hill et al. 2010) and preterm infants (Chi et al. 1977b; Dubois, Benders, Cachia, et al. 2008). The most prominent differences between the left and right hemispheres have been typically observed in the peri-Sylvian cortex around the planum temporale and the STS. These regions have also been identified as sites of significant asymmetries in the expression of multiple genes during early embryonic development (Sun et al. 2005).
In this study, significant interhemispheric asymmetries were first identified in the peri-Sylvian region at 23 GW. Structural asymmetries in this region have been previously reported in a qualitative study of postmortem brains (Chi et al. 1977b) where two-thirds of fetuses demonstrated peri-Sylvian asymmetry after the age of 31 GW. Postnatal MRI of preterm infants confirmed that several sulci appear earlier in the right hemisphere (Dubois, Benders, Cachia, et al. 2008). The study also reported a larger area of the right STS at 26–30 GW. Structural brain asymmetries of the peri-Sylvian region arising during early cortical folding are correlated with differences in sulcal depth between the left and right hemispheres. A recent fetal neuroimaging study reported that the right STS appeared 2 weeks earlier and was significantly deeper than its left counterpart in a majority of analyzed cases (Kasprian et al. 2011). This asymmetry in sulcal depth is apparently permanent as its presence has been consistently confirmed in term infants (Hill et al. 2010) and adults (Van Essen 2005; Hill et al. 2010).
The medial surface of the fetal brain also demonstrates an early folding asymmetry. Beginning at 24 GW, the POS is more concave on the right than the left hemisphere, and the difference becomes statistically significant after 26 GW. This finding corresponds well to the sulcal depth asymmetry along the wall of this sulcus previously reported in adults (Van Essen 2005; Hill et al. 2010) but, interestingly, not identified as significant in term infants (Hill et al. 2010) possibly due to difficulties in precise sulcal alignment and low sample size. In our study, a larger collection of normal fetal anatomies was coaligned based on volumetric registration of tissue maps rather than landmark-based registration of brain surfaces. This approach allowed for greater precision in mapping of changes in sulcal folding across different gestational ages and apparently led to superior sensitivity to structural interhemispheric differences for developing brain anatomies.
In contrast to a preterm study where no asymmetries in the developing primary sensorimotor cortex could be identified (Dubois, Benders, Cachia, et al. 2008), our analysis detected small clusters of significant interhemispheric differences in surface curvature in the central region at 26–27 GW. Structural asymmetries in this area, including a more prominent CS in the dominant hemisphere, have been previously reported in morphometric studies of cortical folding in adults (Davatzikos and Bryan 2002; Mangin et al. 2004). At this stage, the CS asymmetry is localized to the earliest developing superior section. Interhemispheric shape differences along the remaining length of the CS may become detectable as the sulcus deepens with gestation. Further lateralization of this region can also be expected after the development of mature sensorimotor functions.
This study complements and extends our understanding of the origins of structural interhemispheric brain asymmetries by adding a starting point to their developmental trajectories derived from analysis of more mature anatomies. The consistency of findings based on analysis of fetal MRI with the results presented in studies of infant and adult brains indicates that the pattern of sulci and gyri as well as their asymmetries established during mid- and late gestation changes only modestly by adulthood. This suggests that the structural features of the normal human brain, including a stable pattern of interhemispheric differences, are reasonably resistant to postnatal environmental influences.
Clinical Significance
Multislice 2D fetal MRI is often acquired as a result of an acute clinical change or an abnormal finding on routine prenatal ultrasonography that has generated a search for other central nervous system (CNS) anomalies or injuries. Although it seems unlikely that the generation of 3D images with surface curvature analysis will be performed for all cases, in fetuses being scanned for serious CNS abnormalities or neurodevelopmental disturbances in older siblings, assessment of sulcation patterns may prove extremely valuable. Objective quantification of early cortical folding will help in the detection and precise mapping of subtle but clinically significant deviations in fetal brain maturation. Local alterations in the pattern of cortical convolutions may reflect abnormalities in the developing brain that may have later cognitive and functional correlations. For example, localized abnormal folding is often a phenotypic marker of developing focal lesions that may later become masked by complicated gyral structure during late gestation and infancy (Furusho et al. 1998). Normative patterns of early cortical folding and structural lateralization derived from an imaging modality used in clinical practice will facilitate the analysis of the potential effects of maternal preeclampsia (Oatridge et al. 2002), prenatal nutrition (Morgane et al. 1993), and stress (Charil et al. 2010) on fetal brain morphology. In addition, identification of fetuses with predilection for neurological disorders such as epilepsy (Ronan et al. 2007), schizophrenia (Wisco et al. 2007; Csernansky et al. 2008), attention deficit hyperactivity disorder (Wolosin et al. 2009), and autism (Nordahl et al. 2007) may lead to earlier diagnosis and more effective therapy.
Funding
National Institutes of Health (R01 NS 055064 to C.S., K23 NS 052506 to O.A.G.); European Research Council (FP7/2007-2013 Grant Agreement no. 207667 to F.R.).
Acknowledgments
Conflict of Interest: None declared.
References
- Ajayi-Obe M, Saeed N, Cowan FM, Rutherford MA, Edwards AD. Reduced development of cerebral cortex in extremely preterm infants. Lancet. 2000;356:1162–1163. doi: 10.1016/s0140-6736(00)02761-6. [DOI] [PubMed] [Google Scholar]
- Allendoerfer KL, Shatz CJ. The subplate, a transient neocortical structure: its role in the development of connections between thalamus and cortex. Annu Rev Neurosci. 1994;17:185–218. doi: 10.1146/annurev.ne.17.030194.001153. [DOI] [PubMed] [Google Scholar]
- Ayoub AE, Kostovic I. New horizons for the subplate zone and its pioneering neurons. Cereb Cortex. 2009;19:1705–1707. doi: 10.1093/cercor/bhp025. [DOI] [PubMed] [Google Scholar]
- Barbe A. Recherches sur l'embryologie du systeme nerveux central de l'homme. Paris: Masson; 1938. [Google Scholar]
- Barkovich AJ, Kjos BO, Jackson DE, Norman D. Normal maturation of the neonatal and infant brain: MRI imaging at 1.5T. Radiology. 1988;166:173–180. doi: 10.1148/radiology.166.1.3336675. [DOI] [PubMed] [Google Scholar]
- Bartelmez GW. The subdivisions of the neural folds in man. J Comp Neurol. 1923;35:231–247. [Google Scholar]
- Bartelmez GW, Dekaban AS. The early development of the human brain. Contrib Embryol. 1962;37:13–32. [Google Scholar]
- Batchelor PG, Castellano Smith AD, Hill DLG, Hawkes DJ, Cox TCS, Dean AF. Measures of folding applied to the development of the human fetal brain. IEEE Trans Med Imaging. 2002;21:953–965. doi: 10.1109/TMI.2002.803108. [DOI] [PubMed] [Google Scholar]
- Charil A, Laplante DP, Vaillancourt C, King S. Prenatal stress and brain development. Brain Res Rev. 2010;65:56–79. doi: 10.1016/j.brainresrev.2010.06.002. [DOI] [PubMed] [Google Scholar]
- Chi JG, Dooling EC, Gilles FH. Gyral development of the human brain. Ann Neurol. 1977a;1:86–93. doi: 10.1002/ana.410010109. [DOI] [PubMed] [Google Scholar]
- Chi JG, Dooling EC, Gilles FH. Left-right asymmetries of the temporal speech areas of the human fetus. Arch Neurol. 1977b;34:346–348. doi: 10.1001/archneur.1977.00500180040008. [DOI] [PubMed] [Google Scholar]
- Corbett-Detig JM, Habas PA, Scott JM, Kim K, Rajagopalan V, McQuillen PS, Barkovich AJ, Glenn OA, Studholme C. 3D global and regional patterns of human fetal subplate growth determined in utero. Brain Struct Funct. 2011;215:255–263. doi: 10.1007/s00429-010-0286-5. [DOI] [PMC free article] [PubMed] [Google Scholar]
- Csernansky JG, Gillespie SK, Dierker DL, Anticevic A, Wang L, Barch DM, Van Essen DC. Symmetric abnormalities in sulcal patterning in schizophrenia. Neuroimage. 2008;43:440–446. doi: 10.1016/j.neuroimage.2008.07.034. [DOI] [PMC free article] [PubMed] [Google Scholar]
- Davatzikos C, Bryan RN. Morphometric analysis of cortical sulci using parametric ribbons: a study of the central sulcus. J Comput Assist Tomogr. 2002;26:298–307. doi: 10.1097/00004728-200203000-00024. [DOI] [PubMed] [Google Scholar]
- Do Carmo MP. Differential geometry of curves and surfaces. Englewood Cliffs (NJ): Prentice Hall; 1976. [Google Scholar]
- Dubois J, Benders M, Borradori-Tolsa C, Cachia A, Lazeyras F, Ha-Vinh Leuchter R, Sizonenko SV, Warfield SK, Mangin J-F, Huppi PS. Primary cortical folding in the human newborn: an early marker of later functional development. Brain. 2008;131:2028–2041. doi: 10.1093/brain/awn137. [DOI] [PMC free article] [PubMed] [Google Scholar]
- Dubois J, Benders M, Cachia A, Lazeyras F, Ha-Vinh Leuchter R, Sizonenko SV, Borradori-Tolsa C, Mangin J-F, Huppi PS. Mapping the early cortical folding process in the preterm newborn brain. Cereb Cortex. 2008;18:1444–1454. doi: 10.1093/cercor/bhm180. [DOI] [PubMed] [Google Scholar]
- Feess-Higgins A, Larroche J-C. Development of the human fetal brain: an anatomical atlas. Paris: Masson; 1988. [Google Scholar]
- Fontes V. Morfologia do Cortex Cerebral (Desenvolvimento) Lisbon (Portugal): Instituto Antonio Aurelio da Costa Ferreira; 1944. [Google Scholar]
- Furusho J, Kato T, Tazaki I, Iikura Y, Takita S. MRI lesions masked by brain development: a case of infant-onset focal epilepsy. Pediatr Neurol. 1998;19:377–381. doi: 10.1016/s0887-8994(98)00066-6. [DOI] [PubMed] [Google Scholar]
- Galaburda AM, Corsiglia J, Rosen GD, Sherman GF. Planum temporale asymmetry, reappraisal since Geschwind and Levitsky. Neuropsychologia. 1987;25:853–868. [Google Scholar]
- Galaburda AM, Geschwind N. Anatomical asymmetries in the adult and developing brain and their implications for function. Adv Pediatr. 1981;28:271–292. [PubMed] [Google Scholar]
- Garel C, Chantrel E, Brisse H, Elmaleh M, Luton D, Oury J-F, Sebag G, Hassan M. Fetal cerebral cortex: normal gestational landmarks identified using prenatal MRI imaging. AJNR Am J Neuroradiol. 2001;22:184–189. [PMC free article] [PubMed] [Google Scholar]
- Garel C, Chantrel E, Elmaleh M, Brisse H, Sebag G. Fetal MRI: normal gestational landmarks for cerebral biometry, gyration and myelination. Childs Nerv Syst. 2003;19:422–425. doi: 10.1007/s00381-003-0767-4. [DOI] [PubMed] [Google Scholar]
- Glenn OA, Barkovich AJ. Magnetic resonance imaging of the fetal brain and spine: an increasingly important tool in prenatal diagnosis. Am J Neuroradiol. 2006;27:1604–1611. [PMC free article] [PubMed] [Google Scholar]
- Habas PA, Kim K, Corbett-Detig JM, Rousseau F, Glenn OA, Barkovich AJ, Studholme C. A spatiotemporal atlas of MRI intensity, tissue probability and shape of the fetal brain with application to segmentation. Neuroimage. 2010;53:460–470. doi: 10.1016/j.neuroimage.2010.06.054. [DOI] [PMC free article] [PubMed] [Google Scholar]
- Habas PA, Kim K, Rousseau F, Glenn OA, Barkovich AJ, Studholme C. Atlas-based segmentation of developing tissues in the human brain with quantitative validation in young fetuses. Hum Brain Mapp. 2010;31:1348–1358. doi: 10.1002/hbm.20935. [DOI] [PMC free article] [PubMed] [Google Scholar]
- Hill J, Dierker D, Neil J, Inder T, Knutsen A, Harwell J, Coalson T, Van Essen DC. A surface-based analysis of hemispheric asymmetries and folding of cerebral cortex in term-born human infants. J Neurosci. 2010;30:2268–2276. doi: 10.1523/JNEUROSCI.4682-09.2010. [DOI] [PMC free article] [PubMed] [Google Scholar]
- His W. Die Entwickelung des menschlichen Gehirns wahrend der ersten Monate. Leipzig (Germany): Hirzel; 1904. [Google Scholar]
- Hochstetter F. Beitrage zur Entwicklungsgeschichte des menschlichen Gehirns. Wien (Austria): Deuticke; 1919. [Google Scholar]
- Kanold PO, Luhmann HJ. The subplate and early cortical circuits. Annu Rev Neurosci. 2010;33:23–48. doi: 10.1146/annurev-neuro-060909-153244. [DOI] [PubMed] [Google Scholar]
- Kapellou O, Counsell SJ, Kennea N, Dyet L, Saeed N, Stark J, Maalouf E, Duggan P, Ajayi-Obe M, Hajnal J, et al. Abnormal cortical development after premature birth shown by altered allometric scaling of brain growth. PLoS Med. 2006;3:1382–1390. doi: 10.1371/journal.pmed.0030265. [DOI] [PMC free article] [PubMed] [Google Scholar]
- Kasprian G, Langs G, Brugger PC, Bittner M, Weber M, Arantes M, Prayer D. The prenatal origin of hemispheric asymmetry: an in utero neuroimaging study. Cereb Cortex. 2011 doi: 10.1093/cercor/bhq179. 21:1076-1083. [DOI] [PubMed] [Google Scholar]
- Kim K, Habas PA, Rousseau F, Glenn OA, Barkovich AJ, Studholme C. Intersection based motion correction of multislice MRI for 3-D in utero fetal brain image formation. IEEE Trans Med Imaging. 2010;29:146–158. doi: 10.1109/TMI.2009.2030679. [DOI] [PMC free article] [PubMed] [Google Scholar]
- Kostovic I, Judas M. Prolonged coexistence of transient and permanent circuitry elements in the developing cerebral cortex of fetuses and preterm infants. Dev Med Child Neurol. 2006;48:388–393. doi: 10.1017/S0012162206000831. [DOI] [PubMed] [Google Scholar]
- Kostovic I, Judas M. The development of the subplate and thalamocortical connections in the human foetal brain. Acta Paediatr. 2010;99:1119–1127. doi: 10.1111/j.1651-2227.2010.01811.x. [DOI] [PubMed] [Google Scholar]
- Kostovic I, Judas M, Rados M, Hrabac P. Laminar organization of the human fetal cerebrum revealed by histochemical markers and magnetic resonance imaging. Cereb Cortex. 2002;12:536–544. doi: 10.1093/cercor/12.5.536. [DOI] [PubMed] [Google Scholar]
- Kostovic I, Rakic P. Developmental history of the transient subplate zone in the visual and somatosensory cortex of the macaque monkey and human brain. J Comp Neurol. 1990;297:441–470. doi: 10.1002/cne.902970309. [DOI] [PubMed] [Google Scholar]
- Kostovic I, Vasung L. Insights from in vitro fetal magnetic resonance imaging of cerebral development. Semin Perinatol. 2009;33:220–233. doi: 10.1053/j.semperi.2009.04.003. [DOI] [PubMed] [Google Scholar]
- Larroche JC. The development of the central nervous system during intrauterine life. In: Falkner F, editor. Human development. Philadelphia: WB Saunders Co; 1966. pp. 257–276. [Google Scholar]
- Lefevre J, Mangin J-F. A reaction-diffusion model of human brain development. PLoS Comput Biol. 2010;6:e1000749. doi: 10.1371/journal.pcbi.1000749. [DOI] [PMC free article] [PubMed] [Google Scholar]
- Levine D, Barnes PD. Cortical maturation in normal and abnormal fetuses as assessed with prenatal MRI imaging. Radiology. 1999;210:751–758. doi: 10.1148/radiology.210.3.r99mr47751. [DOI] [PubMed] [Google Scholar]
- Lopes A, Brodlie K. Improving the robustness and accuracy of the marching cubes algorithm for isosurfacing. IEEE Trans Vis Comput Graph. 2003;9:16–29. [Google Scholar]
- Mangin J-F, Riviere D, Cachia A, Duchesnay E, Cointepas Y, Papadopoulos-Orfanos D, Scifo P, Ochiai T, Brunelle F, Regis J. A framework to study the cortical folding patterns. Neuroimage. 2004;23:S129–S138. doi: 10.1016/j.neuroimage.2004.07.019. [DOI] [PubMed] [Google Scholar]
- Modersitzki J. Numerical methods for image registration. Oxford: Oxford University Press; 2004. [Google Scholar]
- Morgane PJ, Austin-LaFrance R, Bronzino J, Tonkiss J, Diaz-Cintra S, Cintra L, Kemper T, Galler JR. Prenatal malnutrition and development of the brain. Neurosci Biobehav Rev. 1993;17:91–128. doi: 10.1016/s0149-7634(05)80234-9. [DOI] [PubMed] [Google Scholar]
- Nichols TE, Holmes AP. Nonparametric permutation tests for functional neuroimaging: a primer with examples. Hum Brain Mapp. 2002;15:1–25. doi: 10.1002/hbm.1058. [DOI] [PMC free article] [PubMed] [Google Scholar]
- Nordahl CW, Dierker D, Mostafavi I, Schumann CM, Rivera SM, Amaral DG, Van Essen DC. Cortical folding abnormalities in autism revealed by surface-based morphometry. J Neurosci. 2007;27:11725–11735. doi: 10.1523/JNEUROSCI.0777-07.2007. [DOI] [PMC free article] [PubMed] [Google Scholar]
- Oatridge A, Holdcroft A, Saeed N, Hajnal JV, Puri BK, Fusi L, Bydder GM. Change in brain size during and after pregnancy: study in healthy women and women with preeclampsia. Am J Neuroradiol. 2002;23:19–26. [PMC free article] [PubMed] [Google Scholar]
- Ochiai T, Grimault S, Scavarda D, Roch G, Hori T, Riviere D, Mangin J-F, Regis J. Sulcal pattern and morphology of the superior temporal sulcus. Neuroimage. 2004;22:706–719. doi: 10.1016/j.neuroimage.2004.01.023. [DOI] [PubMed] [Google Scholar]
- O'Rahilly R, Muller F. The embryonic human brain: an atlas of developmental stages. New York: Wiley-Liss; 1999. [Google Scholar]
- Petitjean S. A survey of methods for recovering quadrics in triangle meshes. ACM Comput Surv. 2002;34:211–262. [Google Scholar]
- Pienaar R, Fischl B, Caviness V, Makris N, Grant PE. A methodology for analyzing curvature in the developing brain from preterm to adult. Int J Imaging Syst Technol. 2008;18:42–68. doi: 10.1002/ima.v18:1. [DOI] [PMC free article] [PubMed] [Google Scholar]
- Prayer D, Kasprian G, Krampl E, Ulm B, Witzani L, Prayer L, Brugger PC. MRI of normal fetal brain development. Eur J Radiol. 2006;57:199–216. doi: 10.1016/j.ejrad.2005.11.020. [DOI] [PubMed] [Google Scholar]
- Rados M, Judas M, Kostovic I. In vitro MRI of brain development. Eur J Radiol. 2006;57:187–198. doi: 10.1016/j.ejrad.2005.11.019. [DOI] [PubMed] [Google Scholar]
- Rakic P. Specification of cerebral cortical areas. Science. 1988;241:170–176. doi: 10.1126/science.3291116. [DOI] [PubMed] [Google Scholar]
- Rakic P, Ayoub AE, Breunig JJ, Dominguez MH. Decision by division: making cortical maps. Trends Neurosci. 2009;32:291–301. doi: 10.1016/j.tins.2009.01.007. [DOI] [PMC free article] [PubMed] [Google Scholar]
- Retzius MG. Das Menschenhirn. Studien in der makroskopischen Morphologie. Stockholm (Sweden): Norstedt & Sohne; 1896. [Google Scholar]
- Richman DP, Stewart RM, Hutchinson JW, Caviness VS. Mechanical model of brain convolutional development. Science. 1975;189:18–21. doi: 10.1126/science.1135626. [DOI] [PubMed] [Google Scholar]
- Rodriguez-Carranza CE, Mukherjee P, Vigneron D, Barkovich AJ, Studholme C. A framework for in vivo quantification of regional brain folding in premature neonates. Neuroimage. 2008;41:462–478. doi: 10.1016/j.neuroimage.2008.01.008. [DOI] [PMC free article] [PubMed] [Google Scholar]
- Ronan L, Murphy K, Delanty N, Doherty C, Maguire S, Scanlon C, Fitzsimons M. Cerebral cortical gyrification: a preliminary investigation in temporal lobe epilepsy. Epilepsia. 2007;48:211–219. doi: 10.1111/j.1528-1167.2006.00928.x. [DOI] [PubMed] [Google Scholar]
- Rousseau F, Glenn OA, Iordanova B, Rodriguez-Carranza CE, Vigneron DB, Barkovich AJ, Studholme C. Registration-based approach for reconstruction of high-resolution in utero fetal MRI brain images. Acad Radiol. 2006;13:1072–1081. doi: 10.1016/j.acra.2006.05.003. [DOI] [PubMed] [Google Scholar]
- Rutherford M, Jiang S, Allsop J, Perkins L, Srinivasan L, Hayat T, Kumar S, Hajnal J. MR imaging methods for assessing fetal brain development. Dev Neurobiol. 2008;68:700–711. doi: 10.1002/dneu.20614. [DOI] [PubMed] [Google Scholar]
- Shapleske J, Rossell SL, Woodruff PWR, David AS. The planum temporale: a systematic, quantitative review of its structural, functional and clinical significance. Brain Res Rev. 1999;29:26–49. doi: 10.1016/s0165-0173(98)00047-2. [DOI] [PubMed] [Google Scholar]
- Sowell ER, Thompson PM, Rex D, Kornsand D, Tessner KD, Jernigan TL, Toga AW. Mapping sulcal pattern asymmetry and local cortical surface gray matter distribution in vivo: maturation in perisylvian cortices. Cereb Cortex. 2002;12:17–26. doi: 10.1093/cercor/12.1.17. [DOI] [PubMed] [Google Scholar]
- Striegel DA, Hurdal MK. Chemically based mathematical model for development of cerebral cortical folding patterns. PLoS Comput Biol. 2009;5:e1000524. doi: 10.1371/journal.pcbi.1000524. [DOI] [PMC free article] [PubMed] [Google Scholar]
- Studholme C, Cardenas VA. A template free approach to volumetric spatial normalization of brain anatomy. Pattern Recogn Lett. 2004;25:1191–1202. [Google Scholar]
- Studholme C, Hill DLG, Hawkes DJ. An overlap invariant entropy measure of 3D medical image alignment. Pattern Recogn. 1999;32:71–86. [Google Scholar]
- Sun T, Patoine C, Abu-Khalil A, Visvader J, Sum E, Cherry TJ, Orkin SH, Geschwind DH, Walsh CA. Early asymmetry of gene transcription in embryonic human left and right cerebral cortex. Science. 2005;308:1794–1798. doi: 10.1126/science.1110324. [DOI] [PMC free article] [PubMed] [Google Scholar]
- Toga AW, Thompson PM. Mapping brain asymmetry. Nat Rev Neurosci. 2003;4:37–48. doi: 10.1038/nrn1009. [DOI] [PubMed] [Google Scholar]
- Toro R, Burnod Y. A morphogenetic model for the development of cortical convolutions. Cereb Cortex. 2005;15:1900–1913. doi: 10.1093/cercor/bhi068. [DOI] [PubMed] [Google Scholar]
- Van Essen DC. A tension-based theory of morphogenesis and compact wiring in the central nervous system. Nature. 1997;385:313–318. doi: 10.1038/385313a0. [DOI] [PubMed] [Google Scholar]
- Van Essen DC. A population-average, landmark- and surface-based (PALS) atlas of human cerebral cortex. Neuroimage. 2005;28:635–662. doi: 10.1016/j.neuroimage.2005.06.058. [DOI] [PubMed] [Google Scholar]
- Van Essen DC, Drury HA. Structural and functional analyses of human cerebral cortex using a surface-based atlas. J Neurosci. 1997;17:7079–7102. doi: 10.1523/JNEUROSCI.17-18-07079.1997. [DOI] [PMC free article] [PubMed] [Google Scholar]
- Wisco JJ, Kuperberg G, Manoach D, Quinn BT, Busa E, Fischl B, Heckers S, Sorensen AG. Abnormal cortical folding patterns within Broca's area in schizophrenia: evidence from structural MRI. Schizophr Res. 2007;94:317–327. doi: 10.1016/j.schres.2007.03.031. [DOI] [PMC free article] [PubMed] [Google Scholar]
- Wolosin SM, Richardson ME, Hennessey JG, Denckla MB, Mostofsky SH. Abnormal cerebral cortex structure in children with ADHD. Hum Brain Mapp. 2009;30:175–184. doi: 10.1002/hbm.20496. [DOI] [PMC free article] [PubMed] [Google Scholar]
- Woodward LJ, Anderson PJ, Austin NC, Howard K, Inder TE. Neonatal MRI to predict neurodevelopmental outcomes in preterm infants. N Engl J Med. 2006;355:685–694. doi: 10.1056/NEJMoa053792. [DOI] [PubMed] [Google Scholar]


