

Abstract
The medial superior frontal cortex (SFC), including the supplementary motor area (SMA) and presupplementary motor area (preSMA), is implicated in movement and cognitive control, among other functions central to decision making. Previous studies delineated the anatomical boundaries and functional connectivity of the SMA. However, it is unclear whether the preSMA, which responds to a variety of behavioral tasks, comprises functionally distinct areas. With 24 seed regions systematically demarcated throughout the anterior and posterior medial SFC, we examined here the functional divisions of the medial SFC on the basis of the “correlograms” of resting-state functional magnetic resonance imaging data of 225 adult individuals. In addition to replicating segregation of the SMA and posterior preSMA, the current results elucidated functional connectivities of anterior preSMA—the most anterior part of the medial SFC. In contrast to the caudal medial SFC, the anterior preSMA is connected with most of the prefrontal but not with somatomotor areas. Overall, the SMA is strongly connected to the thalamus and epithalamus, the posterior preSMA to putamen, pallidum, and subthalamic nucleus, and anterior preSMA to the caudate, with the caudate showing significant hemispheric asymmetry. These findings may provide a useful platform for future studies to investigate frontal cortical functions.
Keywords: fMRI, functional connectivity, preSMA, resting state, SMA
Introduction
The medial superior frontal cortex (SFC), including the supplementary motor area (SMA) and presupplementary motor area (preSMA) play important roles in motor and cognitive control (Picard and Strick 2001; Rushworth et al. 2004; Nachev et al. 2008). The subdivision of the SMA and preSMA has been studied extensively. Anatomically, the vertical commissure anterior line divided SMA and preSMA (Picard and Strick 1996, 2001). Directly connected to the primary motor cortex (PMC) and spinal cord, the SMA holds a complete somatotopical representation of body movements (Muakkassa and Strick 1979; Dum and Strick 1991, 1996, 2005; He et al. 1995; Maier et al. 2002; Shallice et al. 2007; Krieghoff et al. 2009; Chouinard and Paus 2010). Functional neuroimaging of humans showed that movement planning and execution robustly activated the SMA, with its anterior extent largely limited to y = 0 (Montreal Neurological Institute [MNI] coordinate).
In contrast, the preSMA does not have substantial connections with the PMC or spinal cord (Dum and Strick 1991, 2005; He et al. 1995) but is densely interconnected with the prefrontal cortex (Luppino et al. 1993; Lu et al. 1994; Wang et al. 2005). Imaging studies have suggested a role of the preSMA in a wide variety of cognitive processes, including working memory, execution of sequential movements, visuomotor association, and conflict or performance monitoring (Hikosaka et al. 1996; Deiber et al. 1998; Nakamura et al. 1998, 1999; Shima and Tanji 1998; Sakai et al. 1999; Mecklinger et al. 2000; Pollmann and von Cramon 2000; Dassonville et al. 2001; Merriam et al. 2001; Garavan et al. 2003; Kaufman et al. 2003; Isoda and Tanji 2004; Nachev et al. 2005; Wu and Hallett 2005; Ogawa et al. 2006; Fiehler et al. 2009). The reported MNI coordinates of the preSMA ranged from y = 0 to 36: preSMA responded to action errors (x = −6, y = 29, z = 39; Newman-Norlund et al. 2009); regret and rejoice during decision making (x = 6, y = 24, z = 63; Chandrasekhar et al. 2008); uncertainty during decision making (x = 1, y = 33, z = 41; Volz et al. 2004, 2005); and correct object recall (x = −3, y = 30, z = 42; Assaf et al. 2006).
On the other hand, studies suggested that the functions of the posterior and anterior parts of the preSMA are likely different. For instance, an earlier study of switching of action plans amid conflicting choices showed that the posterior (x = −4, y = 8, z = 54) and anterior (x = 2, y = 30, z = 48) preSMA were more related to volition and conflict processing, respectively (Nachev et al. 2005). Our previous studies demonstrated activation of an anterior preSMA region (x = −4, y = 36, z = 56) in individuals with better inhibitory control as indexed by shorter stop signal reaction time (Li et al. 2006; Duann et al. 2009) and activation of a caudal locale (x = −4, y = 16, z = 44 and x = 4, y = 8, z = 54) during error processing in the stop signal task (Li et al. 2008). Taken together, these findings suggested that the functions of the anterior and posterior parts of the preSMA could be further delineated.
Recent work of resting-state functional magnetic resonance imaging (fMRI) has provided a useful tool to understand the functional connectivity of the brain. It is known that low-frequency blood oxygenation level–dependent (BOLD) signal fluctuations that occur during rest reflect connectivity between functionally related brain regions (Biswal et al. 1995; Fair et al. 2007; Fox and Raichle 2007). Studies of this “spontaneous” activity described the intrinsic functional architecture of the motor, visual, auditory, default mode, memory, language, as well as dorsal and ventral attention systems (Fox and Raichle 2007). The findings that regions with similar functionality tend to be correlated in their spontaneous BOLD activity provide useful information on areal boundaries.
For instance, Margulies et al. (2007) mapped the functional subdivisions of the anterior cingulate cortex (ACC) based on regional differences in connectivity. Zhang et al. (2008, 2010) demonstrated functional subregions of the human thalamus, in accord with postmortem human histology and nonhuman primate anatomy. More recently, Kim et al. (2010) parceled the SMA and preSMA by way of regional functional connectivity to the whole brain. By limiting the anterior extent of the medial SFC to approximately a y = 20, the latter study did not include the most anterior part of the preSMA or intend to show changes in functional connectivity along with the entire anterior/posterior dimension of the medial SFC.
We sought to fill this gap by investigating the functional connectivity of the entire medial SFC using a large resting-state fMRI data set. We hypothesized that the patterns of functional connectivity would distinguish between the SMA and preSMA as well as between anterior and posterior preSMAs. Furthermore, in distinction to earlier studies (Margulies et al. 2007; Zhang et al. 2008), we described both cortical and subcortical connectivities, in the hope that this would help characterize functional subdivisions of the medial SFC.
Materials and Methods
Resting-State Data
Resting-state fMRI scans were pooled from 3 data sets (Leiden_2180/Leiden_2200, Newark, and Beijing_Zang, n = 144) downloadable from the 1000 Functional Connectomes Project (Biswal et al. 2010) and our own data (n = 81). Individual subjects' images were viewed one by one to ensure that the whole brain was covered. A total of 225 healthy subjects' resting-state data (3-T magnet; 18–53 [mean = 24] years of age; 109 men; one scan per participant; duration: 4.5–10 min; with participants closing their eyes during resting) were analyzed.
Imaging Data Preprocessing
Brain imaging data were preprocessed using Statistical Parametric Mapping (SPM8; Wellcome Department of Imaging Neuroscience, University College London, UK). Standard image preprocessing was performed. Images of each individual subject were first realigned (motion corrected) and corrected for slice timing. Structural image was normalized to an MNI epithalamus template with affine registration followed by nonlinear transformation (Friston et al. 1995; Ashburner and Friston 1999). The normalization parameters determined for the structure volume were then applied to the corresponding functional image volumes for each subject. Finally, the images were smoothed with a Gaussian kernel of 8 mm at full-width at half-maximum.
Additional preprocessing was applied to reduce spurious BOLD variances that were unlikely to reflect neuronal activity (Rombouts et al. 2003; Fox et al. 2005; Fair et al. 2007; Fox and Raichle 2007). The sources of spurious variance were removed through linear regression by including the signal from the ventricular system, the white matter, and the whole brain, in addition to the 6 parameters obtained by rigid body head motion correction. First-order derivatives of the whole brain, ventricular, and white matter signals were also included in the regression.
Cordes et al. (2001) suggested that BOLD fluctuations below a frequency of 0.1 Hz contribute to regionally specific BOLD correlations. The majority of resting-state studies low-pass filtered BOLD signal at a cutoff of 0.08 or 0.1 Hz (Fox and Raichle 2007). Thus, we applied a temporal band-pass filter (0.009 Hz < f < 0.08 Hz) to the time course in order to obtain low-frequency fluctuations (Lowe et al. 1998; Fox et al. 2005; Fair et al. 2007; Fox and Raichle 2007).
Seed Generation
To provide a systematic and detailed survey of functional connectivity of the medial SFC along the anterior/posterior dimension, we created 2 parallel arrays of overlapping spherical seeds (radius = 8 mm) throughout the medial SFC. The margin of the brain at x = 0 was first traced on the standard 152 brain MNI template of SPM8 and fitted with a quadratic function of z and y coordinates. Two parallel curves were created within the medial SFC, each 10 and 20 mm below this margin. At x = 0 mm, 12 spherical seeds were centered on each of the 2 curves from y = −12 to 32 mm, with adjacent seeds overlapping by 4 mm in radius. There were thus 12 “high”- and 12 “low”-level seeds and an area from y = −20 to 40 of the medial SFC was covered (Table 1 and Fig. 1).
Table 1.
MNI coordinates of the center of the 24 spherical seeds (radius = 8 mm).
| Seed | x | y | z | Seed | x | y | z |
| H1 | 0 | −12 | 69 | L1 | 0 | −12 | 59 |
| H2 | 0 | −8 | 68 | L2 | 0 | −8 | 58 |
| H3 | 0 | −4 | 67 | L3 | 0 | −4 | 57 |
| H4 | 0 | 0 | 66 | L4 | 0 | 0 | 56 |
| H5 | 0 | 4 | 65 | L5 | 0 | 4 | 55 |
| H6 | 0 | 8 | 64 | L6 | 0 | 8 | 54 |
| H7 | 0 | 12 | 62 | L7 | 0 | 12 | 52 |
| H8 | 0 | 16 | 61 | L8 | 0 | 16 | 51 |
| H9 | 0 | 20 | 59 | L9 | 0 | 20 | 49 |
| H10 | 0 | 24 | 57 | L10 | 0 | 24 | 47 |
| H11 | 0 | 28 | 55 | L11 | 0 | 28 | 45 |
| H12 | 0 | 32 | 53 | L12 | 0 | 32 | 43 |
Figure 1.

Placement of the 24 seeds. The medial SFC was seeded at 24 coordinates along 2 separate parallel arrays each 10 and 20 mm below the margin of the brain at x = 0 of the standard 152 brain MNI template.
Seed Region-Based Linear Correlation
The BOLD time courses were averaged spatially over each of the 24 seeds. For individual subjects, we computed the correlation coefficient between the averaged time course of each seed region and the time courses of all other brain voxels.
To assess and compare the resting-state “correlograms,” we converted these image maps, which were not normally distributed, to z score maps by Fisher's z transform (Jenkins and Watts 1968; Berry and Mielke 2000; Bond and Richardson 2004): . The z maps were used in group random effect analyses.
Functional Connectivity Based Segregation of Subregions
In order to determine the functional subdivision of the medial SFC along the y coordinate, a K-means clustering algorithm was applied to the 24 seed-region correlograms. K-means clustering is a machine learning algorithm widely used to classify a given data set into an a priori set of K clusters by minimizing an objective squared error function (MacQueen 1967; Hartigan and Wong 1979). First, a one-sample t-test was applied to the z maps across 225 subjects for each of the 24 correlograms. To account for variability in anatomical boundaries across subjects, we utilized the anatomical parceling algorithm devised by Tzourio-Mazoyer et al. (2002) to delineate 116 Automated Anatomical Labeling (AAL) anatomical masks from the MNI template. We obtained the average t value over each of the 116 anatomical templates for all 24 t maps, with the 116 mean t values constituting a vector. The 24 vectors were subject to K-means clustering. Because the K-means algorithm is sensitive to the initial randomly selected cluster centers, we repeated this algorithm 1000 times to alleviate the influence of the initial conditions.
Results
Functional Segmentation of the Medial SFC Based on Whole-Brain Correlograms
Our analyses demonstrated marked distinction in functional connectivity along the anterior/posterior dimension of the medial SFC, with the high and low seed regions showing similar connectivities (Fig. 2). Overall, the posterior part (SMA) showed significant positive correlations with the primary motor, postcentral and paracentral cortices, insula, superior/middle temporal cortices (MFCs) as well as the dorsal ACC, and negative correlations with most of the prefrontal regions, posterior cingulate cortex, and inferior parietal cortices. In contrast, the most anterior part (anterior preSMA) showed significant positive correlations with the prefrontal regions, inferior parietal cortices, temporal–parietal junction, and inferior temporal cortex and negative correlation with the precuneus, cuneus, and paracentral and postcentral cortices. Supplementary Figure 1 shows the functional connectivities of these seed regions with the 116 AAL masks of the whole brain (Tzourio-Mazoyer et al. 2002).
Figure 2.

Group results of voxelwise functional connectivity of the medial SFC, as defined by each of the 24 high (H)- and low (L)-level seeds. The H4/L4 seeds are centered at y = 0. Positive (warm color) and negative (cold color) correlations were superimposed on 9 axial slices (Z = −15, −5, 5, 15, 25, 35, 45, 55, 65 mm) of a structural image. n = 225, P < 0.05, corrected for familywise error (FWE) of multiple comparisons.
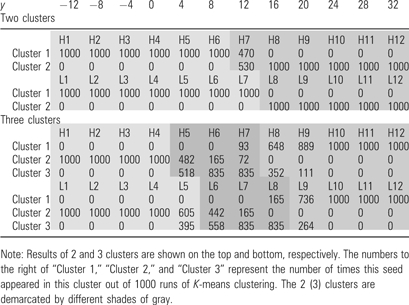
It is difficult to distinguish subregions simply by visually inspecting the pattern of connectivities. We thus explored potential subdivisions of the medial SFC using K-means clustering as described in the Materials and Methods. Table 2 summarizes how the 24 medial SFC seeds were clustered on the basis of their connectivities with the 116 AAL masks. For K = 3 clustering, the medial SFC was separated into 3 subregions along y that corresponded to SMA, posterior preSMA, and anterior preSMA (high-level seeds: [y = −12 to 0] for SMA, [4–12] for posterior preSMA, and [16–32] for anterior preSMA; low-level seeds: [–12 to 4] for SMA, [8–16] for posterior preSMA, and [20–32] for anterior preSMA). These 3 functional clusters—SMA, posterior preSMA, and anterior preSMA—formed the basis of detailed connectivity analyses described below. When grouped into 2 clusters (K = 2), the medial SFC was divided into SMA/posterior preSMA ([y = −12 to 8] for high-level seeds and [−12 to 12] for low-level seeds) and anterior preSMA ([y = 12–32] for high-level seeds and [16–32] for low-level seeds).
Table 2.
K-means clusters of 24 medial SFC seeds
 |
Functional Connectivity with Paracentral through Prefrontal Regions
Functional connectivity varied between the anterior and posterior parts of the medial SFC. To illustrate this difference in connectivity with individual cortical regions, we computed the average z scores of each seed for 9 prefrontal regions as well as somatomotor areas including the SMA, PMC, postcentral gyrus, and paracentral gyrus, based on the AAL atlas (Tzourio-Mazoyer et al. 2002; Figs 3a and 4a). We conducted analyses of variance (ANOVAs) with 2 factors: area (SMA, posterior preSMA, and anterior preSMA) and the laterality of mask (left- and right-hemispheric) across all subjects. For each subject, z scores were averaged across all voxels each within the SMA, posterior preSMA, and anterior preSMA cluster for individual subjects. The patterns of connectivity were significantly different between the 3 clusters (Table 3). To better represent these differences, Figures 3b and 4b showed mean correlation z scores for the 9 prefrontal regions and 4 somatomotor areas.
Figure 3.

(a) Correlation z (mean ± standard error; n = 225) scores between each seed region and 9 prefrontal masks (frontal sup: superior frontal gyrus; front sup med: medial superior frontal gyrus; frontal orb mid: middle part of orbital frontal gyrus; frontal mid: middle frontal gyrus; frontal orb lat: lateral part of orbital frontal gyrus; frontal orb med: medial part of orbital frontal gyrus; frontal inf oper: opercular part of IFG; frontal inf tri: triangular part of IFG; frontal inf orb: orbital part of IFG). The x-axis represents the y coordinate of the center of each seed. Correlations are shown in red and blue, respectively, for right- and left-hemispheric seeds, with solid and dashed lines indicating high- and low-level seeds. (b) Correlation z scores averaged across seed regions comprising SMA, posterior preSMA (pPreSMA), and anterior preSMA (aPreSMA). The results are shown separately for left- and right-hemispheric masks if differences exist (ANOVA, Table 2). Correlation z scores that were significant different from zero were highlighted with **P < 0.0001, uncorrected (for details, see Supplementary Table 1).
Figure 4.

(a) Correlation z scores (mean ± standard error) between each seed region and 4 somatomotor areas (SMA and PMC). The x-axis represents the y coordinate of the center of each seed. Correlations between each seed region and left- and right-hemispheric masks are shown in red and blue, respectively, with solid and dashed lines indicating high- and low-level seeds. (b) Correlation z scores averaged across seed regions comprising SMA, posterior preSMA (pPreSMA), and anterior preSMA (aPreSMA). The results are shown separately for left- and right-hemispheric masks if differences exist (ANOVA, Table 2). Correlation z scores that were significant different from zero were highlighted with *P < 0.0006 (P < 0.05, corrected for multiple comparisons) and **P < 0.0001, uncorrected (for details, see Supplementary Table 1).
Table 3.
(a) P values of the ANOVA testing differences in connectivity between the SMA, posterior preSMA, and anterior preSMA (main effect), between left- and right-hemispheric masks (main effect), and their interaction effect. (b) P values of the ANOVA testing differences in connectivity between the SMA, posterior preSMA, and anterior preSMA and the clusters of each subcortical areas
| (a) | Three clusters | L versus R | Interaction | (b) | Three clusters |
| Prefrontal regions | Thalamus | ||||
| Frontal sup | <0.0001 | 0.0027 | <0.0001 | Dorsal medial | 0.5655 |
| Frontal orb mid | <0.0001 | 0.8046 | 0.4316 | Anterior | <0.0001 |
| Frontal mid | <0.0001 | 0.2904 | <0.0001 | Posterior middle | <0.0001 |
| Frontal orb lat | <0.0001 | 0.1552 | 0.0153 | Posterior | <0.0001 |
| Frontal inf oper | <0.0001 | 0.0021 | 0.0017 | Anterior middle | <0.0001 |
| Frontal inf tri | <0.0001 | <0.0001 | 0.0003 | Caudate | |
| Frontal inf orb | <0.0001 | 0.0906 | 0.0402 | Ventral posterior | <0.0001 |
| Frontal sup med | <0.0001 | <0.0001 | <0.0001 | Ventral anterior | 0.4154 |
| Frontal orb med | <0.0001 | 0.3187 | 0.0485 | Dorsal middle | <0.0001 |
| Somatomotor regions | Putamen | ||||
| PMC | <0.0001 | 0.0571 | <0.0001 | Anterior | <0.0001 |
| SMA | <0.0001 | <0.0001 | <0.0001 | Middle | <0.0001 |
| Postcentral | <0.0001 | <0.0001 | 0.0131 | Posterior | <0.0001 |
| Paracentral | <0.0001 | <0.0001 | <0.0001 | Pallidum | |
| Subcortical regions | Lateral anterior | <0.0001 | |||
| Caudate | <0.0001 | 0.0002 | <0.0001 | Lateral posterior | <0.0001 |
| Putamen | <0.0001 | 0.0404 | <0.0001 | Medial | <0.0001 |
| Pallidum | <0.0001 | 0.0619 | 0.7518 | Insula | |
| Thalamus | <0.0001 | 0.0060 | <0.0001 | Posterior | <0.0001 |
| Epithalamus | <0.0001 | 0.6064 | 0.4788 | Ventral anterior | <0.0001 |
| STN | 0.0001 | 0.8668 | 0.7582 | Dorsal anterior | <0.0001 |
| Insula | <0.0001 | 0.1578 | <0.0001 | ||
Note: frontal sup: superior frontal gyrus; frontal orb mid: middle part of orbital frontal gyrus; frontal mid: middle frontal gyrus; frontal orb lat: lateral part of orbital frontal gyrus; frontal inf oper: opercular part of IFG; frontal inf tri: triangular part of IFG; frontal inf orb: orbital part of IFG; frontal sup med: medial superior frontal gyrus; frontal orb med: medial part of orbital frontal gyrus; postcentral: postcentral cortex; paracentral: paracentral cortex. Thalamus clustering (see Fig. 6a): dorsal medial (blue); anterior (green); posterior middle (yellow); posterior (gold); and anterior middle (red). Caudate clustering (see Fig. 6b): ventral posterior (green); dorsal middle (red); and ventral anterior (gold). Putamen clustering (see Fig. 6c): ventral anterior (green); dorsal anterior (gold); and posterior (gold). Pallidum clustering (see Fig. 6d): lateral anterior (green); lateral posterior (gold); and medial (red). Insula clustering (see Fig. 7a): posterior (green); ventral anterior (gold); and dorsal anterior (red).
Except for the opercular part of inferior frontal gyrus (IFG), the prefrontal subregions showed connectivity increasing along with y coordinate in the medial SFC (Fig. 3a). High-level seeds showed higher correlation than low-level seeds with the middle and medial parts of orbital frontal cortex (all P < 0.0001, uncorrected repeated measure ANOVA). In contrast, low-level seeds showed higher correlation than high-level seeds with the IFG (all P < 0.0001, uncorrected). The SMA cluster showed significant negative connectivity with the superior, middle, and orbital frontal gyri but positive connectivity with the opercular and orbital parts of the IFG (Fig. 3b). The posterior preSMA showed significant negative connectivity with the middle and medial parts of the orbital frontal gyri but positive connectivity with the superior, middle, and inferior frontal cortices (Fig. 3b). The anterior preSMA is positively connected to prefrontal regions except the middle and medial orbital frontal gyri (Fig. 3b).
Both the SMA and the posterior preSMA clusters showed significant positive connectivity with the SMA, PMC, postcentral gyrus, and paracentral gyrus (Fig. 4a,b). The anterior preSMA is negatively connected with the paracentral and postcentral gyri (Fig. 4b).
Functional Connectivity with Subcortical Regions
We examined connectivity of the medial SFC with subcortical structures, including the thalamus, caudate, pallidum (internal and external segments combined), putamen, and subthalamic nucleus (STN), based on the AAL templates and the epithalamus (x = ±1, y = −25, z = 1, sphere with a radius of 4 mm), based on our previous work (Ide and Li 2011; Fig. 5 and Table 3).
Figure 5.

(a) Correlation z scores (mean ± standard error) between each seed region and subcortical areas. The x-axis represents the y coordinate of the center of each seed. Correlations between each seed region and left- and right-hemispheric masks are shown in red and blue, respectively, with solid and dashed lines indicating high- and low-level seeds. (b) Correlation z scores averaged across seed regions comprising SMA, posterior preSMA (pPreSMA), and anterior preSMA (aPreSMA). The results are shown separately for left- and right-hemispheric masks if differences exist (ANOVA, Table 2). Correlation z scores that were significant different from zero were highlighted with *P < 0.0006 (P < 0.05, corrected for multiple comparisons) and **P < 0.0001, uncorrected (for details, see Supplementary Table 1).
The thalamus showed significant connectivity with the SMA and posterior preSMA (low level) but not anterior preSMA. Except for the right caudate and SMA, the caudate nuclei showed significant positive connectivity with all 3 clusters, with connectivity increasing with the y coordinate of the seed regions. The pallidum showed positive correlations with both preSMAs but not with SMA. Putamen showed highest positive correlation with posterior preSMA and decreased correlation with the SMA or anterior preSMA. And the STN showed positive correlation with both preSMAs but not with SMA. The epithalamus showed a pattern of connectivity with the medial SFC similar to the thalamus.
The thalamus, caudate, putamen, and pallidum are known to have functional subdivisions (Herrero et al. 2002; Lehericy, Ducros, Krainik, et al. 2004; Lehericy, Ducros, Van de Moortele, et al. 2004; Leh et al. 2007; Draganski et al. 2008; Zhang et al. 2008, 2010). We thus applied K-means clustering to the connectivity with the 24 medial SFC seeds to examine how subregions might form each within these subcortical structures. The potential number of subregions was specified following the literature: thalamus = 5 (Zhang et al. 2008, 2010); caudate = 3 (Draganski et al. 2008); putamen = 3 (Lehericy, Ducros, Krainik, et al. 2004; Leh et al. 2007); pallidum = 3 (Draganski et al. 2008). A one-sample t-test was applied to the “z maps” across 225 subjects for each of the 24 correlograms. All voxels within each subcortical region were clustered into subgroups by a 24-dimension feature vector, comprising t values of the 24 t maps, with the K-means algorithm repeated 1000 times (Fig. 6 and Table 3).
Figure 6.

Clustering results of subcortical regions and corresponding z scores (mean ± standard error) between each medial SFC seed region and subcortical clusters. Correlations are represented as error bar across all 225 subjects. The y-axis represents the coordinate of the center of each seed. Solid and dashed line each indicates correlation for high- and low-level seeds. Clusters are distinguished by color (a) thalamus (dorsal medial: blue; anterior: green; posterior middle: yellow; posterior: gold; and anterior middle: red); (b) caudate (ventral posterior: green; dorsal middle: red; and ventral anterior: gold); (c) putamen (ventral anterior: green; dorsal anterior: red; and posterior: red); and (d) pallidum (lateral anterior: green; lateral posterior: gold; and medial: red).
For the thalamus, the posterior and anterior/posterior middle clusters (gold and red/yellow color) decreased connectivity, while the anterior cluster (green) increased connectivity with increasing y coordinate of the medial SFC. The dorsal medial cluster (blue) did not show significant changes in connectivity with y coordinate of the medial SFC.
In the basal ganglia, the anterior cluster of the caudate (gold) showed similar connectivity throughout the anterior–posterior extent of the medial SFC. The other 2 clusters (red and green) increased connectivity with the increasing y of the medial SFC. In the putamen, the posterior, middle, and anterior clusters (red, gold, and green) each showed greater connectivity with the posterior, middle, and anterior regions of the medial SFC. In the pallidum, we also identified 3 subregions with a distinct topography of connectivity along the anterior–posterior extent of the medial SFC. The posterior, anterior, and medial clusters (gold, green, and red) each showed greater connectivity with posterior, middle, and anterior regions of the medial SFC.
Functional Connectivity with the Insula
We also examined the connectivity between the medial SFC and insula, which is implicated in many psychological processes such as emotion, somatomotor integration, and cognitive control (Naqvi and Bechara 2009; Taylor et al. 2009; Menon and Uddin 2010; Nelson et al. 2010). The insula was positively connected to the entire medial SFC with the strength of connectivity decreasing with increasing y (Fig. 7a,b). In K-means clustering, the insula was separated into 3 subregions, with the posterior, dorsal, and ventral anterior parts each connected with the SMA, posterior preSMA, and anterior preSMA (Fig. 7c).
Figure 7.

Correlation and clustering results of the insula. (a) Correlation z scores between each seed region and the insula. The x-axis represents the y coordinate of the center of each seed. Correlations between each seed region and left- and right-hemispheric masks are shown in red and blue, respectively, with solid and dashed lines indicating high- and low-level seeds. (b) Histograms with error bars of averaged correlation z scores (mean ± standard error) each between SMA, posterior preSMA (pPreSMA), anterior preSMA (aPreSMA) clusters and the insula. Correlation z scores that were significant different from zero were highlighted here with **P < 0.0001, uncorrected, and detailed values can be found in Supplementary Table 1. (c) Clustering results of subcortical regions and corresponding z scores (mean ± standard error) between each medial SFC seed region and insula clusters. Correlations are represented as error bar across all 225 subjects. The y-axis represents the coordinate of the center of each seed. Solid and dashed line each indicates correlation for high- and low-level seeds. Three clusters were represented and different colors demonstrate different clusters for each subcortical region as posterior (green), ventral anterior (gold), and dorsal anterior (red).
Discussion
We presented resting-state functional connectivity maps of the medial SFC. Our findings showed that, on the basis of the pattern of functional connectivity, the medial SFC could be separated into the SMA, posterior preSMA, and anterior preSMA. These functional subregions have distinct connectivity with cortical and subcortical structures. We summarize the pattern of connectivities in Figure 8.
Figure 8.

A summary of functional connectivity of the SMA (red), posterior preSMA (pPreSMA. blue), and anterior preSMA (aPreSMA, green), with gold indicating connectivity with all 3 regions. Positive and negative connectivities are each indicated by solid and dashed line. Abbreviations: frontal sup: superior frontal gyrus; front sup med: medial superior frontal gyrus; frontal orb mid: middle part of orbital frontal gyrus; frontal mid: middle frontal gyrus; frontal orb lat: lateral part of orbital frontal gyrus; frontal orb med: medial part of orbital frontal gyrus; frontal inf oper: opercular part of IFG; frontal inf tri: triangular part of IFG; frontal inf orb: orbital part of IFG; postcentral: postcentral cortex; paracentral: paracentral cortex; EPI: epithalamus.
Functional Subdivisions of the Medial SFC
The current findings confirmed functional differences between SMA and preSMA, replicating previous anatomical and functional studies (Picard and Strick 1996, 2001; Nachev et al. 2008; Kim et al. 2010). Connecting with the somatomotor cortices and the posterolateral part of the putamen, the SMA is closely associated with motor control (Santosh et al. 1995; Tanji 1996; Van Oostende et al. 1997; Chainay et al. 2004; Macar et al. 2004; Nachev et al. 2008). In contrast, the preSMA has been implicated in working memory (Mecklinger et al. 2000; Pollmann and von Cramon 2000), control of sequential movement (Hikosaka et al. 1996; Deiber et al. 1998; Nakamura et al. 1998, 1999; Shima and Tanji 1998; Isoda and Tanji 2004; Wu and Hallett 2005; Ogawa et al. 2006; Fiehler et al. 2009), conflict monitoring (Garavan et al. 2003; Kaufman et al. 2003; Nachev et al. 2005), and visuomotor association (Sakai et al. 1999; Dassonville et al. 2001; Merriam et al. 2001), consistent with its increasing connectivity with prefrontal cortical structures.
This contrast between motor and cognitive control is also evident in the pattern of connectivities with the opercular part of the IFG. The opercular part of the IFG, comprising the Broca's area and responding to finger movements, grasping actions, observation, and preparation of action as well as imitation (Iacoboni et al. 1999; Buccino et al. 2001; Koski et al. 2002; Johnson-Frey et al. 2003; Molnar-Szakacs et al. 2005), showed significant positive connectivity throughout the entire medial SFC and stronger connectivity with the posterior than anterior preSMA. Furthermore, it is only with this prefrontal region that the high and low medial SFC seeds demonstrated distinguishable functional connectivity. The significance of this latter finding deserves more investigation.
Our findings showed that the SMA and preSMA were segregated at approximately the vertical commissure anterior line (y ≈ 0), in accord with earlier studies (Picard and Strick 1996, 2001; Nachev et al. 2008). Notably, the boundary separating the SMA and preSMA was more anterior for low (y = 4–8) than high (y = 0–4) medial SFC. Similar findings were reported by a recent resting-state fMRI study, in which the authors clustered all voxels within the SMA/posterior SMA (Kim et al. 2010).
Our findings also suggested functional distinction between the posterior and anterior preSMA, with the 2 areas separated at a y = 12–16 and 16–20 for high and low medial SFC, respectively. Earlier imaging studies distinguished the anterior from posterior preSMA in cognitive operations. Reviewing 38 fMRI studies of preresponse conflict, decision uncertainty, response errors, and negative feedback, Ridderinkhof et al. (2004) showed that the anterior and posterior preSMA is each more associated with decision uncertainty and response error. Another review of studies on voluntary action suggested that the posterior preSMA contributes to open decisions between alternative actions, while the anterior preSMA mediates decisions related to inhibiting voluntary action and predictive monitoring (Haggard 2008). Our previous work of the stop signal task showed that the anterior preSMA was involved in inhibitory control, while the posterior preSMA and SMA responded to error detection (Li et al. 2006, 2008). The latter findings are consistent with our “2 clusters” results with the posterior preSMA and SMA segregated together in distinction to the anterior preSMA.
Besides 2- and 3-cluster distinctions, we further described the results of 4- and 5-cluster solutions as shown in Supplementary Table 2. Compared with the 3-cluster solution, the 4-cluster solution showed an additional cluster (cluster 4) for the low-level seeds (L8 and L9). And compared with the 4-cluster solution, the 5-cluster solution merely served to separate H7 from cluster 1. Overall, these patterns are very similar to the 3-cluster solution. In particular, the boundary between SMA and posterior preSMA (H4–H5 and L5–L6) remained unchanged across these solution metrics. Furthermore, Figures 3–7 plotted the cortical and subcortical connectivities for all of the medial cortical seeds; by inspecting the pattern of connectivities, we feel confident that the seeds comprising these additional clusters are most likely in functional continuum with their neighboring seed regions.
Subcortical Connectivity of the Medial SFC
By interconnecting with cortical structures, the thalamus and basal ganglia play an important role in motor and cognitive control. These corticosubcortical pathways appeared to be functionally segregated (Alexander et al. 1986). For instance, both fMRI and diffusion tensor imaging (DTI) studies showed that the SMA is mainly connected to the putamen, while the preSMA projects to the caudate nucleus (Takada et al. 1998; Ferrandez et al. 2003; Johansen-Berg et al. 2004; Lehericy, Ducros, Krainik, et al. 2004; Lehericy, Ducros, Van de Moortele, et al. 2004; Leh et al. 2007; Draganski et al. 2008; Barnes et al. 2010). More specifically, DTI showed that the posterior putamen was more connected to the SMA than preSMA, while the middle putamen was more connected to the preSMA than SMA (Lehericy, Ducros, Krainik, et al. 2004; Lehericy, Ducros, Van de Moortele, et al. 2004). These investigators found no significant connections to SMA or preSMA for the anterior part of the putamen. A similar observation was made in a probabilistic diffusion tractography study of connections between the SMA and posterior putamen, between the preSMA and middle putamen, and between primary motor areas to the lateral putamen (Leh et al. 2007). Here, we confirmed these findings (Fig. 6).
The thalamus plays an important role relaying and integrating sensory and motor signals between the cortex and other subcortical structures. The thalamus is primarily associated with the SMA and the posterior preSMA (Wiesendanger and Wiesendanger 1985; Geyer et al. 2000; Nachev et al. 2008). The different subregions of the thalamus have different interconnections with the cerebral cortex (Wiesendanger and Wiesendanger 1985; Herrero et al. 2002; Zhang et al. 2008, 2010). We observed that the anterior part of the thalamus was connected with the anterior preSMA and the middle part was connected with the SMA and posterior preSMA, consistent with earlier observations (Zhang et al. 2010). On the other hand, we showed a negative connectivity between the posterior part of the thalamus and the anterior preSMA, in contrast to Zhang et al. (2010). The posterior part of the thalamus has reciprocal connections with the temporal–parietal–occipital visual areas (Herrero et al. 2002). Consistently, our findings also showed negative connectivity between the anterior preSMA and these visual cortical structures.
Connectivity of the Medial SFC with the Insula
Earlier studies suggested that the insula could be divided into a larger anterior and a smaller posterior part, on the basis of cytoarchitectonic features as well as anatomical and functional connectivity (Chikama et al. 1997; Naqvi and Bechara 2009; Nelson et al. 2010). The posterior insula, which receives inputs from the thalamus, was implicated in somatosensory and motor integration. The anterior insula, which have connections with the ACC, medial prefrontal cortex, amygdala, and ventral striatum, was involved in emotional and motivational control. These regional differences have also been highlighted by recent fMRI studies. For instance, the posterior insula was involved in multisensory integration (Naghavi et al. 2007) and pain perception (Henderson et al. 2007, 2011; Nash et al. 2009). On the other hand, the dorsal and ventral anterior insula appeared to be involved in complex feeling such as disgust (Wicker et al. 2003, 2004). Furthermore, the dorsal anterior insula responded to value framing during decision making (Krawitz et al. 2010), risk taking (Xue et al. 2010) as well as risk prediction (Preuschoff et al. 2008), and self-reflection (Modinos et al. 2009). Our findings that the posterior and anterior parts of the insula are each connected to the SMA and preSMA support functional distinction of these pathways (Nanetti et al. 2009).
Methodological Considerations: The Effects of Global Signal Regression
Recent studies suggested that the global signal regression, a common data-preprocessing step in seed region based functional connectivity analyses, is most likely the cause of anticorrelation functional networks (Murphy et al. 2009; Weissenbacher et al. 2009). On the other hand, it has also been demonstrated that the multiple characteristics of anticorrelation networks, which include cross-subject consistency, spatial distribution, as well as presence with modified whole-brain masks and before global signal regression, are not determined by global regression (Fox et al. 2009). To examine this issue, we repeated the same analysis only without the global signal regression on the current data set. The results showed a very similar pattern of functional connectivity as in the analyses with global signal regression (Supplementary Fig. 2).
Limitations of the Study
One limitation concerns data reduction for k-means clustering. We utilized 116 AAL masks instead of all voxels to characterize functional connectivity. Advantages of this approach include reducing computational complexity as well as accounting for variability in anatomical boundaries across subjects. On the other hand, we cannot rule out the possibility that voxels within individual masks might contribute differently to the patterns of connectivity.
Another potential limitation is that all seed regions were placed at x = 0. Thus, differences in functional connectivity along the lateral extents of the MFC remain to be explored in the future and, in particular, when specific hypotheses are to be tested.
We used large overlapping seeds (radius = 8 mm), as compared with a previous study (Margulies et al. 2007), and smoothed our data with an 8-mm Gaussian kernel. These parameters may not be ideal for delineating subcortical connectivity. We discuss this issue from several perspectives. First, we used large seed regions in order to include as much areal information as possible, particularly in the x dimension where the boundary of medial SFC is between x = −10 to 10 mm (MNI coordinate). Using a smaller seed will likely miss out on these lateral dimensions of the frontal cortex. Second, we applied a moving spatial window of 4 mm, which would allow us to capture changes smaller than the seed radius of 8 mm. By doing this, we wish to represent a detailed functional connectivity changes map along the y coordinate. Third, although using a small Gaussian kernel for spatial smoothing would be more appropriate for delineating subcortical connectivity, this may not be true of cortical connectivity. Since the functional connectivity is described on the basis of whole-brain connectivities, there invariably would be a trade-off in deciding on what kernel to use for smoothing. Nevertheless, we reran all the analyses using the data smoothed with a 4-mm Gaussian kernel and those seeds with 4-mm radius. In our assessment, other than the fact that the pattern of subcortical connectivities was not as smooth as those obtained with 8-mm kernel, the main results were almost identical (Supplementary Figs 3–8 and Supplementary Tables 3–4). The results we described and discussed in the manuscript were equally valid on the basis of this new set of data.
Finally, one potential issue of these analyses would be the localization of some of the subcortical areas (e.g., the STN). Because of their small size and hence intersubject variability, it would be much harder to obtain significant patterns of functional connectivity across a population of subjects. However, we were able to observe a significant pattern of change for all of the subcortical structures in their medial SFC connectivity and, based on the connectivity patterns, identify functional clusters with the nuclei.
Conclusions
In this study, we investigated the functional subdivisions of the medial SFC on the basis of whole-brain connectivity characterized from a large resting-state fMRI data set. Other than replicating the boundaries between SMA and preSMA, the current results support a functional difference between the posterior and anterior preSMA. In contrast to the posterior preSMA, the anterior preSMA is connected with most of the prefrontal but not somatomotor areas. Overall, the SMA is strongly connected to the thalamus and epithalamus, the posterior preSMA to putamen, pallidum, and STN and anterior preSMA to the caudate, with the caudate showing significant hemispheric asymmetry. Furthermore, medial SFC connectivities described functional subregions within each subcortical structure, in accord with anatomical literature.
Supplementary Material
Supplementary material can be found at: http://www.cercor.oxfordjournals.org/
Funding
National Institutes of Health (NIH) grants R01DA023248, K02DA026990, R21AA018004. The NIH had no further role in study design; in the collection, analysis and interpretation of data; in the writing of the report; or in the decision to submit the paper for publication.
Supplementary Material
Acknowledgments
We thank investigators of the 1000 Functional Connectomes Project and those who shared the data set for making this study possible. Conflict of Interest: None declared.
References
- Alexander GE, DeLong MR, Strick PL. Parallel organization of functionally segregated circuits linking basal ganglia and cortex. Annu Rev Neurosci. 1986;9:357–381. doi: 10.1146/annurev.ne.09.030186.002041. [DOI] [PubMed] [Google Scholar]
- Ashburner J, Friston KJ. Nonlinear spatial normalization using basis functions. Hum Brain Mapp. 1999;7:254–266. doi: 10.1002/(SICI)1097-0193(1999)7:4<254::AID-HBM4>3.0.CO;2-G. [DOI] [PMC free article] [PubMed] [Google Scholar]
- Assaf M, Calhoun VD, Kuzu CH, Kraut MA, Rivkin PR, Hart J, Jr, Pearlson GD. Neural correlates of the object-recall process in semantic memory. Psychiatry Res. 2006;147:115–126. doi: 10.1016/j.pscychresns.2006.01.002. [DOI] [PubMed] [Google Scholar]
- Barnes KA, Cohen AL, Power JD, Nelson SM, Dosenbach YB, Miezin FM, Petersen SE, Schlaggar BL. Identifying basal ganglia divisions in individuals using resting-state functional connectivity MRI. Front Syst Neurosci. 2010;4:18. doi: 10.3389/fnsys.2010.00018. [DOI] [PMC free article] [PubMed] [Google Scholar]
- Berry KJ, Mielke PW., Jr A Monte Carlo investigation of the Fisher Z transformation for normal and nonnormal distributions. Psychol Rep. 2000;87:1101–1114. doi: 10.2466/pr0.2000.87.3f.1101. [DOI] [PubMed] [Google Scholar]
- Biswal B, Yetkin FZ, Haughton VM, Hyde JS. Functional connectivity in the motor cortex of resting human brain using echo-planar MRI. Magn Reson Med. 1995;34:537–541. doi: 10.1002/mrm.1910340409. [DOI] [PubMed] [Google Scholar]
- Biswal BB, Mennes M, Zuo XN, Gohel S, Kelly C, Smith SM, Beckmann CF, Adelstein JS, Buckner RL, Colcombe S, et al. Toward discovery science of human brain function. Proc Natl Acad Sci U S A. 2010;107:4734–4739. doi: 10.1073/pnas.0911855107. [DOI] [PMC free article] [PubMed] [Google Scholar]
- Bond CF, Richardson K. Seeing the Fisher Z-transformation. Psychometrika. 2004;69(2):291–303. [Google Scholar]
- Buccino G, Binkofski F, Fink GR, Fadiga L, Fogassi L, Gallese V, Seitz RJ, Zilles K, Rizzolatti G, Freund HJ. Action observation activates premotor and parietal areas in a somatotopic manner: an fMRI study. Eur J Neurosci. 2001;13:400–404. [PubMed] [Google Scholar]
- Chainay H, Krainik A, Tanguy ML, Gerardin E, Le Bihan D, Lehericy S. Foot, face and hand representation in the human supplementary motor area. Neuroreport. 2004;15:765–769. doi: 10.1097/00001756-200404090-00005. [DOI] [PubMed] [Google Scholar]
- Chandrasekhar PV, Capra CM, Moore S, Noussair C, Berns GS. Neurobiological regret and rejoice functions for aversive outcomes. Neuroimage. 2008;39:1472–1484. doi: 10.1016/j.neuroimage.2007.10.027. [DOI] [PMC free article] [PubMed] [Google Scholar]
- Chikama M, McFarland NR, Amaral DG, Haber SN. Insular cortical projections to functional regions of the striatum correlate with cortical cytoarchitectonic organization in the primate. J Neurosci. 1997;17:9686–9705. doi: 10.1523/JNEUROSCI.17-24-09686.1997. [DOI] [PMC free article] [PubMed] [Google Scholar]
- Chouinard PA, Paus T. What have We Learned from “Perturbing” the Human Cortical Motor System with Transcranial Magnetic Stimulation? Front Hum Neurosci. 2010;4:173. doi: 10.3389/fnhum.2010.00173. [DOI] [PMC free article] [PubMed] [Google Scholar]
- Cordes D, Haughton VM, Arfanakis K, Carew JD, Turski PA, Moritz CH, Quigley MA, Meyerand ME. Frequencies contributing to functional connectivity in the cerebral cortex in “resting-state” data. AJNR Am J Neuroradiol. 2001;22:1326–1333. [PMC free article] [PubMed] [Google Scholar]
- Dassonville P, Lewis SM, Zhu XH, Ugurbil K, Kim SG, Ashe J. The effect of stimulus-response compatibility on cortical motor activation. Neuroimage. 2001;13:1–14. doi: 10.1006/nimg.2000.0671. [DOI] [PubMed] [Google Scholar]
- Deiber MP, Ibanez V, Honda M, Sadato N, Raman R, Hallett M. Cerebral processes related to visuomotor imagery and generation of simple finger movements studied with positron emission tomography. Neuroimage. 1998;7:73–85. doi: 10.1006/nimg.1997.0314. [DOI] [PubMed] [Google Scholar]
- Draganski B, Kherif F, Kloppel S, Cook PA, Alexander DC, Parker GJ, Deichmann R, Ashburner J, Frackowiak RS. Evidence for segregated and integrative connectivity patterns in the human basal ganglia. J Neurosci. 2008;28:7143–7152. doi: 10.1523/JNEUROSCI.1486-08.2008. [DOI] [PMC free article] [PubMed] [Google Scholar]
- Duann JR, Ide JS, Luo X, Li CS. Functional connectivity delineates distinct roles of the inferior frontal cortex and presupplementary motor area in stop signal inhibition. J Neurosci. 2009;29:10171–10179. doi: 10.1523/JNEUROSCI.1300-09.2009. [DOI] [PMC free article] [PubMed] [Google Scholar]
- Dum RP, Strick PL. The origin of corticospinal projections from the premotor areas in the frontal lobe. J Neurosci. 1991;11:667–689. doi: 10.1523/JNEUROSCI.11-03-00667.1991. [DOI] [PMC free article] [PubMed] [Google Scholar]
- Dum RP, Strick PL. Spinal cord terminations of the medial wall motor areas in macaque monkeys. J Neurosci. 1996;16:6513–6525. doi: 10.1523/JNEUROSCI.16-20-06513.1996. [DOI] [PMC free article] [PubMed] [Google Scholar]
- Dum RP, Strick PL. Frontal lobe inputs to the digit representations of the motor areas on the lateral surface of the hemisphere. J Neurosci. 2005;25:1375–1386. doi: 10.1523/JNEUROSCI.3902-04.2005. [DOI] [PMC free article] [PubMed] [Google Scholar]
- Fair DA, Schlaggar BL, Cohen AL, Miezin FM, Dosenbach NU, Wenger KK, Fox MD, Snyder AZ, Raichle ME, Petersen SE. A method for using blocked and event-related fMRI data to study “resting state” functional connectivity. Neuroimage. 2007;35:396–405. doi: 10.1016/j.neuroimage.2006.11.051. [DOI] [PMC free article] [PubMed] [Google Scholar]
- Ferrandez AM, Hugueville L, Lehericy S, Poline JB, Marsault C, Pouthas V. Basal ganglia and supplementary motor area subtend duration perception: an fMRI study. Neuroimage. 2003;19:1532–1544. doi: 10.1016/s1053-8119(03)00159-9. [DOI] [PubMed] [Google Scholar]
- Fiehler K, Burke M, Bien S, Roder B, Rosler F. The human dorsal action control system develops in the absence of vision. Cereb Cortex. 2009;19:1–12. doi: 10.1093/cercor/bhn067. [DOI] [PubMed] [Google Scholar]
- Fox MD, Raichle ME. Spontaneous fluctuations in brain activity observed with functional magnetic resonance imaging. Nat Rev Neurosci. 2007;8:700–711. doi: 10.1038/nrn2201. [DOI] [PubMed] [Google Scholar]
- Fox MD, Snyder AZ, Vincent JL, Corbetta M, Van Essen DC, Raichle ME. The human brain is intrinsically organized into dynamic, anticorrelated functional networks. Proc Natl Acad Sci U S A. 2005;102:9673–9678. doi: 10.1073/pnas.0504136102. [DOI] [PMC free article] [PubMed] [Google Scholar]
- Fox MD, Zhang D, Snyder AZ, Raichle ME. The global signal and observed anticorrelated resting state brain networks. J Neurophysiol. 2009;101:3270–3283. doi: 10.1152/jn.90777.2008. [DOI] [PMC free article] [PubMed] [Google Scholar]
- Friston K, Ashburner J, Frith C, Polone J, Heather J, Frackowiak R. Spatial registration and normalization of images. Hum Brain Mapp. 1995;2:165–189. [Google Scholar]
- Garavan H, Ross TJ, Kaufman J, Stein EA. A midline dissociation between error-processing and response-conflict monitoring. Neuroimage. 2003;20:1132–1139. doi: 10.1016/S1053-8119(03)00334-3. [DOI] [PubMed] [Google Scholar]
- Geyer S, Matelli M, Luppino G, Zilles K. Functional neuroanatomy of the primate isocortical motor system. Anat Embryol (Berl) 2000;202:443–474. doi: 10.1007/s004290000127. [DOI] [PubMed] [Google Scholar]
- Haggard P. Human volition: towards a neuroscience of will. Nat Rev Neurosci. 2008;9:934–946. doi: 10.1038/nrn2497. [DOI] [PubMed] [Google Scholar]
- Hartigan JA, Wong MA. A K-means clustering algorithm. Appl Stat. 1979;28(1):100–108. [Google Scholar]
- He SQ, Dum RP, Strick PL. Topographic organization of corticospinal projections from the frontal lobe: motor areas on the medial surface of the hemisphere. J Neurosci. 1995;15:3284–3306. doi: 10.1523/JNEUROSCI.15-05-03284.1995. [DOI] [PMC free article] [PubMed] [Google Scholar]
- Henderson LA, Gandevia SC, Macefield VG. Somatotopic organization of the processing of muscle and cutaneous pain in the left and right insula cortex: a single-trial fMRI study. Pain. 2007;128:20–30. doi: 10.1016/j.pain.2006.08.013. [DOI] [PubMed] [Google Scholar]
- Henderson LA, Rubin TK, Macefield VG. Within-limb somatotopic representation of acute muscle pain in the human contralateral dorsal posterior insula. Hum Brain Mapp. 2011;32 doi: 10.1002/hbm.21131. doi: 10.1002/hbm.21131. [DOI] [PMC free article] [PubMed] [Google Scholar]
- Herrero MT, Barcia C, Navarro JM. Functional anatomy of thalamus and basal ganglia. Childs Nerv Syst. 2002;18:386–404. doi: 10.1007/s00381-002-0604-1. [DOI] [PubMed] [Google Scholar]
- Hikosaka O, Sakai K, Miyauchi S, Takino R, Sasaki Y, Putz B. Activation of human presupplementary motor area in learning of sequential procedures: a functional MRI study. J Neurophysiol. 1996;76:617–621. doi: 10.1152/jn.1996.76.1.617. [DOI] [PubMed] [Google Scholar]
- Iacoboni M, Woods RP, Brass M, Bekkering H, Mazziotta JC, Rizzolatti G. Cortical mechanisms of human imitation. Science. 1999;286:2526–2528. doi: 10.1126/science.286.5449.2526. [DOI] [PubMed] [Google Scholar]
- Isoda M, Tanji J. Participation of the primate presupplementary motor area in sequencing multiple saccades. J Neurophysiol. 2004;92:653–659. doi: 10.1152/jn.01201.2003. [DOI] [PubMed] [Google Scholar]
- Ide JS, Li C-S R. Error-related functional connectivity of the habenula in humans. Front Hum Neurosci. 2011;5:25. doi: 10.3389/fnhum.2011.00025. doi: 10.3389/fnhum.2011.00025. [DOI] [PMC free article] [PubMed] [Google Scholar]
- Jenkins GM, Watts DG. Spectral analysis and its applications. San Francisco (CA): Holden-Day; 1968. [Google Scholar]
- Johansen-Berg H, Behrens TE, Robson MD, Drobnjak I, Rushworth MF, Brady JM, Smith SM, Higham DJ, Matthews PM. Changes in connectivity profiles define functionally distinct regions in human medial frontal cortex. Proc Natl Acad Sci U S A. 2004;101:13335–13340. doi: 10.1073/pnas.0403743101. [DOI] [PMC free article] [PubMed] [Google Scholar]
- Johnson-Frey SH, Maloof FR, Newman-Norlund R, Farrer C, Inati S, Grafton ST. Actions or hand-object interactions? Human inferior frontal cortex and action observation. Neuron. 2003;39:1053–1058. doi: 10.1016/s0896-6273(03)00524-5. [DOI] [PubMed] [Google Scholar]
- Kaufman JN, Ross TJ, Stein EA, Garavan H. Cingulate hypoactivity in cocaine users during a GO-NOGO task as revealed by event-related functional magnetic resonance imaging. J Neurosci. 2003;23:7839–7843. doi: 10.1523/JNEUROSCI.23-21-07839.2003. [DOI] [PMC free article] [PubMed] [Google Scholar]
- Kim JH, Lee JM, Jo HJ, Kim SH, Lee JH, Kim ST, Seo SW, Cox RW, Na DL, Kim SI, et al. Defining functional SMA and pre-SMA subregions in human MFC using resting state fMRI: functional connectivity-based parcellation method. Neuroimage. 2010;49:2375–2386. doi: 10.1016/j.neuroimage.2009.10.016. [DOI] [PMC free article] [PubMed] [Google Scholar]
- Koski L, Wohlschlager A, Bekkering H, Woods RP, Dubeau MC, Mazziotta JC, Iacoboni M. Modulation of motor and premotor activity during imitation of target-directed actions. Cereb Cortex. 2002;12:847–855. doi: 10.1093/cercor/12.8.847. [DOI] [PubMed] [Google Scholar]
- Krawitz A, Fukunaga R, Brown JW. Anterior insula activity predicts the influence of positively framed messages on decision making. Cogn Affect Behav Neurosci. 2010;10:392–405. doi: 10.3758/CABN.10.3.392. [DOI] [PMC free article] [PubMed] [Google Scholar]
- Krieghoff V, Brass M, Prinz W, Waszak F. Dissociating what and when of intentional actions. Front Hum Neurosci. 2009;3:3. doi: 10.3389/neuro.09.003.2009. [DOI] [PMC free article] [PubMed] [Google Scholar]
- Leh SE, Ptito A, Chakravarty MM, Strafella AP. Fronto-striatal connections in the human brain: a probabilistic diffusion tractography study. Neurosci Lett. 2007;419:113–118. doi: 10.1016/j.neulet.2007.04.049. [DOI] [PMC free article] [PubMed] [Google Scholar]
- Lehericy S, Ducros M, Krainik A, Francois C, Van de Moortele PF, Ugurbil K, Kim DS. 3-D diffusion tensor axonal tracking shows distinct SMA and pre-SMA projections to the human striatum. Cereb Cortex. 2004;14:1302–1309. doi: 10.1093/cercor/bhh091. [DOI] [PubMed] [Google Scholar]
- Lehericy S, Ducros M, Van de Moortele PF, Francois C, Thivard L, Poupon C, Swindale N, Ugurbil K, Kim DS. Diffusion tensor fiber tracking shows distinct corticostriatal circuits in humans. Ann Neurol. 2004;55:522–529. doi: 10.1002/ana.20030. [DOI] [PubMed] [Google Scholar]
- Li CS, Huang C, Constable RT, Sinha R. Imaging response inhibition in a stop-signal task: neural correlates independent of signal monitoring and post-response processing. J Neurosci. 2006;26:186–192. doi: 10.1523/JNEUROSCI.3741-05.2006. [DOI] [PMC free article] [PubMed] [Google Scholar]
- Li CS, Yan P, Chao HH, Sinha R, Paliwal P, Constable RT, Zhang S, Lee TW. Error-specific medial cortical and subcortical activity during the stop signal task: a functional magnetic resonance imaging study. Neuroscience. 2008;155:1142–1151. doi: 10.1016/j.neuroscience.2008.06.062. [DOI] [PMC free article] [PubMed] [Google Scholar]
- Lowe MJ, Mock BJ, Sorenson JA. Functional connectivity in single and multislice echoplanar imaging using resting-state fluctuations. Neuroimage. 1998;7:119–132. doi: 10.1006/nimg.1997.0315. [DOI] [PubMed] [Google Scholar]
- Lu MT, Preston JB, Strick PL. Interconnections between the prefrontal cortex and the premotor areas in the frontal lobe. J Comp Neurol. 1994;341:375–392. doi: 10.1002/cne.903410308. [DOI] [PubMed] [Google Scholar]
- Luppino G, Matelli M, Camarda R, Rizzolatti G. Corticocortical connections of area F3 (SMA-proper) and area F6 (pre-SMA) in the macaque monkey. J Comp Neurol. 1993;338:114–140. doi: 10.1002/cne.903380109. [DOI] [PubMed] [Google Scholar]
- Macar F, Anton JL, Bonnet M, Vidal F. Timing functions of the supplementary motor area: an event-related fMRI study. Brain Res Cogn Brain Res. 2004;21:206–215. doi: 10.1016/j.cogbrainres.2004.01.005. [DOI] [PubMed] [Google Scholar]
- MacQueen JB. Some methods for classification and analysis of multivariate observations. In: Le Cam LM, Neyman J, editors. Proceedings of the Fifth Berkeley Symposium on Mathematical Statistics and Probability. Berkeley (CA): University of California Press; 1967. pp. 281–297. [Google Scholar]
- Maier MA, Armand J, Kirkwood PA, Yang HW, Davis JN, Lemon RN. Differences in the corticospinal projection from primary motor cortex and supplementary motor area to macaque upper limb motoneurons: an anatomical and electrophysiological study. Cereb Cortex. 2002;12:281–296. doi: 10.1093/cercor/12.3.281. [DOI] [PubMed] [Google Scholar]
- Margulies DS, Kelly AM, Uddin LQ, Biswal BB, Castellanos FX, Milham MP. Mapping the functional connectivity of anterior cingulate cortex. Neuroimage. 2007;37:579–588. doi: 10.1016/j.neuroimage.2007.05.019. [DOI] [PubMed] [Google Scholar]
- Mecklinger A, Bosch V, Gruenewald C, Bentin S, von Cramon DY. What have Klingon letters and faces in common? An fMRI study on content-specific working memory systems. Hum Brain Mapp. 2000;11:146–161. doi: 10.1002/1097-0193(200011)11:3<146::AID-HBM20>3.0.CO;2-D. [DOI] [PMC free article] [PubMed] [Google Scholar]
- Menon V, Uddin LQ. Saliency, switching, attention and control: a network model of insula function. Brain Struct Funct. 2010;214:655–667. doi: 10.1007/s00429-010-0262-0. [DOI] [PMC free article] [PubMed] [Google Scholar]
- Merriam EP, Colby CL, Thulborn KR, Luna B, Olson CR, Sweeney JA. Stimulus-response incompatibility activates cortex proximate to three eye fields. Neuroimage. 2001;13:794–800. doi: 10.1006/nimg.2000.0742. [DOI] [PubMed] [Google Scholar]
- Modinos G, Ormel J, Aleman A. Activation of anterior insula during self-reflection. PLoS One. 2009;4:e4618. doi: 10.1371/journal.pone.0004618. [DOI] [PMC free article] [PubMed] [Google Scholar]
- Molnar-Szakacs I, Iacoboni M, Koski L, Mazziotta JC. Functional segregation within pars opercularis of the inferior frontal gyrus: evidence from fMRI studies of imitation and action observation. Cereb Cortex. 2005;15:986–994. doi: 10.1093/cercor/bhh199. [DOI] [PubMed] [Google Scholar]
- Muakkassa KF, Strick PL. Frontal lobe inputs to primate motor cortex: evidence for four somatotopically organized ‘premotor’ areas. Brain Res. 1979;177:176–182. doi: 10.1016/0006-8993(79)90928-4. [DOI] [PubMed] [Google Scholar]
- Murphy K, Birn RM, Handwerker DA, Jones TB, Bandettini PA. The impact of global signal regression on resting state correlations: are anti-correlated networks introduced? Neuroimage. 2009;44:893–905. doi: 10.1016/j.neuroimage.2008.09.036. [DOI] [PMC free article] [PubMed] [Google Scholar]
- Nachev P, Kennard C, Husain M. Functional role of the supplementary and pre-supplementary motor areas. Nat Rev Neurosci. 2008;9:856–869. doi: 10.1038/nrn2478. [DOI] [PubMed] [Google Scholar]
- Nachev P, Rees G, Parton A, Kennard C, Husain M. Volition and conflict in human medial frontal cortex. Curr Biol. 2005;15:122–128. doi: 10.1016/j.cub.2005.01.006. [DOI] [PMC free article] [PubMed] [Google Scholar]
- Naghavi HR, Eriksson J, Larsson A, Nyberg L. The claustrum/insula region integrates conceptually related sounds and pictures. Neurosci Lett. 2007;422:77–80. doi: 10.1016/j.neulet.2007.06.009. [DOI] [PubMed] [Google Scholar]
- Nakamura K, Sakai K, Hikosaka O. Neuronal activity in medial frontal cortex during learning of sequential procedures. J Neurophysiol. 1998;80:2671–2687. doi: 10.1152/jn.1998.80.5.2671. [DOI] [PubMed] [Google Scholar]
- Nakamura K, Sakai K, Hikosaka O. Effects of local inactivation of monkey medial frontal cortex in learning of sequential procedures. J Neurophysiol. 1999;82:1063–1068. doi: 10.1152/jn.1999.82.2.1063. [DOI] [PubMed] [Google Scholar]
- Nanetti L, Cerliani L, Gazzola V, Renken R, Keysers C. Group analyses of connectivity-based cortical parcellation using repeated k-means clustering. Neuroimage. 2009;47:1666–1677. doi: 10.1016/j.neuroimage.2009.06.014. [DOI] [PubMed] [Google Scholar]
- Naqvi NH, Bechara A. The hidden island of addiction: the insula. Trends Neurosci. 2009;32:56–67. doi: 10.1016/j.tins.2008.09.009. [DOI] [PMC free article] [PubMed] [Google Scholar]
- Nash PG, Macefield VG, Klineberg IJ, Murray GM, Henderson LA. Differential activation of the human trigeminal nuclear complex by noxious and non-noxious orofacial stimulation. Hum Brain Mapp. 2009;30:3772–3782. doi: 10.1002/hbm.20805. [DOI] [PMC free article] [PubMed] [Google Scholar]
- Nelson SM, Dosenbach NU, Cohen AL, Wheeler ME, Schlaggar BL, Petersen SE. Role of the anterior insula in task-level control and focal attention. Brain Struct Funct. 2010;214:669–680. doi: 10.1007/s00429-010-0260-2. [DOI] [PMC free article] [PubMed] [Google Scholar]
- Newman-Norlund RD, Ganesh S, van Schie HT, De Bruijn ER, Bekkering H. Self-identification and empathy modulate error-related brain activity during the observation of penalty shots between friend and foe. Soc Cogn Affect Neurosci. 2009;4:10–22. doi: 10.1093/scan/nsn028. [DOI] [PMC free article] [PubMed] [Google Scholar]
- Ogawa K, Inui T, Sugio T. Separating brain regions involved in internally guided and visual feedback control of moving effectors: an event-related fMRI study. Neuroimage. 2006;32:1760–1770. doi: 10.1016/j.neuroimage.2006.05.012. [DOI] [PubMed] [Google Scholar]
- Picard N, Strick PL. Motor areas of the medial wall: a review of their location and functional activation. Cereb Cortex. 1996;6:342–353. doi: 10.1093/cercor/6.3.342. [DOI] [PubMed] [Google Scholar]
- Picard N, Strick PL. Imaging the premotor areas. Curr Opin Neurobiol. 2001;11:663–672. doi: 10.1016/s0959-4388(01)00266-5. [DOI] [PubMed] [Google Scholar]
- Pollmann S, von Cramon DY. Object working memory and visuospatial processing: functional neuroanatomy analyzed by event-related fMRI. Exp Brain Res. 2000;133:12–22. doi: 10.1007/s002210000396. [DOI] [PubMed] [Google Scholar]
- Preuschoff K, Quartz SR, Bossaerts P. Human insula activation reflects risk prediction errors as well as risk. J Neurosci. 2008;28:2745–2752. doi: 10.1523/JNEUROSCI.4286-07.2008. [DOI] [PMC free article] [PubMed] [Google Scholar]
- Ridderinkhof KR, Ullsperger M, Crone EA, Nieuwenhuis S. The role of the medial frontal cortex in cognitive control. Science. 2004;306:443–447. doi: 10.1126/science.1100301. [DOI] [PubMed] [Google Scholar]
- Rombouts SA, Stam CJ, Kuijer JP, Scheltens P, Barkhof F. Identifying confounds to increase specificity during a “no task condition”. Evidence for hippocampal connectivity using fMRI. Neuroimage. 2003;20:1236–1245. doi: 10.1016/S1053-8119(03)00386-0. [DOI] [PubMed] [Google Scholar]
- Rushworth MF, Walton ME, Kennerley SW, Bannerman DM. Action sets and decisions in the medial frontal cortex. Trends Cogn Sci. 2004;8:410–417. doi: 10.1016/j.tics.2004.07.009. [DOI] [PubMed] [Google Scholar]
- Sakai K, Hikosaka O, Miyauchi S, Sasaki Y, Fujimaki N, Putz B. Presupplementary motor area activation during sequence learning reflects visuo-motor association. J Neurosci. 1999;19:RC1. doi: 10.1523/JNEUROSCI.19-10-j0002.1999. [DOI] [PMC free article] [PubMed] [Google Scholar]
- Santosh CG, Rimmington JE, Best JJ. Functional magnetic resonance imaging at 1 T: motor cortex, supplementary motor area and visual cortex activation. Br J Radiol. 1995;68:369–374. doi: 10.1259/0007-1285-68-808-369. [DOI] [PubMed] [Google Scholar]
- Shallice T, Stuss DT, Picton TW, Alexander MP, Gillingham S. Multiple effects of prefrontal lesions on task-switching. Front Hum Neurosci. 2007;1:2. doi: 10.3389/neuro.09.002.2007. [DOI] [PMC free article] [PubMed] [Google Scholar]
- Shima K, Tanji J. Both supplementary and presupplementary motor areas are crucial for the temporal organization of multiple movements. J Neurophysiol. 1998;80:3247–3260. doi: 10.1152/jn.1998.80.6.3247. [DOI] [PubMed] [Google Scholar]
- Takada M, Tokuno H, Nambu A, Inase M. Corticostriatal projections from the somatic motor areas of the frontal cortex in the macaque monkey: segregation versus overlap of input zones from the primary motor cortex, the supplementary motor area, and the premotor cortex. Exp Brain Res. 1998;120:114–128. doi: 10.1007/s002210050384. [DOI] [PubMed] [Google Scholar]
- Tanji J. New concepts of the supplementary motor area. Curr Opin Neurobiol. 1996;6:782–787. doi: 10.1016/s0959-4388(96)80028-6. [DOI] [PubMed] [Google Scholar]
- Taylor KS, Seminowicz DA, Davis KD. Two systems of resting state connectivity between the insula and cingulate cortex. Hum Brain Mapp. 2009;30:2731–2745. doi: 10.1002/hbm.20705. [DOI] [PMC free article] [PubMed] [Google Scholar]
- Tzourio-Mazoyer N, Landeau B, Papathanassiou D, Crivello F, Etard O, Delcroix N, Mazoyer B, Joliot M. Automated anatomical labeling of activations in SPM using a macroscopic anatomical parcellation of the MNI MRI single-subject brain. Neuroimage. 2002;15:273–289. doi: 10.1006/nimg.2001.0978. [DOI] [PubMed] [Google Scholar]
- Van Oostende S, Van Hecke P, Sunaert S, Nuttin B, Marchal G. FMRI studies of the supplementary motor area and the premotor cortex. Neuroimage. 1997;6:181–190. doi: 10.1006/nimg.1997.0287. [DOI] [PubMed] [Google Scholar]
- Volz KG, Schubotz RI, von Cramon DY. Why am I unsure? Internal and external attributions of uncertainty dissociated by fMRI. Neuroimage. 2004;21:848–857. doi: 10.1016/j.neuroimage.2003.10.028. [DOI] [PubMed] [Google Scholar]
- Volz KG, Schubotz RI, von Cramon DY. Variants of uncertainty in decision-making and their neural correlates. Brain Res Bull. 2005;67:403–412. doi: 10.1016/j.brainresbull.2005.06.011. [DOI] [PubMed] [Google Scholar]
- Wang Y, Isoda M, Matsuzaka Y, Shima K, Tanji J. Prefrontal cortical cells projecting to the supplementary eye field and presupplementary motor area in the monkey. Neurosci Res. 2005;53:1–7. doi: 10.1016/j.neures.2005.05.005. [DOI] [PubMed] [Google Scholar]
- Weissenbacher A, Kasess C, Gerstl F, Lanzenberger R, Moser E, Windischberger C. Correlations and anticorrelations in resting-state functional connectivity MRI: a quantitative comparison of preprocessing strategies. Neuroimage. 2009;47:1408–1416. doi: 10.1016/j.neuroimage.2009.05.005. [DOI] [PubMed] [Google Scholar]
- Wicker B, Keysers C, Plailly J, Royet JP, Gallese V, Rizzolatti G. Both of us disgusted in My insula: the common neural basis of seeing and feeling disgust. Neuron. 2003;40:655–664. doi: 10.1016/s0896-6273(03)00679-2. [DOI] [PubMed] [Google Scholar]
- Wiesendanger R, Wiesendanger M. The thalamic connections with medial area 6 (supplementary motor cortex) in the monkey (Macaca fascicularis) Exp Brain Res. 1985;59:91–104. doi: 10.1007/BF00237670. [DOI] [PubMed] [Google Scholar]
- Wright P, He G, Shapira NA, Goodman WK, Liu Y. Disgust and the insula: fMRI responses to pictures of mutilation and contamination. Neuroreport. 2004;15:2347–2351. doi: 10.1097/00001756-200410250-00009. [DOI] [PubMed] [Google Scholar]
- Wu T, Hallett M. The influence of normal human ageing on automatic movements. J Physiol. 2005;562:605–615. doi: 10.1113/jphysiol.2004.076042. [DOI] [PMC free article] [PubMed] [Google Scholar]
- Xue G, Lu Z, Levin IP, Bechara A. The impact of prior risk experiences on subsequent risky decision-making: the role of the insula. Neuroimage. 2010;50:709–716. doi: 10.1016/j.neuroimage.2009.12.097. [DOI] [PMC free article] [PubMed] [Google Scholar]
- Zhang D, Snyder AZ, Fox MD, Sansbury MW, Shimony JS, Raichle ME. Intrinsic functional relations between human cerebral cortex and thalamus. J Neurophysiol. 2008;100:1740–1748. doi: 10.1152/jn.90463.2008. [DOI] [PMC free article] [PubMed] [Google Scholar]
- Zhang D, Snyder AZ, Shimony JS, Fox MD, Raichle ME. Noninvasive functional and structural connectivity mapping of the human thalamocortical system. Cereb Cortex. 2010;20:1187–1194. doi: 10.1093/cercor/bhp182. [DOI] [PMC free article] [PubMed] [Google Scholar]
Associated Data
This section collects any data citations, data availability statements, or supplementary materials included in this article.