

Abstract
Congestive heart failure (CHF) is a leading cause of death in the United States affecting approximately 670,000 individuals. Due to the prevalence of CHF related issues, it is prudent to seek out methodologies that would facilitate the prevention, monitoring, and treatment of heart disease on a daily basis. This paper describes WANDA (Weight and Activity with Blood Pressure Monitoring System); a study that leverages sensor technologies and wireless communications to monitor the health related measurements of patients with CHF. The WANDA system is a three-tier architecture consisting of sensors, web servers, and back-end databases. The system was developed in conjunction with the UCLA School of Nursing and the UCLA Wireless Health Institute to enable early detection of key clinical symptoms indicative of CHF-related decompensation. This study shows that CHF patients monitored by WANDA are less likely to have readings fall outside a healthy range. In addition, WANDA provides a useful feedback system for regulating readings of CHF patients.
Keywords: Health monitoring, Telemedicine, Wireless health, Congestive heart failure patients monitoring, Real-time feedback, Data integrity, Database backup
Introduction
Congestive Heart Failure (CHF, [1]) occurs when the heart is unable to adequately supply enough blood for a healthy physiological state. CHF typically occurs when cardiac tissue becomes ischemic from coronary vessel blockage. Ischemia reduces the mechanical functionality of the heart and disrupts normal electrophysiological processes.
Recent statistical literature issued by the Center for Disease Control and Prevention [2] indicates that approximately 670,000 individuals are diagnosed with CHF every year. In 2006, it was reported that CHF was the cause of 282,754 deaths. CHF is the leading cause of death in the United States; greater than the deaths caused by cancer or strokes.
CHF also has a significant fiscal impact. The CDC reports that CHF costs Americans 29 billion dollars per year in medical expenses. Bundkirchen [3] reports that the average hospital visit in Europe due to CHF costs 10,000 Euros. In addition, 24% of patients must be readmitted to the hospital within 12 weeks of discharge.
Due to the prevalence and economic burden of CHF, it’s necessary to seek out methodologies that would facilitate the prevention, monitoring, and treatment of heart disease. Experts and researchers in cardiac medicine suggest monitoring and tracking patients’ symptoms on an everyday basis in order to prevent emergencies. However, patients often lack the motivation to exercise and/or monitor their own health related measurements. Hence, a remote health monitoring system with medical oversight should serve useful for observing patients with CHF. In addition, remote health monitoring systems are extremely cost effective due to the availability of inexpensive monitoring devices and infrastructure.
This paper presents WANDA (Weight and Activity with Blood Pressure Monitoring System [4, 5]); a remote health monitoring system for patients with CHF. WANDA has four objectives: 1) Improve a physician’s ability to monitor daily progress of a patient. 2) Provide a pervasive monitoring solution that easily integrates into the lifestyles of patients. 3) Improve a physician’s ability to make decisions making through automated data analysis of patient data. 4) Provide a modular and customizable mobile monitoring platform to meet the specific needs of patients.
WANDA monitors the following four health related measurements: weight, blood pressure, physical activity, and the Heart Failure Somatic Awareness Scale (HFSAS). WANDA flags notable trends in monitored data alerting physicians of potential health risks. Notable trends are defined as abnormal changes in measured values and are displayed in Table 2.
Table 2.
Acceptable range of each measured value
| Values | Range |
|---|---|
| Systolic | > 90 |
| Diastolic | > 50 |
| Heart rate | < 90 and >40 |
| Weight | < +2 (lb./day) |
Critical health related measurements for congestive heart failure
Weight
In a study of 5,881 subjects (3,177 women and 2,704 men) by Kenchaiah [6], the risk of CHF was increased by 5% for men and a 7% for women when the BMI (Body Mass Index) was increased by only 1%. WANDA can monitor the BMI of patients who are at risk of CHF and aid in weight management and preventative care. WANDA is not only useful to physicians, but can function as a tool for patients to become self-aware of their own weight.
Blood pressure and heart rate
A study by Vasan [7] of 6,859 patients establishes that increased blood pressure is correlated with an increased risk of cardiovascular disease. CHF is often caused by systolic dysfunction where the heart muscle cannot adequately pump or eject the blood out of the heart, or by a diastolic dysfunction where the atrium does not fill up. As this pumping procedure stops, blood may back up in other areas of the body, producing congestion in the lungs, liver, gastrointestinal tract, arms, or legs.
Heart rate is an additional factor that predicts the risk for CHF in an elderly person. Heart rate may help identify patients at high risk for overt CHF who are candidates for aggressive blood pressure control [8, 9]. The WANDA platform can be used for continuous daily monitoring of a patient’s systolic and diastolic blood pressure and heart rate.
Physical activity
He’s study [10] suggests several risk factors for CHF including low physical activity, which accounts for 9.2% of risk. The results of Hambrecht’s work [11] suggests that long-term aerobic exercise training in patients with CHF restores function of the skeletal muscle microvasculature of the lower limb. WANDA monitors calorie expenditure and metabolic equivalents.
Heart failure somatic awareness scale (HFSAS)
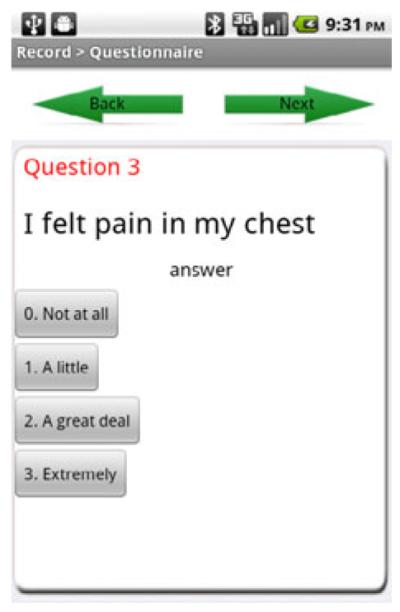
The Heart Failure Somatic Awareness Scale (HFSAS) in Table 1 is a 12-item Likert-type scale for the purpose of measuring awareness and perceived severity of CHF specific signs and symptoms. The 12 items of the HFSAS reflect the most common signs and symptoms of CHF. A 4-point Likert-type scale is used to address the degree of these symptoms and ascertain how much the patient is bothered by the specific symptom (0: Not at all, 1: A little, 2: A great deal, 3: Extremely). Scores range from 0 to 36, with higher score showing higher perceived somatic awareness and symptom distress [12], The HFSAS is useful in studies designed to improve symptom recognition and self-management. Fostering awareness of the early CHF symptoms of decompensation averts repeated hospital admission for symptom management. The HFSAS questions are asked daily by WANDA’s mobile smartphone application.
Table 1.
WANDA B.’s daily SMS questions
| Questionnaire items |
|---|
| I could feel my heart beat faster |
| I could not breathe when I laid down |
| I felt pain in my chest |
| I had an upset stomach |
| I had a cough |
| I was tired |
| I could not catch my breath |
| My feet were swollen |
| I woke up at night because I could not breathe |
| My shoes were tighter than usual |
| I gained 3 or more pounds in the past week |
| I could not do my usual daily activities because I was short of breath |
The aforementioned health related measurements can be monitored through weight scales, blood pressure monitors, activity monitors, and questionnaires. WANDA allows for customization for the specific monitoring needs of a physician. For example, if a physician has recommended an increase in physical exercise, the WANDA activity sensing function can be used to help patients maintain acceptable levels of physical activity.
WANDA
This paper presents the components of WANDA, which leverage sensor technologies and wireless communications to monitor the health status of CHF patients. WANDA was developed in conjunction with the University of California, Los Angeles Wireless Health Institute (WHI) and School of Nursing. WANDA is built upon a three-tier architecture. The first tier is composed of sensors for monitoring patients’ health related measurements. These readings are wirelessly transmitted to the second tier. The second tier consists of web servers that store sensed data and maintain its integrity. The third tier is a back-end database server that performs backup and recovery jobs.
This study shows WANDA to be an effective platform for reducing the number of notable trends in CHF risk factors. This study has enabled patients to reduce 5.6% of weight and blood pressure values that are out of the acceptable range (Table 2). For weight data, the paired t-test results show that the WANDA study is effective for CHF patients.
Related works
Chaudhry [13, 14] utilized a telephone-based interactive voice response system (Pharos Tel-Assurance system [15]) for CHF patients. This system collected daily information about symptoms and weight reviewed by the patients’ clinicians. Patients in this study were required to make daily calls to the system. During each call, patients were asked a series of questions about their general health and CHF symptoms. Responses were entered into the system using the telephone keypad. Information from the telemonitoring system was downloaded daily and reviewed by nurses on every non-holiday weekday. The study suggests that telemonitoring did not improve patient outcomes.
Soran’s [16, 17] used an electronic scale and an individualized symptom response system (the Alere DayLink monitor [18]) for CHF patients. System components were linked via a standard phone line to recording databases. If criterion values were met for weight or symptom alerts, the nurses immediately contacted the patient to check on the status of the patient. After nurse-patient interactions, the primary physician was notified by a fax report to adjust medications and schedule an appointment. Soran’s work showed that enhanced patient education and follow up was as successful as a home monitoring device for elderly patients receiving care from a community-based primary care practitioner.
Desai’s work [19] attempted to explain the reason why there was no benefit seen with telemonitoring intervention in Chaudhry’s study. First, the signals of weight and symptoms do not provide adequate warnings for CHF. Results from trials of CHF patients monitoring [20] suggest that only monitoring weight is inadequate, since the target dry weight changes on the basis of caloric intake. Second, the telemonitoring system was underutilized, with only 55% of patients making three calls week by week. Third, the intervention may not have been structured for timely and appropriate corrective action. With regard to timing, the requirement that coordinators review data may have caused a serious break in patient care. The team member receiving the data should have been able to contact the patient directly to discuss a treatment plan, without having to triangulate the discussion with a physician. Similar to Chaudhry’s work, Soran’s study also only monitored weight and symptom responses, and was limited by the need to wait on a physician’s decision.
In order to design an effective remote health monitoring system for CHF, it is important to make an automated real-time system for checking important values such as weight, blood pressure, heart rate, daily activity, and symptom responses. A system must send a reminder to patients to reduce gaps in the dataset. In addition, the system should be in real-time to ensure the timely delivery of data to physicians. These results were used to tailor and develop the WANDA system, which addresses all of these requirements.
System architecture
WANDA is built using a three-tier architecture as shown in Fig. 1. The first tier is a sensor tier that takes patients’ health related measurements and transmits data to the web server tier. The second tier consists of web servers that receive data from the first tier and maintains data integrity. The third tier is a back-end database server that performs data backup and recovery jobs. Additionally, data in the third tier is used for data analysis such as linear regression, missing data imputation, signal search, early adaptive alarm, and clinical data security projects.
Fig. 1.

WANDA system architecture
Sensor tier
The first tier is comprised of wireless sensors and mobile devices. Sensors in this layer monitor patients and transfer data to web-servers. The first iteration of WANDA is designed for elderly CHF patients who are not accustomed to smart phones or computers. Thus, WANDA only uses devices that look and function as standard weight scales and blood pressure monitors with a standard phone line connection. The second version of WANDA uses a smartphone to collect and transfer data. This mobile version also allows patients to view their own health data through a smartphone interface. The second version’s graphical user interface provides detailed instructions with images to make the device easy to use for patients.
The first version’s sensor tier uses Bluetooth-based weight scales, blood pressure monitors, WHI [21] Personal Activity Monitors (PAMs), cell phones, and an SMS message server system in order to monitor CHF patients (Fig. 2). As previously mentioned, patients using this system are generally unfamiliar with computers or smartphones, thus WANDA interfaces with the second tier through a phone line system in real-time. PAMs (Personal Activity Monitors) are delivered to the users via mail and are used to record patient movements. Data collected by the PAMs are uploaded to the databases every 2 weeks.
Fig. 2.

Devices used in WANDA
The second version of WANDA (Fig. 3) utilizes a different collection of health monitoring devices from the first version in order to implement a mobile version of WANDA. The second version not only has all the functions of the original system, but also gives developers greater customizability compared to the first system. In the sensor tier, we use Bluetooth-based weight scales, blood pressure monitors, Android-based activity monitors, fall detection monitors, and symptom questionnaire applications. In terms of the Bluetooth device-smartphone interface, all of the devices act as masters that initiate Bluetooth communication with an Android phone. The Bluetooth protocol has a range of approximately 10 m and provides secure data transmissions. The communication between the phone and the medical server is through Wi-Fi or 3G networks. Data measured from a sensing device is uploaded to the Android phone within 5 s. The Android phone transfers data to a networked server as well as stores data on a local SD card.
Fig. 3.

Devices used in Mobile WANDA
Survey system
The survey system unit (NIDA) is used at the beginning of the WANDA study in order to gather basic user information. This system is also used periodically to track the user’s health status.
NIDA (Fig. 4) is a touch-screen-based survey system that is operated on desktops, laptops and tablet PCs. NIDA uses an open XML-based format for questions and results, and supports text-to-voice functionality. For various users it provides several language options, such as English and Spanish. Therefore, depending on users’ preferences, users can choose a language and choose to communicate by either text or voice. NIDA stores and retrieves data from the remote site using a 3G wireless network. If there is no 3G-network connection, NIDA stores data in a local database and waits until the device is in a 3G-network area to upload data to the web database. Since it is computer-based, questionnaires are more standardized and easily completed, as McHorney [22] emphasizes and implements. Additionally, since users don’t need to be with interviewers, NIDA improves efficiency and reduces costs. Using lightweight tablet PCs, patients are more likely to answer frankly and freely than in the presence of interviewers.
Fig. 4.

WHI NIDA survey system
Weight scale
The Ideal Life system [23] is a part of the first tier of the first version of WANDA. It includes the Body Manager™ body weight scale and the BP Manager™ blood pressure monitor device. The Body Manager™ system collects weight data and sends it to the Ideal Life Pod™. Since the system supports Bluetooth, the components can communicate in a range up to 300–400 ft.
The mobile version of WANDA uses a Tanita BC-590BT body composition scale, which measures body weight, body fat, body water, bone mass, muscle mass, metabolic age, and visceral rating. With the additional body data provided by the scale, health providers may be able to make an even more thorough analysis of patients’ symptoms. For example, since one of the most effective means of monitoring HF patients is monitoring one’s fluid status, the weight scale features that relate to measuring the fluids in the body may help doctors diagnose patients more precisely.
Blood pressure monitor
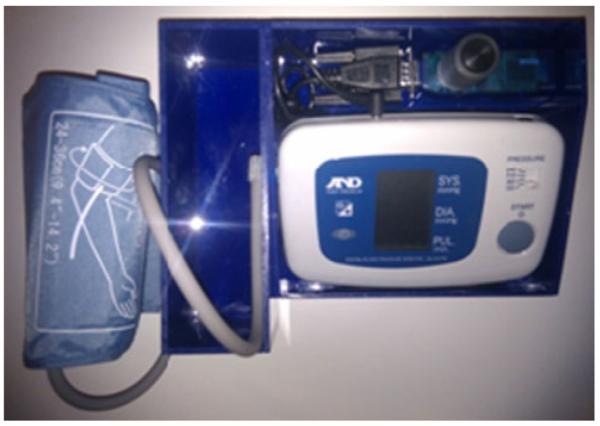
The Ideal Life [23] BP Manager™ blood pressure monitor device measures diastolic blood pressure, systolic blood pressure and heart rate in the first version of WANDA. The BP Manager™ system collects blood pressure and heart rate data and sends it to the Ideal Life Pod™ via a Bluetooth connection.
The blood pressure monitor used in the mobile version is a UA-767PBT Bluetooth blood pressure monitor from AND [24]. This blood pressure monitors measures systolic and diastolic blood pressure, mean-arterial-pressure, and heart rate values. This version of blood pressure monitor does not natively support Bluetooth connection to the smartphone. In order to solve this lack of compatibility, we connected the blood pressure monitor with a RN-270M Bluetooth adapter from Roving Networks via a 3.5 mm DB9 cable [25](Fig. 5). A UA-767PC blood pressure monitor sends the measurement results through a serial port, and has a subsequent adapter transmit the data to the smartphone through a Bluetooth connection.
Fig. 5.
Designed Bluetooth-enabled blood pressure monitor
Activity monitor
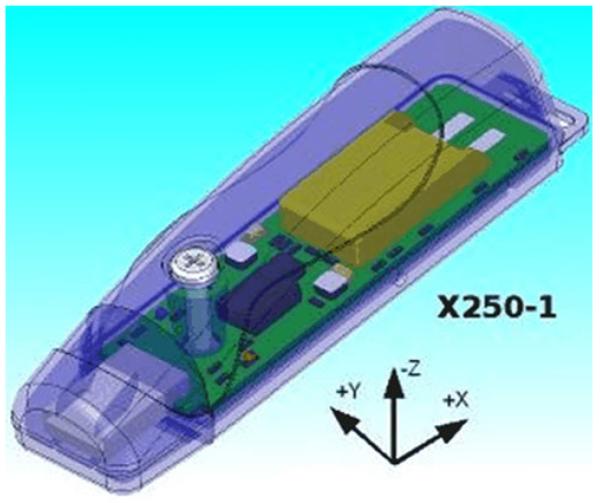
The phone-line version of WANDA uses the WHI Personal Activity monitor for monitoring patients’ daily activity. The WHI Personal Activity Monitor, or PAM (shown in Fig. 6), is a small, lightweight, triaxial accelerometer-based activity recorder. The WHI PAM’s small form factor allows it to be easily carried in a patient’s pocket. The sample rate as well as the minimum acceleration threshold can be adjusted to ensure that data resolution requirements are met while optimizing for longer battery life. Time-series acceleration data is stored using an on-board flash memory card. Data transfer is achieved via USB on an internet-enabled PC. Using a patient’s age, gender, height, and weight, the WHI PAM system calculates daily caloric expenditure based on the metabolic equivalents (METs) associated with approximations of the patient’s activity levels throughout the day.
Fig. 6.
WHI PAM (Personal Activity Monitor)
WANDA calculates the METs value (Table 3) based on activity information detected by the PAM device. Calories burned by each activity are calculated by the following equation [26].
| (1) |
Table 3.
Activity levels and METs values
| Physical activity | MET |
|---|---|
| Light intensity activities | < 3 |
| Sleeping | 0.9 |
| Writing, desk work, typing | 1.8 |
| Walking, less than 2.0 mph (3.2 km/h), level ground, strolling |
2 |
| Moderate intensity activities | 3 to 6 |
| Bicycling, stationary, 50 W, very light effort | 3 |
| Sexual activity (position dependent) | 3.3 |
| Calisthenics, home exercise, light or moderate effort, general |
3.5 |
| Bicycling, <10 mph (16 km/h), leisure, to work or for pleasure |
4 |
| Bicycling, stationary, 100 W, light effort | 5.5 |
| Vigorous intensity activities | >6 |
| Jogging, general | 7 |
| Calisthenics, heavy, vigorous effort | 8 |
| Running jogging, in place | 8 |
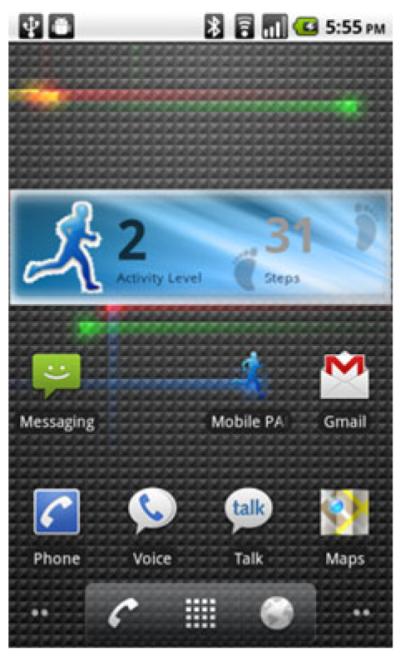
The mobile version of WANDA provides an Android-based activity monitor application shown in Fig 7. It provides information about daily activity level, pedometer function and calorie expenditure. The method for estimating activity level is based on an algorithm proposed by Panasonic [27, 28]. It is proven that the value calculated by this algorithm has high correlation (R2=0.86) with the Doubly Label Water method, which is one of the most accurate methods for evaluating total energy expenditure under a free-living condition. Metabolic equivalent task (METs) level of physical activities and approximated calories burned is calculated using this algorithm and the equation used for the phone line version of WANDA.
| (2) |
Fig. 7.
Activity monitor in the Mobile version of WANDA
Km value in the following equation has a high correlation with the actual total energy expenditure. The METs level can be found by the first order linear regression fit. n is the number of samples in a given time window. Xi, Yi, Zi are accelerations in x, y, z directions at ith sample. ∑x, ∑y, ∑z are the summation of the accelerations within a time window. In our application, the sampling rate is about 20 Hz and the time window is 1 min. Therefore, the number of samples, n, in 1 min is 1,200.
Each new sample contains three-axis acceleration and timestamp data measured every millisecond. A new Km value is generated every minute, which is written onto a local SD card. The data recorded on the card is then transmitted to the database in the second tier via WiFi or 3G connections.
Daily symptom questionnaire system
Based on the schedule set by doctors, WANDA has patients answer a questionnaire (See Table 1) via an SMS survey system or an Android-based application (Fig. 8). The questionnaire is given for the purpose of checking for CHF symptoms. The corresponding user responses are collected and recorded by the WHI WANDA database in the second tier. The SMS system sends a text message to the users to which they can reply to in the same way as they would reply to texts from friends. The Android-based questionnaire application asks questions to the users and users can answer by using the touch screen. The smartphone application has a daily reminder function. If the function is enabled, users receive a reminder notification if they forget to complete all 12 questions every 24 h. The answers obtained from the smartphone application are stored locally in the SD Card and uploaded to the WHI WANDA server via WiFi or 3G.
Fig. 8.
Daily symptom questionnaire smartphone application
Fall detection application
As Patel [29] mentioned, walking disorders are one of the most prevalent symptoms of CHF patients. Walking problems are related to other common CHF symptoms such as dizziness, swollen legs, shortness of breath, feebleness, sore stomach, chest pains, shakiness, irritating feelings while walking, and problems with balance. Since walking problems are related to imbalance, it is important to monitor patients and notify caregivers and family members when they need help. A fall detection function is implemented on the smartphone version of WANDA in order to detect falls and send alert messages,.
Because most of the body movements are constrained within frequency components below 20 Hz, and 99% of the energy is contained below 15 Hz [30], a 40 Hz sampling rate is sufficient for fall detection. The algorithm we used to detect falls can be categorized into three sequences. 1) Freefall detection. 2) Impact detection. 3) Orientation change detection. In a fall, these three events happen consecutively. The algorithm detects falls if at least two consecutive signal magnitude vectors (SVM) are above a defined threshold. The SVM essentially provides a measure of movement intensity [31].
Theoretically, the SVM of freefall is zero. A freefall is detected if SVM is under a defined threshold. The orientation is calculated from the acceleration based on the transformation equations in (3). The change of the orientation is computed by the equations in (4). The thresholds of freefall, impact, and orientation change are defined based on the desired sensitivity.
When a fall is detected, the application uses light, sound, and vibrations to get the users’ attention. LCD and LED indicators will be activated and flash, a phone will vibrate for 5 s, and a high-pitched ring tone will go off. The users have 1 min to cancel the alarm by clicking a pop up box on the phone. If the phone is not touched in 60 s, it sends an emergency message to the caregivers. The message include the user’s name, the alarm triggered time, and the possible location (determined by GPS data). If the user is indoors, a cellular network determines the location. By using Google Geocoding technology [32], the phone can map the latitude and longitude coordinates returned by GPS to a real street address, which provides more easily useable and understandable information for caregivers. Based on initial experiments, however, the street address can be off up to three street blocks if the user is indoors.
| (3) |
| (4) |
| (5) |
Reminder function
In Chaudhry’s study [13, 14] 14% of patients never used the telemonitoring system. By the final week, only 55% of the patients were using the system at least 3 times a week. Furthermore, 21% of the patients didn’t complete the final telephone interview at 6 months. In the first trial of WANDA [4, 5], 33.1% of 12 questionnaires showed missing data for questionnaire answers, and 55.7% of data had more than one missing values among the weight, diastolic and systolic blood pressure, heart rate, MET, and calorie expenditure categories. Desai [19] pointed out one of the reasons why Chaundhry’s didn’t work for CHF patients is the system was underused.
In order to reduce the number of missing data, we developed a reminder function on the mobile version WANDA. If the function is activated, users receive a popup reminder if they forget to measure values and complete all 12 questionnaires within 24 h.
Communication center
Since the phone line version system supports Bluetooth, the components can communicate within a range of up to 10 m. When the Ideal Life Pod™ receives data from the weight scale and blood pressure monitors, it transmits data to the database system through a standard phone line via a long-distance phone service plan.
The software application in the smartphone version is implemented on the Motorola Droid Smartphone™. In terms of the Bluetooth device and smartphone interface, all of the devices act as masters that initiate Bluetooth communication with an Android phone. Since the Android phone acts as a slave node, only one connection can be established at each time and a piconet is not possible. This is not an issue in the mobile version of WANDA, since patients will not be operating two sensing devices simultaneously if they are following standard usage protocol. The Bluetooth protocol has a range of approximate 10 m and provides secure data transmissions. The communication between the phone and the medical server is through Wi-Fi or 3G networks. The smartphone transfers this data to a networked server and also stores this data on a local SD card. If an upload procedure fails due to a problem with the network, the application will retry the upload when the network is available.
Web server tier
Data collected from the first tier are sent to several web servers to store data and provide monitoring applications mentioned in “Web and Mobile Applications”. Unlike the Mobile version, the phone line version draws data from several different web servers. Since Ideal Life, PAM, and the WHI SMS system use incompatible data types and different databases, analysis of data involves drawing data from different databases. Incompatible data formats in different databases are solved through usage of an abstraction of file formats and a shared ID table. The server also performs additional data processing for calculating specific variables from several different database sources. In addition, when the obtained values are out of the acceptable range (see Table 2), the system sends alert messages to healthcare providers via text message or e-mail.
Abstraction of data formats
The objective of abstraction in programming is to separate behavior from implementation. To allow changing implementations without affecting users, we should change the representation without having to change all programs by encapsulating the representation. If an implementation is encapsulated, other modules don’t have to depend on its implementation details [33].
A data abstraction procedure is required since the phone line version WANDA draws data from files systems that support different file formats such as CSV, XML and text (Fig. 9). For example, in order to insert data stored in an Ideal Life file system (Fig. 10) into a SQL server, data should be parsed and abstracted. Thus, we developed a PHP API to draw XML data from the file system and insert into the WANDA SQL server system.
Fig. 9.
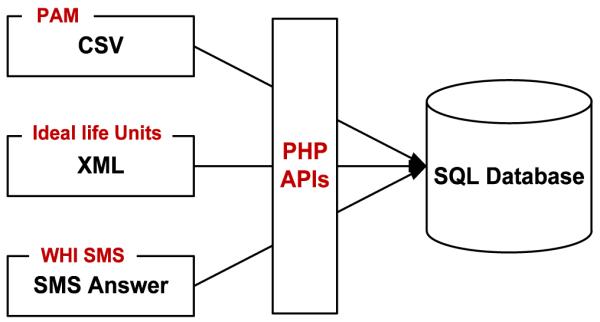
Data abstraction in WANDA
Fig. 10.
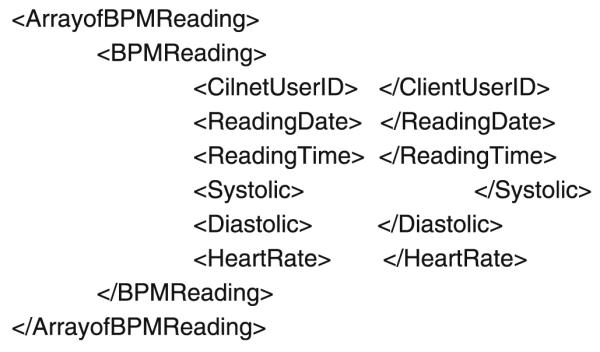
Blood pressure data format in the Ideal Life file system
Data abstraction facilities in WANDA web servers offer users the advantages of encapsulation. The representation of abstract objects can be changed without requiring corresponding changes in original files that manipulate the objects. In order to update data, the WANDA system calls other databases and file systems periodically and extracts data from them.
Data integrity
The need to combine records from different systems or healthcare organizations exists for many reasons, such as patients moving or changing healthcare providers. When the number of available repositories and analyses increases, linking information between them becomes a major concern. Finding the relevant resources and making connections between their content and analysis output poses significant challenges [34]. To make all patients’ medical records accessible to care providers, Bell [35] links electronic medical records together using a massively distributed Master Patient Index (MPI). An MPI is a facility that correlates and references patient identifiers and performs matches.
WANDA is an integrated architecture of Ideal Life system units, WHI PAM devices, and the WHI SMS system. Each system has its own database, patient ID, and item ID to distinguish the inputs measured by patients. Since WANDA can use different system units and add more devices, finding relevant resources and making connections among them is essential.
The concept of semantic integration comes from the world of business and electronic commerce, where similar problems of legacy software and complicated data exist [36]. In order to interpret the real mining of data from multiple sources, finding, establishing, and maintaining connections between relevant tools and most up-to-date data is significant. For solving the data integration problem in distributed systems, a shared ID table is used in the WANDA system. To join keys used in the Ideal Life systems, the WHI PAM, and the WHI SMS systems, the WANDA ID is used as a primary key. Other input in different system databases are referenced via the WANDA ID table and original database tables (Fig. 11), which enables the linkage of information located in several systems to a specific patient.
Fig. 11.
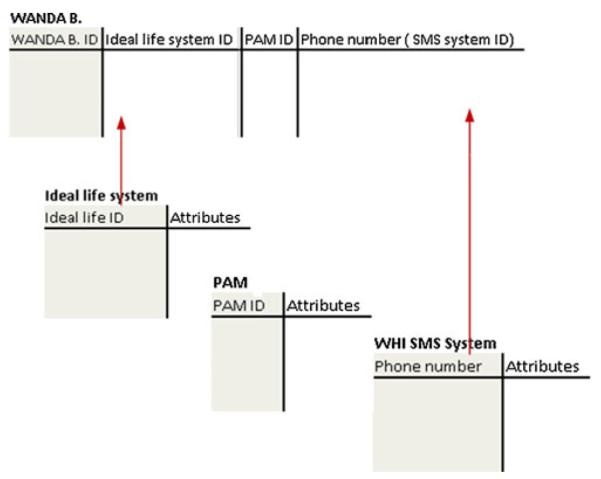
Database structure in WANDA and a shared ID table
For example, when a user tries to access weight data, the WANDA system draws data from the Idea Life system using the shared ID table. Therefore, the system should execute the following SQL query to perform the given task.
SELECT weight
FROM WANDA, Ideallife_system
WHEREWANDA.Id = \* a given ID *\ AND
WANDA.Ideallife_system_ID = Ideallife_system.
Ideallife_ID
Additional data processing
Based on requests, APIs were designed on the server side. The APIs perform data processing by using imported data from several different databases. For example, in order to calculate the calorie expenditure in (1), the most recent weight value from the database was extracted. The designed API calculated the calorie expenditure using the METs and weight value with matching timestamps (Fig. 12). Also, the duration of a certain METs value during a day can be calculated on the second tier of the system.
Fig. 12.

An example of data processing on the web server tier
Back-end database tier
As data in the WANDA system is critical and personal, the loss of any data must be actively guarded against. If there is missing data, the system cannot evaluate the patient’s status accurately and demonstrate the system’s effectiveness. Therefore, a back-end server in WHI SOPHI [37] for data backup and recovery was developed. WHI SOPHI is a database integration project that stores and distributes web pages, files, and data from all projects at the UCLA WHI. Data backups are useful for restoring state following a disaster or restoring small numbers of files after they have been accidentally deleted or corrupted. Data in the third tier is used for data analysis (such as linear regression, missing data imputation and early adaptive alarm) and clinical data security projects.
Data backup and recovery
WANDA applies an offline backup method that performs data backup when there are no current updates [38]. The data entry times are statistically analyzed and the system sets a backup and recovery schedule. When a database backup occurs, all unfinished file backups are checked for completion before the new backup procedure is executed. The DBMS communicates with the SOPHI client application to support transactional properties of data, coordinated backup and recovery. The data backup log file in the SOPHI client application maintains the last modification timestamp, distributed database information, the unique ID of the last updated data, and other various components. To support coordinated backup and recovery with the DBMS, the application interfaces with the back-end server through WANDA APIs.
In order to perform a backup of distributed web databases, the SOPHI client application takes a central role (Fig. 13). Using its backup log file and PHP APIs, it controls data delivery between distributed web databases and the DBMS. The developed APIs execute SQL queries, deliver data, manage database backup, and enact recovery procedures.
Fig. 13.

WANDA data backup system configuration
Just like DATALINK [39], the WANDA platform utilizes a backup copy of the database for restoring the database to one of four possible consistent states.
Offline backup state (OBS): The state when an offline backup was taken.
Quiescent point state (QPS): The state when no update was being allowed to the database.
Point-in-time state (PTS): Some arbitrary point-in-time state.
Current time state (CTS): The state at the time of crash.
Web and mobile applications
WANDA provides two different monitoring applications for healthcare providers, and they operate on the web server tier. One is a web application [40] and the other is a smartphone application. Both the web application (Fig. 14) and the smartphone application (Figs. 15 and 16) have functions to check patients’ weight, blood pressure, heart rate, daily questions, and calorie consumption. The interfaces of applications are clear, consistent, and communicative, so users do not need to worry about underlying file types, software architectures, and operating systems. Data can be viewed as graphs or tables. Also, the web application shows the statistical result of SMS answers. The graph mode shows the amount of calories burned in hourly-based format and other values in daily-based format using the length of the bar, spectrum of colors, and annotation (Figs. 15 and 16). The structure of the website and data display modes, fonts, and graph colors were defined in the meeting with caregivers who are users of this system.
Fig. 14.

WANDA web application
Fig. 15.
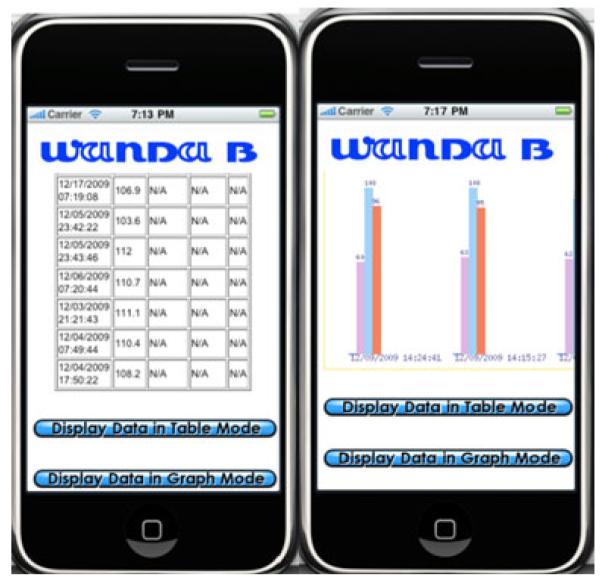
WANDA iPhone application
Fig. 16.
WANDA Andriod application
Access to the web application requires user verification in order to prohibit access by unauthorized users. The initial page asks for a user ID and a password that are provided to individuals in a private meeting. Healthcare providers can also add more patients and synchronize data via the WANDA webpage if necessary.
The iPhone’s 3.5-inch multi-touch display with 480-by-320-pixel resolution lets users navigate by touching the screen. The iPhone 3G uses a technology protocol called HSDPA (High-Speed Downlink Packet Access) to download data quickly over UMTS (Universal Mobile Telecommunications System) networks. In addition, its weight is only 135 g, making it easy to carry. Therefore, the WANDA iPhone application helps users access the WANDA web database data. Using a WANDA application on an iPhone enables caregivers to monitor patient status whenever and wherever they want. In the table mode, healthcare providers can check their patients’ daily question answers, weight, blood pressure, heart rate, and calorie expenditure. The table mode also provides statistical information. The graph mode displays each value as a color bar (Fig. 15).
We also built the WANDA system on the Droid™, another popular smart phone platform. The Droid One has a 3.7-inch screen with a 854-by-480-pixel resolution. The Droid One has weight similar to the iPhone’s weight, 169 g, and it also uses the same HSDPA protocol. Moreover, as the Droid One’s Google Android platform allows users to use Bluetooth API, we can directly get data from healthcare devices. When users start the application, they choose between ‘record’ and ‘history’ options. If a user chooses the record option, they are brought to a screen where they can choose the specific measurement they wish to take. After choosing the measurement type and following the instructions on the phone, the user can see the numerical data on the screen and the recorded data will be uploaded to the server. For the questionnaire option, the user can answer 12 questions and the answers will directly transmit to the web server. If the user presses the ‘history’ option, he is given the option of choosing to view a graph of weekly or monthly data. This function would assist users in monitoring their own personal health status.
Results
The WANDA study was approved by the UCLA institutional review board (IRB).IRB approves, monitors, and reviews biomedical and behavioral research involving humans with the aim to protect the rights and welfare of the research subjects.
Since November 30, 2009, the phone line version of the WANDA system has been used for health data collection on 26 different subjects. Patients have been recruited from three sites located in Los Angeles (UCLA Ronald Reagan Medical Center, Harbor-UCLA Medical Center, and Providence Holy Cross Medical Center). The recruitment pool is approximately 68% male; 40% White, 13% Black, 32% Latino, and 15% Asian/Pacific Islander, with a mean age of approximately 68.7±12.1. The gender distribution and anticipated age of participants are representative of the incidence and natural history of CHF. The combined ethnic distribution across the sites is generally representative of the population in the United States. Patients are included in the study if: 1) they have a diagnosis of CHF, 2) were recently hospitalized for CHF exacerbation during the past 30 days prior to enrollment, 3) had an age ≥65 years, and 4) lived independently. They were excluded if a) they had serious complicating comorbidities, untreated malignancies, or neurological disorders that impaired cognition, b) were unable to understand spoken English or Spanish, and c) if they had hearing or vision loss that was deemed major or uncorrected. They were all provided with Bluetooth weight scales, blood pressure monitors, Pods, and PAM devices. Daily questions (listed in Table 1) are delivered to each patient and monitored by WANDA.
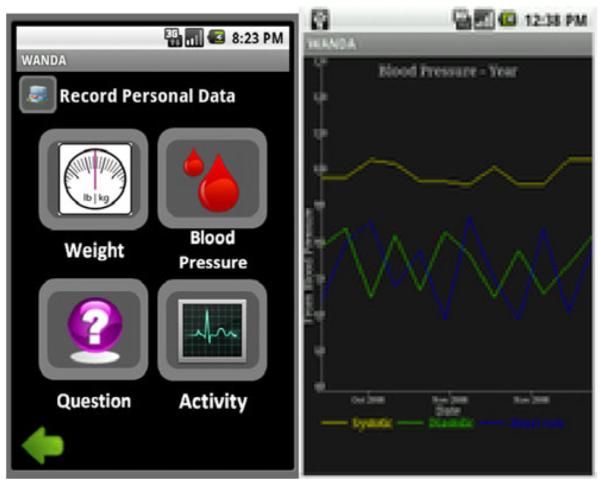
The study (Fig. 17) has enabled patients to reduce 5.6% of weight and blood pressure values that are out of the acceptable range given in Table 2. Test results show that the number of measurements that were out of the acceptable range was decreased as patients use the WANDA system.
Fig. 17.

Changes in Diastolic, systolic, HR values
A paired t-test was used in order to compare paired result values where both observations are taken from the same subjects. In order to use a paired t-test, Q–Q plot is applied (Fig. 18) for checking the normality of difference between the data. Those patients who participated in the test for more than 2 months were used in the analysis. The null hypothesis and the alternative hypothesis are given as below with 5% significant level.
Fig. 18.
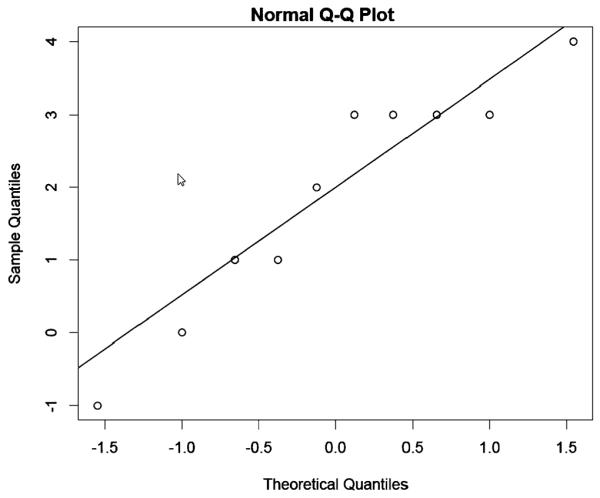
Normal Q–Q plot for weight data
Null Hypothesis (H0): The number of warnings during the first 15 days—The number of warnings during the last 15 days=0.
Alternative Hypothesis (H1): The number of warnings during the first 15 days—The number of warnings during the last 15 days >0.
Weight data received a t-value of 3.77 when applying the t-test method using the equation below. Therefore, the null hypothesis should be rejected for weight data with p-value=0.0022 which is less than 0.05.
The t-test in (6) assesses whether the means of two groups are statistically different from each other. This analysis is appropriate to compare the means of two groups, and especially appropriate as the analysis for our two-group randomized experimental design. For weight, the t-test results show that the WANDA study is effective for patients with CHF. Due to the high prevalence of obesity in the United States, Kenchaiah [6] suggests that strategies to promote optimal body weight may reduce the population burdened with CHF. In addition, an increase in weight indicates the retention of excess fluid, which requires increasing the dosage of diuretic medication to counteract fluid accumulation. Therefore, weight loss is highly related to improving patient quality of life.
| (6) |
Conclusion
CHF is a leading cause of death in the United States with approximately 670,000 currently afflicted Americans. Wireless health technologies, including pervasive sensors and wireless communications, can potentially help CHF patients through daily monitoring along with guidance and feedback. Patients who have cardiovascular system disorders can measure their weight, blood pressure, activity, and other health related measurements by using wireless health applications whenever and wherever they need to. A wireless health system gives real-time and computer-based analysis, reducing the need for specialist visits. This remote real-time care prevents emergency situations and alerts caregivers when they must help patients.
In this paper, we presented the Weight and Activity with Blood Pressure Monitoring System (WANDA).WANDA is built on a three-tier architecture. The first tier consists of sensors that measure patients’ health related measurements and transmits data to the second tier. WANDA utilizes a Bluetooth weight scale, blood pressure monitor, activity monitor, and questionnaire systems to collect health related measurements and transmit data. The second tier consists of web servers that receive data from the first tier and maintains data integrity. An abstraction of file formats and a shared ID table is used to merge WANDA data that is stored across several databases. In addition, when the obtained values are out of the acceptable range, the second tier sends alert messages to healthcare providers via text message or e-mail. The third tier is a back-end database server in WHI SOPHI that performs backup and recovery jobs by applying an offline backup. Using its backup log file and PHP APIs, the WHI SOPHI client application controls data delivery between distributed web databases and the DBMS.
WANDA was approved by the UCLA institutional review board (IRB), which authorizes and analyzes biomedical research related to humans for protecting their rights and welfare. This study was successful in reducing the number of weight and blood pressure readings that fell out of an acceptable range. For weight values, the paired t-test results show that the WANDA system is a potentially effective platform for aiding CHF patients.
Acknowledgements
The authors would like to acknowledge the funding sources: NIH/National Library of Medicine Medical Informatics Training Program Grant T15 LM07356, National Institute of Health-National Heart, Lung, and Blood Institute Grant 1R01HL093466-01, and NetScienctific. Dr. Evangelista also received support from the University of California, School of Nursing Intramural Research Grant and the University of California, Los Angeles, Resource Centers for Minority Aging Research/Center for Health Improvement of Minority Elderly (RCMAR/CHIME) under NIH/NIA Grant P30-AG02-1684. The content is solely the responsibility of the authors and does not necessarily represent the official views of the National Institute on Aging or the National Institutes of Health. We would like to thank Wen-Sao Hong, Victor Chen, Professor William Kaiser and Professor Alex Bui for their help.
Contributor Information
Myung-kyung Suh, Computer Science Department, University of California, Los Angeles, Los Angeles, CA, USA.
Chien-An Chen, Electrical Engineering Department, University of California, Los Angeles, Los Angeles, CA, USA chienanc@ee.ucla.edu.
Jonathan Woodbridge, Computer Science Department, University of California, Los Angeles, Los Angeles, CA, USA jwoodbri@cs.ucla.edu.
Michael Kai Tu, Biomedical Engineering IDP, University of California, Los Angeles, Los Angeles, CA, USA emtu@ucla.edu.
Jung In Kim, Department of Biostatistics, University of North Carolina, Chapel Hill, NC, USA jikim@email.unc.edu.
Ani Nahapetian, Computer Science Department, University of California, Los Angeles, Los Angeles, CA, USA ani@cs.ucla.edu; Wireless Health Institute, University of California, Los Angeles, Los Angeles, CA, USA.
Lorraine S. Evangelista, School of Nursing, University of California, Los Angeles, Los Angeles, CA, USA levangel@ucla.edu
Majid Sarrafzadeh, Computer Science Department, University of California, Los Angeles, Los Angeles, CA, USA majid@cs.ucla.edu; Wireless Health Institute, University of California, Los Angeles, Los Angeles, CA, USA.
References
- 1.Keith JD. Congestive heart failure. Pediatrics. 1956;18(3):491–500. [PubMed] [Google Scholar]
- 2.Lloyd-Jones D, Adams R, et al. Heart Disease and Stroke Statistics 2009 update: a report from the American Heart Association statistics committee and stroke statistics subcommittee. Circulation. 2009;119:e21–e181. doi: 10.1161/CIRCULATIONAHA.108.191261. [DOI] [PubMed] [Google Scholar]
- 3.Bundkirchen A. Epidemiology and economic burden of chronic heart failure. Eur. Heart J. Suppl. 2004:D57–D60. [Google Scholar]
- 4.Suh MK, Evangelista L, et al. An Automated Vital Sign Monitoring System for Congestive Heart Failure Patients; ACM International Health Informatics Symposium; 2010. [Google Scholar]
- 5.Suh MK, Evangelista L, et al. WANDA B.: Weight and Activity with Blood Pressure Monitoring System for Heart Failure Patients; IEEE Workshop on Interdisciplinary Research on E-Health Services and Systems; 2010. [Google Scholar]
- 6.Kenchaiah S, Evans JC, Levy D, et al. Obesity and the risk of heart failure. N. Engl. J. Med. 2002;34(5):305–313. doi: 10.1056/NEJMoa020245. [DOI] [PubMed] [Google Scholar]
- 7.Vasan RS. Impact of high-normal blood pressure on the risk of cardiovascular disease. N. Engl. J. Med. 2001;345(18):1291–1297. doi: 10.1056/NEJMoa003417. [DOI] [PubMed] [Google Scholar]
- 8.Haider AW. Systolic blood pressure, diastolic blood pressure, and pulse pressure as predictors of risk for congestive heart failure in the Framingham Heart Study. Ann. Intern. Med. 2003;138(1):10–16. doi: 10.7326/0003-4819-138-1-200301070-00006. [DOI] [PubMed] [Google Scholar]
- 9.Redfield MM. Burden of systolic and diastolic ventricular dysfunction in the community: appreciating the scope of the heart failure epidemic. JAMA. 2003;289(2):194–202. doi: 10.1001/jama.289.2.194. [DOI] [PubMed] [Google Scholar]
- 10.He J. Risk factors for congestive heart failure in US men and women: NHANES I epidemiologic follow-up study. Arch. Intern. Med. 2001;161(7):996–1002. doi: 10.1001/archinte.161.7.996. [DOI] [PubMed] [Google Scholar]
- 11.Hambrecht R. Regular physical exercise corrects endothelial dysfunction and improves exercise capacity in patients with chronic heart failure. Circulation. 1998;98(24):2709–2715. doi: 10.1161/01.cir.98.24.2709. [DOI] [PubMed] [Google Scholar]
- 12.Jurgens CY. Psychometric testing of the heart failure somatic awareness scale. J. Cardiovasc. Nurs. 2006;21(2):95–102. doi: 10.1097/00005082-200603000-00004. [DOI] [PubMed] [Google Scholar]
- 13.Chaudhry SI, et al. Randomized trial of telemonitoring to improve heart failure outcomes (Tele-HF): study design. J. Card. Fail. 2007;13(9):709–714. doi: 10.1016/j.cardfail.2007.06.720. [DOI] [PMC free article] [PubMed] [Google Scholar]
- 14.Chaudhry SI, et al. Telemonitoring in patients with heart failure. N. Engl. J. Med. 2010;363(24):2301–2309. doi: 10.1056/NEJMoa1010029. [DOI] [PMC free article] [PubMed] [Google Scholar]
- 15.Pharos Innovations. Pharos Innovations; 2011. http://www.pharosinnovations.com/ [Google Scholar]
- 16.Soran OZ, et al. Cost of medical services in older patients with heart failure: those receiving enhanced monitoring using a computer-based telephonic monitoring system compared with those in usual care: the heart failure home care trial. J. Card. Fail. 2010;16(11):859–866. doi: 10.1016/j.cardfail.2010.05.028. [DOI] [PubMed] [Google Scholar]
- 17.Soran OZ, et al. A randomized clinical trial of the clinical effects of enhanced heart failure monitoring using a computer-based telephonic monitoring system in older minorities and women. J. Card. Fail. 2008;14(9):711–717. doi: 10.1016/j.cardfail.2008.06.448. [DOI] [PubMed] [Google Scholar]
- 18.Alere. Alere; 2011. http://www.alere.com/ [Google Scholar]
- 19.Akshay S. Desai, et al. The circle from home to heart-failure disease management. N. Engl. J. Med. 2010;363:2364–2367. doi: 10.1056/NEJMe1011769. [DOI] [PubMed] [Google Scholar]
- 20.Zile MR, Bennett TD, St John Sutton M, et al. Transition from chronic compensated to acute decompensated heart failure: patho physiological sights obtained from continuous monitoring of intracardiac pressures. Circulation. 2008;118:1433–1441. doi: 10.1161/CIRCULATIONAHA.108.783910. [DOI] [PubMed] [Google Scholar]
- 21.UCLA Wireless Health Community. UCLA; 2011. http://www.wirelesshealth.ucla.edu/ [Google Scholar]
- 22.McHorney CA. The MOS 36-item Short-Form Health Survey (SF-36): III. Tests of data quality, scaling assumptions, and reliability across diverse patient groups. Med. Care. 1994;32(1):40–66. doi: 10.1097/00005650-199401000-00004. [DOI] [PubMed] [Google Scholar]
- 23.Ideal Life. Ideal Life; 2011. http://www.ideallifeonline.com/ [Google Scholar]
- 24.A&D. A&D Engineering, Inc.; http://www.andonline.com/ [Google Scholar]
- 25.Roving Networks. Roving Networks, Inc.; http://www.rovingnetworks.com/ [Google Scholar]
- 26.Jones NL. Clinical exercise testing. 2nd edition Saunders; Philadelphia: 1982. [Google Scholar]
- 27.Yamada Y. Light-intensity activities are important for estimating physical activity energy expenditure using uniaxial and triaxial accelerometers. Eur. J. Appl. Physiol. 2009;105(1):141–152. doi: 10.1007/s00421-008-0883-7. [DOI] [PubMed] [Google Scholar]
- 28.Hara T. The relationship between body weight reduction and intensity of daily physical activities assessed with 3-dimension accelerometer. Jpn. J. Phys. Fitness Sports Med. 2006;55(4):385–391. [Google Scholar]
- 29.Patel H. Reasons for seeking acute care in chronic heart failure. Eur. J. Heart Fail. 2007;9(6–7):702–708. doi: 10.1016/j.ejheart.2006.11.002. [DOI] [PubMed] [Google Scholar]
- 30.Antonsson EK. The frequency content of gait. J. Biomech. 1985;18(1):39–47. doi: 10.1016/0021-9290(85)90043-0. [DOI] [PubMed] [Google Scholar]
- 31.Karantonis DM. Implementation of a real-time human movement classifier using a triaxial accelerometer for ambulatory monitoring. IEEE Trans. Inf. Technol. Biomed. 2006;10(1):156–167. doi: 10.1109/titb.2005.856864. [DOI] [PubMed] [Google Scholar]
- 32.Google Maps API Family. Google; 2011. http://code.google.com/apis/maps/ [Google Scholar]
- 33.Liskov B. Keynote address-data abstraction and hierarchy. SIGPLAN Not. 1988;23(5):17–34. [Google Scholar]
- 34.Pettifer S. Visualising biological data: a semantic approach to tool and database integration. BMC Bioinform. 2009;10(suppl 6):S19. doi: 10.1186/1471-2105-10-S6-S19. [DOI] [PMC free article] [PubMed] [Google Scholar]
- 35.Bell GB. Matching records in a national medical patient index. Commun. ACM. 2001;44(9):83–88. [Google Scholar]
- 36.Noy NF. Semantic integration: a survey of ontology-based approaches. SIGMOD Rec. 2004;33(4):65–70. [Google Scholar]
- 37.SOPHI. UCLA; 2010. http://cs.ucla.edu/~ani/SOPHI/ [Google Scholar]
- 38.Mohan C. An efficient and flexible method for archiving a data base. SIGMOD Rec. 1993;22(2):139–146. [Google Scholar]
- 39.Bhattacharya S. Coordinating backup/recovery and data consistency between database and file systems. Proceedings of the 2002 ACM SIGMOD international conference on Management of data.2002. pp. 500–511. [Google Scholar]
- 40.WANDA. UCLA; 2011. http://www.wandab.net. [Google Scholar]