

Abstract
Peptide mass fingerprinting, regardless of becoming complementary to tandem mass spectrometry for protein identification, is still the subject of in-depth study because of its higher sample throughput, higher level of specificity for single peptides and lower level of sensitivity to unexpected post-translational modifications compared with tandem mass spectrometry. In this study, we propose, implement and evaluate a uniform approach using support vector machines to incorporate individual concepts and conclusions for accurate PMF.
We focus on the inherent attributes and critical issues of the theoretical spectrum (peptides), the experimental spectrum (peaks) and spectrum (masses) alignment. Eighty-one feature-matching patterns derived from cleavage type, uniqueness and variable masses of theoretical peptides together with the intensity rank of experimental peaks were proposed to characterize the matching profile of the peptide mass fingerprinting procedure. We developed a new strategy including the participation of matched peak intensity redistribution to handle shared peak intensities and 440 parameters were generated to digitalize each feature-matching pattern. A high performance for an evaluation data set of 137 items was finally achieved by the optimal multi-criteria support vector machines approach, with 491 final features out of a feature vector of 35,640 normalized features through cross training and validating a publicly available “gold standard” peptide mass fingerprinting data set of 1733 items. Compared with the Mascot, MS-Fit, ProFound and Aldente algorithms commonly used for MS-based protein identification, the feature-matching patterns algorithm has a greater ability to clearly separate correct identifications and random matches with the highest values for sensitivity (82%), precision (97%) and F1-measure (89%) of protein identification.
Several conclusions reached via this research make general contributions to MS-based protein identification. Firstly, inherent attributes showed comparable or even greater robustness than other explicit. As an inherent attribute of an experimental spectrum, peak intensity should receive considerable attention during protein identification. Secondly, alignment between intense experimental peaks and properly digested, unique or non-modified theoretical peptides is very likely to occur in positive peptide mass fingerprinting. Finally, normalization by several types of harmonic factors, including missed cleavages and mass modification, can make important contributions to the performance of the procedure.
In MS-based proteomics, MS1 or MS2, or even MSn, data for peptides produced by proteolysis are obtained and used for peptide mass fingerprinting (PMF),1 peptide fragment fingerprinting (PFF), and de novo sequencing for qualitative analysis or quantification of proteins. State-of-the-art proteomics has adopted the use of tandem MS (MS/MS) because of its growing usefulness in protein identification (1). PMF is often used in conjunction with the PFF method because of the comparative lack of accuracy. However, the practical choice between PMF and PFF is the subject of debate. PMF was the first commonly used method for protein identification and is still in widespread use, sometimes as a filtering process before MS/MS, which is expensive and time-consuming (1, 2).
As summarized by Damodaran et al. (3), there are two remarkable advantages of PMF that are often ignored in comparison to MS/MS analysis of a single peptide. First, the mass matching and scoring process of PMF is less sensitive than that of MS/MS to unexpected post-translational modifications. Second, using multiple peptides in PMF allows more extensive coverage of the protein, whereas MS/MS can be confused by common peptides shared by a number of different proteins. Thus, in some cases, MS/MS can be less specific than PMF for the analysis of a single peptide. Moreover, PMF allows a higher sample throughput than MS/MS. The PMF method would become more attractive in proteomics research if we could improve the accuracy of protein identification. With this motivation, several bioinformatics methods and tools have been developed and improved to identify proteins using PMF data. Henzel et al. (4) and Palagi et al. (5) have provided excellent reviews of the evolution of PMF as a method for protein identification.
Several parameters have been formalized and used in PMF in order to form an efficient scoring system. Shadforth et al. (6) have reviewed 13 well known and commonly used PMF algorithms. There are four important parameters used in most PMF searching tools: (1) the number of peptides matched; (2) the threshold for mass tolerance; (3) the percentage of sequence coverage; and (4) the number of missed cleavage sites. Additional parameters such as pI, molecular mass, post-modification, and chemical composition (7), methods such as a proteotypic peptide library (8) and integrated information (9) have been taken into account. The introduction of new parameters, such as spectrum similarity (10), mass spectra alignment (11), peak bagging (12), negative ionization (13), probability-based scoring function (14), peak intensity prediction (15, 16), mass accuracy (17, 18), mass tolerance (19), and a validation system (20) has improved the accuracy of PMF identification.
Scoring algorithms vary in sensitivity, selectivity and accuracy, and each has advantages, disadvantages and applications to each commonly used tool. In order to evaluate these algorithms, Chamrad et al. have reported the results of a study of performance in terms of specificity and sensitivity of the three most popular tools (21); i.e. Mascot (22), MS-Fit (23) and ProFound (24). They found the performance of Mascot and ProFound to be similar, correctly identifying around 53% of proteins from the reference set at a significance level of p < 0.05 but, surprisingly, MS-Fit correctly identified only 32% using the same input parameters.
In response to that disappointing evaluation of performance, new rigorous statistical methods have been used to integrate the scores returned by each algorithm. The strength of some packages can be exploited through such a consensus method, and weaknesses in others are mitigated, so that marginal identification can be corroborated or rejected by complementary packages (25, 26). Two generally similar analysis techniques termed multisearch and multipass have been developed for a tandem mass approach (27) and these consensus methods are now being adopted for large-scale projects (28) but are still not popular in smaller laboratories. The only significant shortcoming of those methods is the expense and difficulty in handling multiple search algorithms and scoring systems.
The objective of this study was to incorporate earlier conclusions and new strategies into one process. We proposed, implemented, and evaluated a machine learning approach to integrate a series of parameters for accurate and robust PMF. We focused on the inherent attributes and critical issues of theoretical spectrum (peptides), experimental spectrum (peaks), and spectrum (masses) alignment. Instead of assigning a statistical model or a scoring scheme for how well the identification was achieved, the machine learning approach, called support vector machines (SVMs), was applied to intelligently integrate a series of inherent features for protein identification without the dilemma of choosing a tradeoff between false positives and false negatives.
The study design was as follows: a multi-dimensional parameter space derived from theoretical peptides, experimental peaks, and mass alignment was initially constructed according to earlier conclusions and new strategies. A total of 81 feature-matching patterns for characterizing the PMF procedure were applied to extract features for the SVM approach. Second, a set of 35,640 normalized features vector was subjected to a multicriteria SVM to cross train and validate publicly available “gold standard” PMF sets of 1733 items. Finally, the optimal SVM model with 491 select features achieved a high-performance evaluation for standard PMF sets of 137 items.
EXPERIMENTAL PROCEDURES
Proteomics Data Set Collection
A high-quality data set, especially a training set, is essential to the machine learning approach. Highly confident (gold standard) PMF data should consist of a mass spectrum of the proteolytic digest of a single protein that has been positively identified by orthogonal methods, such as an antibody test, an ELISA assay, MS/MS-based identification, etc (19). We report our results using validated data from three different sources.
The Aurum data set presented by Falkner et al. (29) is a high-quality data set of 246 known human proteins expressed in Escherichia coli, purified by the use of N terminus T7 and HIS tags, further purified by SDS-PAGE and tryptic digestion and individually spotted 4 times for matrix-assisted laser desorption ionization/time of flight (MALDI-TOF)/TOF analysis. Data were acquired to represent at least the top 29 most intense MS peaks, and validated by the published decoy database.
The Avermectin data set presented by Yin (30) stemmed from a proteomics study of Streptomyces avermitilis protein complexes. With the optimized protein extraction protocol (31), the protein expression patterns of S. avermitilis during the onset of avermectin production in complex medium were analyzed. The obviously regulated proteins have been analyzed in detail by 2-dimensional electrophoresis TOF MS/MS analysis.
The YPRC data set was downloaded from ProteomeCommons.org, which was uploaded by the Yonsei Proteome Research Center. The identification results made available by Mascot and Aldente (32) can be downloaded from the ProteomeCommons.org Tranche network using given hash (see supplemental file, SI1-YPRCSourceHash).
Standard PMF Sets Construction
Raw spectra files (.t2d format) from the 3 proteomics datasets were subjected to software AuotDataexplorer@DataWisdom(v1.0), the automatic implementation of Data Explorer(v4.3), to extract m/z and automatically generate peak list files with peak intensity (.pmi format). To construct positive PMF sets, despite the pre-validation of each data set, all the proteomics data were subjected to software BatchMascot@DataWisdom(v1.0) to perform automated pipeline Mascot searching with default parameters. A PMF was assigned as positive only if the Mascot result was significant (expectation value E < 0.05) and the first ranked protein was identical with the true protein confirmed by the original data set provider using other methods.
During a PMF search procedure, a set of experimental peaks is matched to a massive database of theoretical peptides produced by protein in silico digestion. Because only one protein is expected to be distinct out of hundreds and thousands of candidate proteins, the negative PMF sets should be larger than the positive sets in order to provide sufficient and various information to train the machine learning approach. For each of the positive PMF data, insignificant proteins (expectation value E > 0.05) from the top 2–10 ranked proteins in the Mascot result list were paired and assigned as negative sets.
This procedure constructed a positive data set of 266 pair-wise PMF sets and a negative data set of 1604 pair-wise PMF sets from the three proteomics datasets (for detailed statistics, see supplemental file SI2-ProteomicDatasetStatistics). A ratio of 1:8 was applied to the positive plus negative PMF sets selected from the Aurum and Avermectin data sets to randomly extract the training set (DT) and a validating set (Dv). All the PMF sets selected from the YPRC data set were assigned to the evaluating set (DE). The statistics of each PMF set are given in Table I.
Table I. Statistics of each standard PMF sets. Training and validating sets are selected from both the Aurum and the Avermectin data sets. The ratio of positive to negative data is approximately 1:8. Evaluation sets are selected entirely from the YPRC data set.
| PMF Set Name | Positive | Negative | Source/Species |
|---|---|---|---|
| Training | 146 | 1184 | Aurum/Eukaryota + Avermectin/Bacteria |
| Validating | 43 | 360 | |
| Evaluating | 77 | 60 | YPRC/Eukaryota |
Multi-dimensional Parameter Space Construction
A typical PMF searching procedure starts with comparing the experimental peak m/z to the theoretical peptide mass. The three individual but complex objects of the experimental spectrum (peaks), the theoretical spectrum (peptides) and the spectrum (masses) alignment are worth intensive investigation during the PMF procedure (see Fig. 1).
Fig. 1.

An illustration of the PMF spectrum alignment. There are three objects in PMF-based protein identification. The experimental peak m/z is matched to the theoretical peptide mass with given mass tolerance. In this illustration, experimental peaks are sorted by intensity rank and theoretical peptide masses are sorted by cleavage order. There are one-to-one, one-to-many and many-to-many matching in the spectrum alignment because of the mass tolerance.
Each object was characterized by explicit, implied and statistical parameters, which were classified into three categories, spectrum attributes, alignment statistics and SVM parameters, according to their formative stages as shown in Fig. 2.
Fig. 2.

Parameter categories and formative stages of the experimental spectrum, the theoretical spectrum and spectrum alignment. Parameters derived from the theoretical spectrum, the experimental spectrum and spectrum alignment in the PMF procedure are indicated as cyan, orange, and purple, respectively. Implied and explicit attributes of each spectrum generate several new statistics in spectrum alignment, from which statistical parameters are generated for the SVM approach. (Detailed abbreviations are listed in supplemental file SI3-ParametersTable.)
The experimental spectrum, the theoretical spectrum and the spectrum alignment have parameters of 14, 17, and 11, respectively (see supplemental file SI3-Parameters Table). Those 42 parameters contributed mainly to the multi-dimensional parameter space. In this section, we discuss the newly applied parameters of each object.
Newly Applied Parameters of the Experimental Spectrum (ES)
An experimental spectrum or peak list of length n is a list
of experimental peak
Each experimental peak has a m/z
and an original intensity (henceforth, refers specifically to peak relative intensity)
where ℝ + means the set of nonnegative real numbers.
Peak Intensity Proportion (esPIP)
The extraction of m/z from spectra is a signal processing task that cannot be done perfectly. Data from this domain are always very noisy and contain errors introduced by preprocessing steps in the wet laboratory as well as in the signal processing. Values of peak original intensity can be distorted because of the inconsistent scale of different spectra. Therefore, esPIP was proposed to normalize the flexible peak original intensity:
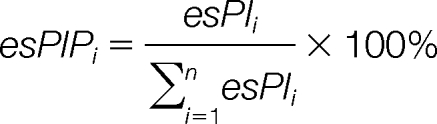 |
Here, the individual peak original intensity is divided by the sum of all intensities, so that the sum of the peak intensity proportion in each peak list equals 1:
 |
Peak Intensity Rank (esPIR)
In addition, the inherent attribute esPIR was introduced to fully eliminate the absolute rank of a given peak original intensity or intensity proportion. We obtained a new parameter, the experimental peak intensity rank
when a typical experiment spectrum, normally displayed by m/z order, was sorted by descending order of peak intensity. The esPIR of highest intense peak is 1.
Parameter Series of Top Matching
Parameter series of top matching describe the matching profile of the top intense peaks in the experimental spectrum. The range of top intensity rank (TopIR) is initialized with 10, and it will be optimized in a later section.
The matched peak intensity set (esPIsmatched), the matched intensity ranks set (esPIRsmatched) and the matched intensity proportion set (esPIPsmatched) of t matched experimental peaks are defined as:
The top matching value (esTMV), top matching peak intensities esTMI and top matching peak intensities proportion (esTMIP) are calculated as:
 |
 |
 |
The harmonic factors total matched peak intensities (esMI) and total matched peak intensities proportion (esMIP) are calculated as:
 |
 |
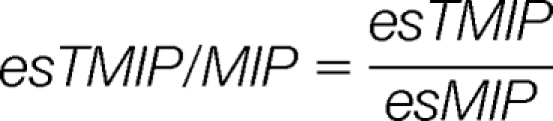
Then, four harmonized parameters esTMI/MI, esTMI/TMV, esTMIP/MIP, and esTMI/TMV are calculated as:
 |
 |
 |
 |
Newly Applied Parameters of the Theoretical Spectrum (TS)
A theoretical spectrum or peptide list of length m is a list
of theoretical peptides tsPj ∈ M. Each peptide has a mass:
Peptide Cleavage Order (tsPCO)
In TS = {tsp1, …, tspm}, the subscript numbers from 1 to m indicate the original order of the theoretical cleavage sites from N terminus to C terminus in the protein sequence. In other words, those theoretical peptides are located in the protein sequence according to its tsPCO from N terminus to C terminus.
Peptide Cleavage Type (tsPCT)
tsPCT indicates the type of cleavage that generated the peptide, which can be proper cleavage or missed cleavage. We have divided the missed cleavage type into theoretical missed cleavage and random missed cleavage. Siepen (33) presented a simple predictive method based on information theory that was able to identify experimentally defined missed cleavages with up to 90% accuracy from amino acid sequence alone. We used the web tool available at http://ispider.smith.man.ac.uk/MissedCleave to predict theoretical missed cleavage sites from random missed cleavages.
Peptide Mass Altering (tsPMA)
Because of differences of protease specificity, chemical composition of the protein and digestion environment, the in silico digestion should take differences of mass into consideration for theoretical peptides. Here, tsPMA is commonly classified into three categories of modification: none, fixed, and variable.
Peptide Uniqueness (tsPUN)
Another implied property for each theoretical digested peptide is the repeat number of its sequence in the whole protein sequence database. A peptide is classified as unique if it exists in only one protein. A local secondary database PUD (peptide uniqueness database) derived from SwissProt (version 57.12) has been constructed to generate tsPUN for each peptide.
Parameter Series of Consecutive Matching
Presumably, when matched theoretical peptides are distributed contiguously rather than randomly within a protein sequence, the protein is more likely to be a true protein rather than a false one. Neighbor-matching concepts, such as KSDP (34) and NMOWSE (14), have been used successfully in MS/MS and PMF, respectively. In this study, we expanded the parameter series of consecutive matching to describe the matching profile of a theoretical spectrum.
The consecutively matched peptides number set (tsCMNsc_matched), consecutively matched intensities set (tsMIsc_matched) and consecutively matched intensities proportion set (tsMIPsc_matched) of c segments of consecutively matched theoretical peptides are defined as:
tsCMNsc_matched = {the number of cleavage order in each segment −1: segments consisting of consecutive cleavage orders of matched theoretical peptides} of length c
tsMIsc_matched = {sum of experimental peak intensity matched to consecutive cleavage orders in each segment: segments consisting of consecutive cleavage orders of matched theoretical peptides} of length c
tsMIPsc_matched={sum of the experimental peak intensity proportion matched to the consecutive cleavage orders in each segment: segments consisting of consecutive cleavage orders of matched theoretical peptides} of length c
The discretely matched peptides number (tsCMNd_matched), discretely matched intensities (tsMId_matched) and discretely matched intensities proportion (tsMIPd_matched) of all discretely matched theoretical peptides are defined as:
tsCMNd_matched = sum of the number of discrete single cleavage order of matched theoretical peptides
tsMId_matched = sum of the experimental peak intensity matched to the discrete single cleavage order of matched theoretical peptides
tsMIPd_matched = sum of the experimental peak intensity proportion matched to the discrete single cleavage order of matched theoretical peptides
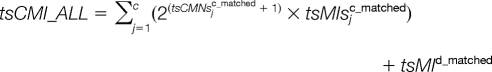
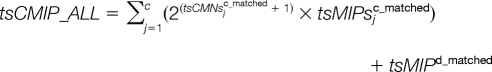
The consecutive matching value (tsCMV), consecutive matching peak intensities (tsCMI) and consecutive matching peak intensities proportion (tsCMIP) are calculated as:
 |
 |
 |
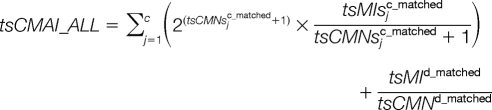
To take average peak intensity into consideration, the consecutive matching average peak intensities (tsCMAI) and consecutive matching average peak intensities proportion (tsCMAIP) are varied as:
To take all the matched peptides into consideration, these five parameters can be adapted as:
 |
 |
 |
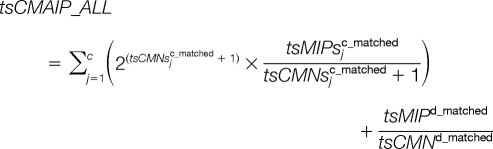 |
Newly Applied Parameters of Spectrum Alignment
Matched Peak Intensity Redistribution (MPIR)
A spectrum alignment is commonly done by matching masses with a predefined mass tolerance between two spectra of
A single and simple matching is a bijective process that can be described as:
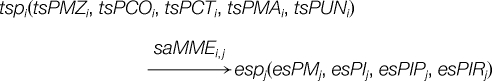 |
where saMME is matched mass error in spectrum alignment:
However, the bijective procedure would result in a many-to-many rather than a bijection matching because of the mass tolerance. Many-to-many mapping introduces a new difficulty in recalculating matched peak intensity for each matching. It is known that peak intensity is additive. The -trimmed mean has been used to deal with one-to-many (15). For the many-to-one case, two or more theoretical peptides that are matched to the same experimental peak should share the intensity of the latter. In our study, a new strategy that we have named matched peak intensity redistribution (MPIR) was used to recalculate peak intensity or peak intensity proportion for each matched theoretical peptide.
Because of different types of cleavage and peptide modification, a given peptide will generate several masses during proteolysis. As shown in Fig. 3, there are nine probable approaches to generate different theoretical peptide masses for a given peptide. Obviously, those theoretical peptide masses have different distributions of occurrence. Instead of evaluating the prior probability of each occurrence, we assigned a distribution weight to each approach. Each of the nine theoretical peptide masses for a given peptide has a distribution weight (tsPMDW), which is the product of the weights of its cleavage type and peptide modification. Initially, we assigned 1 to each approach weight. The optimized weights are inspected in a later section.
Fig. 3.

Probable approaches to generate theoretical peptide masses for a given peptide. During proteolysis, a peptide can be generated through any of three types of cleavage: proper, theoretical missed, and random missed. The peptide can suffer no modification or one or more fixed or variable modifications. The theoretical peptide masses have different distributions of occurrence. Instead of evaluating prior probabilities of occurrence, we assign a distribution weight to each approach. Each of 9 theoretical peptide masses for a given peptide has a distribution weight (tsPMDW), which is the product of the weights of its cleavage type and peptide modification.
In MPIR, a matched peptides cluster (MPC) contains several theoretical peptides with very close masses. A many-to-one matching can be initially described as:
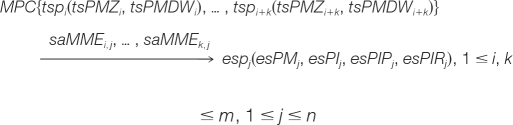 |
The matched peptide redistributive intensity (saMPRI) for each matched theoretical peptide is recalculated according to:
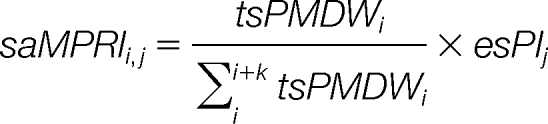 |
Then, a many-to-one matching can be redescribed as:
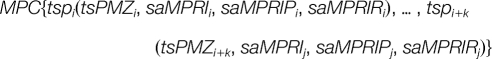 |
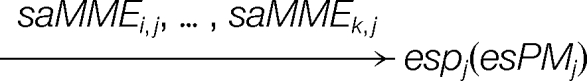 |
Each saMPRI of one matched peptide would be summarized for one-to-many or many-to-many matching. All of the saMPRI values together with other nonmatched peak intensities are then re-ranked to generate a new peak intensity rank for each matched peak.
Parameter Series of Matched Mass Error
Jain (19) investigated the distributions of mass error threshold obtained from the Aurum data set using the Kolmogorov-Smirnov test for missed cleavages of 0 and 1. The distributions indicated that there was a difference in the average and median mass tolerance for missed cleavages of 0 and 1, which motivated us to propose a parameter series of matched mass error to extensively describe the spectrum alignment.
saMME is the absolute error between matched theoretical peptide mass and experimental peak m/z
saMEM is the mean value of matched mass errors
saMESD is the standard deviation of matched mass errors
saMECV is the coefficient variation of matched mass errors
The matched mass error set (saMMEsmatched), the matched peak redistributed intensity set (saMPRIsmatched) and the matched peak redistributed intensity proportion set (saMPRIPsmatched) of s mass alignments are defined as:
Then, the two parameters matched peak intensity and intensity proportion compounded with mass error are harmonized as:
 |
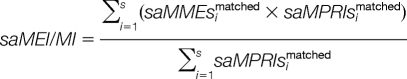 |
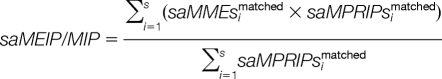 |
Feature-matching Pattern (FMP) and SVM Feature Extraction
In this study, we assigned the three attributes of PCT, PUN, and PMA to a theoretical peptide and one attribute, PIR, to the experimental peak as shown in Fig. 4A. Each attribute has two values, which are digitalized as 1 and 0. When considering all the values of one attribute, an asterisk (*) is assigned to it and then each attribute has three statuses: 0, 1, and *.
Fig. 4.

Construction of 81 FMPs in SVM feature space. There are three statuses for each attribute of a theoretical peptide and experimental peak. A, Status * means consideration of both 1 and 0. For single mass alignment, the number of all possible attribute combination is 81 (34). All these attribute combinations provide 81 FMPs for spectrum alignment in the SVM feature space. B, A total of 55 parameters multiplied by 8 harmonic factors are calculated for each FMP. The 35,640 (81 × 55 × 8) features are assembled to describe the PMF procedure in detail.
A PMF procedure consists of a set of mass alignments between theoretical peptides and experimental peaks. For a given matching, each attribute of the related theoretical peptide and the experimental peak has one certain status and those four items of status generate one FMP for a given mass alignment. The number of all possible combinations of statuses is 81 (34), which categorize mass alignments into 81 FMPs (Fig. 4B and see supplemental file SI4-FMP).
In an attempt to describe the matching profile of a PMF procedure in as much detail as possible, we calculated 440 SVM features for each FMP as described below.
First, 29 statistical SVM parameters from parameter space are calculated for each FMP. To eliminate the negative effect of the number of experimental peaks, theoretical peptides and mass alignment, parameters 15–23, 25–34, and 36–42 are normalized by esMatchedNum (esMN, the number of matched experimental peaks), tsMatchedNum (tsMN, the number of matched theoretical peptides), and saAlignNum (saAN, the number of mass alignment) respectively, which increases the number of SVM parameters from 29 to 55. Further, these 55 parameters are normalized by eight harmonic factors to eliminate the effect of protein size (see supplemental file SI5-HF).
Hence, for a spectrum alignment, there are 35,640 features calculated from 81 (the number of feature-matching pattern) multiplied by 55 (the number of parameters for one feature-matching pattern) and by eight (harmonic factors).
SVM Implementation with Multi-criteria Evaluation
SVM is a supervised learning method that is widely used to solve binary classification problems; we used the LIBSVM 2.91(35) software in this work. A radial basis function was selected as the kernel function. Two parameters, the regularization parameter C and the kernel width parameter g, were optimized using a grid search approach.
In this study, positive instances were collected from double-checked PMF data sets, and there were eight times more negative instances than positive instances. However, for handling unbalanced datasets, accuracy might not be a good criterion for evaluating a model. Maximizing accuracy would encourage predictors to favor the majority group; for example, a predictor will achieve an accuracy of 88.89% in a 1:8 positive/negative data set by simply predicting all samples as negative. We applied implementation of binary class cross-validation with different criteria (36) to enable LIBSVM to conduct cross-validation and prediction with respect to different criteria. The six measurements used in our SVM approach are given in Table II.
Table II. Six evaluation criteria. TP, true-positive; FP, false-positive; TN, true-negative; FN, false-negative.
| Measurement | Abbreviation | Equation |
|---|---|---|
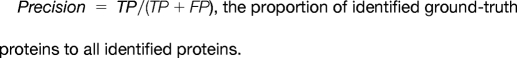
| Precision | Prec. | TP/(TP + FP) |
| Sensitivity (Recall) | Sens. | TP/(TP + FN) |
| Accuracy | Acc. | (TP + TN)/(TP + TN + FP + FN) |
| F-score | Fs. | 2 × Precision × Recall/(Precision + Recall) |
| Balanced Accuracy | BAC | (Sensitivity + Specificity)/2 |
| Area under the ROC Curve | AUC |
F-score-based Binary Partial Feature Selection
In addition to setting the proper parameters, feature subset selection can improve the accuracy of SVM classification. The F-score is a simple technique that measures the discrimination of two sets of real numbers. Given training vectors xk, k = 1, 2, …, m, if the number of positive and negative instances are n+ and n−, respectively, then the F-score of the ith feature is defined as (37):
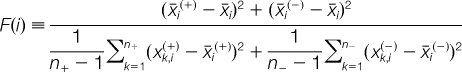 |
Where x̄i, x̄i(+), and x̄i(−) are the averages of the ith feature of the whole, positive and negative data sets, respectively; x̄k,i(+) is the ith feature of the kth positive instance, and x̄k,i(−) is the ith feature of the kth negative instance. The numerator indicates the discrimination between the positive and negative sets, and the denominator indicates the discrimination within each set. The larger the F-score, the more likely this feature is to be more discriminative.
Like a binary search, which searches a sorted array by repeatedly halving the search interval, the F-score-based binary partial feature selection begins with fivefold cross-validation of the whole sorted feature array, which is then divided into two parts according to the mean F-score. If fivefold cross-validation of the upper partial features is not less than that of the initial whole features, the new partial features are restricted to the upper half; otherwise, the lower half is included. The new partial features are repeatedly cross-validated until the minimum but sufficient feature set is found.
The F-score-based binary partial feature selection procedure consists of five steps
Step 1. Calculate the F-score for each feature. Here, we use modified script fselect.py (37) to calculate F-score only.
Step 2. Sort F-score by descending order; use fivefold cross-validation to train the training set DT with whole features and obtain a predictor. Use the predictor to predict the validating set DV. Assign the evaluation value AUC with whole features as initial EV+ and the evaluation value AUC of one feature with the highest F-score as initial EV–. Calculate the mean F-score of the whole features.
Step 3. Select features whose F-scores are higher than the mean to be the new partial features. Use fivefold cross-validation to train the training set DT with the new partial features and obtain a new predictor. Use the new predictor to predict validating set DV. Assign the evaluation value AUC as the new EV+ if it is more sufficient than the previous EV+; otherwise, assign it as the new EV–.
Step 4. Calculate the mean F-score of the new partial features assigned EV+ and EV–. Repeat step 3 based on the new mean F-score.
Step 5. Repeat step 4 until the minimum but sufficient feature set is found.
Comparison Workflow of PMF-based Algorithms
Implementation of PMF-based Algorithms
The feature-matching pattern-based algorithm described here was compared with the four most commonly used PMF-based algorithms, Mascot (http://www.matrixscience.com), MS-Fit (http://prospector.ucsf.edu), ProFound (http://prowl.rockefeller.edu/prowl-cgi/profound.exe) and Aldente (http://expasy.org/tools/aldente). A series of automatic implementation of the four algorithms (BatchMascot@DataWisdom(v1.0), BatchMS-Fit@DataWisdom(v1.0), BatchProFound@DataWisdom(v1.0) and BatchAldente@DataWisdom(v1.0)) were used for automated pipeline database searching and to extract and store the information necessary for further analysis (38). In order to establish an objective comparison, a set of standard parameter and a standard comparing set (DC) were developed for all PMF-based algorithms. The comparing set (DC) was selected from the Aurum data set, which contains 225 proteins with identity confirmed by analysis of at least two peptides via tandem mass spectrometry (see supplemental file, SI6-ComparingSetResult). All the PMF sets from DC were assigned as positive.
The standard search parameters are summarized in Table III. The variable oxidation of methionine and the complete carbamidomethylation of cysteine were investigated because of the sample preparation procedure (19).
Table III. Standard parameters set for the PMF search engines.
| Parameter | Algorithm |
||||
|---|---|---|---|---|---|
| FMP | Mascot | MS-Fit | Aldente | ProFound | |
| Database | SwissProt | NCBI nr | |||
| Taxonomy | Homo sapiens(human) | ||||
| Maximum missed cleavage sites | 1 | ||||
| Cleavage enzyme | Trypsin | ||||
| Fixed modifications | Carbamidomethyl(C) | Iodoacetamide (C) | |||
| variable modification | Oxidation(M) | ||||
| Mass Type, Charge state | Monoisotopic, MH+ | ||||
| Mass tolerance | 100ppm | ||||
Evaluation Criteria
The PMF search results were assessed automatically using rigorous criteria. The evaluation was based on the first identifications ranked by the PMF programs; all other ranks were ignored. The putative protein hits were classified on the basis of their score and whether they were correct. The hit was assigned as true positive if the score for a correct protein hit was above the threshold or as false positive if the score was below the threshold. Each algorithm has its own significance criterion to evaluate the quality of its search result (24). The thresholds for each algorithm are given in the supporting information (see supplemental file, SI6-ComparingSetResult).
We use standard performance metrics in information retrieval, including precision, recall and F1-measure, to evaluate the identification performance and their definitions are:
TP: the number of true positives (correct hits with scores above the threshold)
FP: the number of false positives (incorrect hits with scores above the threshold)
P: the number of all ground-truth proteins
 |
 |
RESULTS
Feature Selection
The accuracy, speed and interpretability of a machine learning approach can be improved by reducing the number of features. The main task for feature selection is to reduce the size of input feature space and reveal only the discriminant features for a given task.
First, a feature matrix of 1743 items from DT and DV plus 35,640 features was calculated. The F-scores of each feature were calculated and sorted by descending order (see supplemental file SI7-Fscore_35640Features). Second, we obtained a minimum but sufficient partial features of 491 after cross-validation 14 times in six rounds according to the procedure of F-score-based binary partial feature selection (see supplemental file SI8-BinaryPartialFeatureSelection).
The 11 out of 55 SVM parameters that contributed to 491 select SVM features are given in Table IV. Traditional parameter series of counting, tsMatchedNum and esMatchedNum play the same important roles in other protein identification methods. tsMatchedNum and esMatchedNum are used to calculate sequence coverage and mass value matched. However, there is an important distinction in the connotative meaning of such parameters. Unlike the new parameter saAlignNum used to describe spectrum alignment, tsMatchedNum and esMatchedNum do not score the whole matched peaks or peptides (refer to FMP HF0_****) but describe mainly other special feature matching patterns (see supplemental file SI9-MatchedNumDistribution).
Table IV. Average F-score of 11 select SVM parameters that contributed to the SVM approach.
| Rank | Average F-score | Parameter ID | Symbol | Count | Object |
|---|---|---|---|---|---|
| 1 | 2.947693 | esMatchedNum | esMN | 66 | ExperimentalSpectrum |
| 2 | 2.937659 | esMatchedIntensitiesProportion | esMIP | 65 | ExperimentalSpectrum |
| 3 | 2.915842 | esTopMatchingValue | esTMV | 64 | ExperimentalSpectrum |
| 4 | 2.906978 | saAlignNum | saAN | 65 | SpectrumAlignment |
| 5 | 2.844247 | tsMatchedNum | tsMN | 60 | TheoreticalSpectrum |
| 6 | 2.793061 | esTopMatchingIntensities | esTMI | 44 | ExperimentalSpectrum |
| 7 | 2.714127 | esTopMatchingIntensities/TopMatchingValue | esTMI/TMV | 74 | ExperimentalSpectrum |
| 8 | 2.563682 | esMatchedIntensities | esMI | 41 | ExperimentalSpectrum |
| 9 | 2.555365 | esTopMatchingrIntensitiesProportion | esTMIP | 8 | ExperimentalSpectrum |
| 10 | 2.271217 | tsConsecutiveMatchingValue_All | tsCMV_All | 3 | TheoreticalSpectrum |
| 11 | 2.206425 | tsConsecutiveMatchingValue_All/tsMatchedNum | tsCMV_All/tsMN | 1 | TheoreticalSpectrum |
Table V ranks 21 out of 81 FMPs that contributed to the 491 select SVM features. It is interesting that FMP ***1 has displaced feature matching pattern **** (rank 2) and ***0 (rank 17) as the top rank, which indicates that experimental peaks with top rank intensity contribute more to the performance than any other peak.
Table V. Average F-score of 21 select feature matching patterns that contributed to the SVM approach.
| Rank | Average F-score | FMP | Count | Rank | Average F-score | FMP | Count | Rank | Average F-score | FMP | Count |
|---|---|---|---|---|---|---|---|---|---|---|---|
| 1 | 3.260269 | ***1 | 49 | 8 | 2.739475 | 1*11 | 32 | 15 | 2.592058 | 111* | 10 |
| 2 | 3.098448 | **** | 34 | 9 | 2.714126 | 1*1* | 25 | 16 | 2.577115 | 1111 | 19 |
| 3 | 2.965369 | 1**1 | 59 | 10 | 2.699814 | 11*1 | 36 | 17 | 2.546275 | ***0 | 5 |
| 4 | 2.919236 | 1*** | 40 | 11 | 2.686240 | *111 | 18 | 18 | 2.497017 | 1**0 | 4 |
| 5 | 2.812000 | *1*1 | 34 | 12 | 2.657608 | *11* | 11 | 19 | 2.341434 | *1*0 | 4 |
| 6 | 2.800935 | **11 | 37 | 13 | 2.630326 | *1** | 23 | 20 | 2.334302 | **10 | 4 |
| 7 | 2.770610 | **1* | 26 | 14 | 2.629654 | 11** | 20 | 21 | 2.232498 | 1*0* | 1 |
Fig. 5 demonstrates the contribution of four attributes and their own three statuses. At first glance, statuses 1 and * of all attributes were the main contributors to the performance. There are four important points: first, proper digestion of theoretical peptides contributes more than missed digestion. Second, unique peptides other than repetitive peptides have a marked effect on performance. Third, changes of mass including fixed and variable modifications play a supplementary role for the original mass. Lastly, top-rank intensity experimental peaks have a dominant effect on performance and experimental peaks with medium and low intensity have a comparable importance at the same time.
Fig. 5.

Comparison of average F-score and numbers for each attribute and its status contributing to the SVM approach. A, The numbers of each attribute and its status are compared. Bars marked cyan, green, orange, and purple are statuses PCT, PUN, PMA, and PIR, respectively. It is obvious that statuses * and 1 of each attribute contribute most to the SVM approach. B, The average F-score of each attribute and its status in the SVM approach are compared. Bars marked cyan, green, and orange are statuses *, 1 and 0, respectively. Status 0 of PMA and PIR play a complementary role in the procedure.
Average F-scores of each harmonic factor are given in Table VI. Normalization by different harmonic factors has higher average F-scores than the original value, which proves that it is necessary to eliminate the bias derived from large proteins in the experimental spectrum.
Table VI. Average F-score of eight harmonic factors that contributed to the SVM approach.
| Rank | Average F-score | HF | Brief Explanation |
|---|---|---|---|
| 1 | 3.181443 | HF2 | ×(ProperCleavage_AlignNum/Protein_PepNum) |
| 2 | 3.022322 | HF7 | ×(All_AlignNum/Protein_PepNum) |
| 3 | 2.771980 | HF3 | ×(ProperCleavage_UniquePep_AlignNum /Protein_PepNum) |
| 4 | 2.730673 | HF4 | ×(ProperCleavage_UniquePep_TopIR_AlignNum /Protein_PepNum) |
| 5 | 2.675682 | HF6 | ×(ProperCleavage_UniquePep_NoneModification_TopIR_AlignNum /Protein_PepNum) |
| 6 | 2.547795 | HF1 | /Protein_PepNum |
| 7 | 2.500550 | HF5 | ×(ProperCleavage_UniquePep_NoneModification_TopIR_AlignNum /Protein_PepNum) |
| 8 | 2.355268 | HF0 | None |
Optimizations in the later studies were based on the 491 selected features.
Optimization of MPIR Parameters
We used two steps (orthogonal test design plus response surface methodology) to optimize four parameters: peptide mass distribution weights for missed cleavage and mass altering in MPIR.
First, an orthogonal test design L9(3)4 was used to find the appropriate range for each parameter. Nine sets of MPIR (weight of proper cleavage and none mass modification are pre-assigned 1) were applied to DT, which gave nine values of CV AUC for each run. Four parameter ranges of MPIR were determined from their effects on the CV AUC of DT (for a table of orthogonal test design, results and analysis, see supplemental file SI10–491-MPIR-OTD).
Second, response surface methodology was used to find the optimum parameters. Low and high actual values of each parameter were set according to the parameter ranges determined from orthogonal test design (see supplemental file SI11–491-MPIR-RSM). A total of 30 runs of MPIR were applied to DT, DV, and DE to generate SVM sets (weight of proper cleavage and non-modification of mass are pre-assigned 1). We analyzed the results from 30 runs of SVM performance on DE and derived a polynomial formula to fit the experimental data. The F-value of the model was significant, which made the model practicable. Three curves (Fig. 6) illustrate the interaction of the parameters theoretical missed cleavage, random missed cleavage, fixed modification and variable modification on the balanced accuracy (BAC) of DE.
Fig. 6.

Response surface of the interaction of the parameters theoretical cleavage, random cleavage, fixed modification, and variable modification on the BAC of DE. The parameters random cleavage, fixed modification, and variable modification are set at 0.99, 0.80, and 0.1, respectively, to plot response surfaces for the interaction of theoretical cleavage on the BAC of DE. Each plot has convergent ranges and a highest point with a predictive value.
The predictive optimum values for A (theoretical missed cleavage), B (random missed cleavage), C (fixed modification), and D (variable modification) are 0.75, 0.85, 1.09, and 0.33, respectively. Contours for each interactive parameter are shown in Fig. 7.
Fig. 7.

Contour diagrams of the predictive maximum BAC of DE generated by each optimum parameter. The contour diagrams are drawn to show the optimum parameters and the predictive maximum BAC of DE. The predictive optimum values for A (theoretical missed cleavage), B (random missed cleavage), C (fixed modification), and D (variable modification) are 0.75, 0.85, 1.09, and 0.33, respectively.
The optimum values of each MPIR parameter were used in DT and DE to evaluate the optimum performance. The optimum BAC of DE is 0.883117, which is among the highest ranks of performance and those optimum MPIR parameters were used in the next part of the study.
Optimization of the Number of Experimental Peaks
The extraction of PMF from experimental spectra is a signal processing task that is affected by mass calibration, S/N, threshold of m/z and intensity etc. Except peak mass and intensity, the number of peaks extracted from a given experimental spectrum can vary between laboratories and even between different operators in the same laboratory. However, neither insufficient nor redundant peaks have a positive influence on protein identification. The former cannot provide sufficient information and the latter might mislead the algorithm by offering redundant information. For these reasons, it is necessary to optimize the peak number used for protein identification. We used a progressive approach strategy to determine the optimum peak number.
First, the top 2n × 10(0 ≤ n ≤ 6) peaks of each PMF set in DT, DV, and DE were selected and used for the SVM approach. Training models from DT were applied to evaluate DE (see supplemental file SI12–491-EPnum). A range 2 ≤ n ≤ 4 of potential high performance was determined by analyzing 7 groups of performance evaluation of DE (see Fig. 8A).
Fig. 8.

Evaluation performance for the optimization of experimental peak number and top rank range of experimental peak intensity. In A, n = log2 (Experimental peak number/10) (0 ≤ n ≤ 6). First, seven runs of evaluation of DE are used to find the potential high-performance range. Another five stepwise runs of evaluation of DE are used to find the best experimental peak number, 75, to obtain the highest BAC and accuracy of DE. In B, m = log2 (Top rank range of experimental peak intensity/5) (0 ≤ m ≤ 4) and –1 is specifically for range 0. First, six runs of evaluation of DE are used to find the potential high-performance range. Another two stepwise runs of evaluation of DE are used to find the best top rank range of experimental peak intensity, 30, to achieve the highest BAC and accuracy of DE.
Second, progressive peak numbers were further investigated by refining n between 2 and 4. By approaching the highest AUC, BAC, precision and accuracy of DE, the optimum experimental peak number was determined as 75, which was kept constant for the rest of the study.
Optimization of the Top Rank Range of Experimental Peak Intensity
On the basis of the inference that intense peaks should contribute more to protein identification, a parameter series of top matching was aimed mainly at highlighting the effect of intense peaks on performance. It is useful to determine the top rank of experimental peak intensity. Here, we used a progressive approach to determine the optimum top rank.
First, top rank ranges of 2m × 5(0 ≤ m ≤ 4) with an additional 0 were used to train DT and to predict DV. Training models were then used to evaluate DE (see supplemental file SI13–491-TIR). A range 2 ≤ m ≤ 3 of potential high performance was found by analyzing 6 groups of the evaluation parameter DE (see Fig. 8B).
Second, progressive top rank ranges were investigated further by refining m between 2 and 3. By approaching an AUC of 1, precision of 100% and the greatest accuracy, recall, F-score and BAC of DE, the top rank range of experimental peak intensity was set at 30 as the default optimum value.
Comparative Evaluation of PMF-based Protein Identification Algorithms
Standard MALDI fingerprint data sets (255 items) were analyzed with Mascot, MS-Fit, ProFound, Aldenet and FMP using a set of identical search parameters (see supplemental file, SI6-ComparingSetResult) and Table VII gives the performance comparison.
Table VII. The performance of different algorithms on the standard PMF data set of 225 items.
| Parameter | Algorithm |
||||
|---|---|---|---|---|---|
| Mascot | MS-Fit | ProFound | Aldente | FMP | |
| TP | 139 | 91 | 79 | 109 | 190 |
| FP | 48 | 126 | 30 | 12 | 4 |
| Sensitivity | 62% | 40% | 35% | 48% | 84% |
| Precision | 74% | 42% | 72% | 90% | 98% |
| F1-measure | 67% | 41% | 47% | 63% | 91% |
Mascot and MS-Fit have achieved performances similar to that reported by Chamrad et al. (24). Among the algorithms that use the MOWSE score, Mascot outperformed MS-Fit and Profound, with Mascot identifying 62% of proteins whereas Profound and MS-Fit identified 35 and 40% of the proteins, respectively. Aldente identified 48% of the proteins. The FMP algorithm described here outperformed all of the earlier methods by achieving the highest sensitivity (82%), precision (97%), and F1-measure (89%) values of protein identification.
Plots of scoring distributions are shown in Fig. 9. Both FMP and ProFound have greater ability to clearly separate correct identifications and random matches but this separation was less obvious in the case of MS-Fit.
Fig. 9.

Distributions of the scores for the top candidates of the PMF algorithms (A) Mascot, (B) MS-Fit, (C) ProFound, (D) Aldente, and (E) FMP. Distributions of the scores for the top candidates of the PMF algorithms (A) Mascot, (B) MS-Fit, (C) ProFound, (D) Aldente and (E) FMP are shown as histograms. The continuous curve represents the group of correctly identified proteins and the broken curve represents the group of failed matches. FMP shows the clearest separation between correct and failed identifications.
The numbers of correctly identified peptide hits ranked by the five PMF search algorithms are shown in a five-way Venn diagram in Fig. 10. Out of 201 correct hits from the five algorithms (union), 53 proteins were identified by all five algorithms (intersection), 43 proteins were identified by a single algorithm and 17% of these protein hits were identified independently by FMP.
Fig. 10.

Five-way Venn diagram of the correct protein numbers identified by five PMF search algorithms. The number of correctly identified proteins by one or more algorithms is indicated; e.g. 53 protein hits are correctly identified by all five algorithms (intersection), and 43 protein hits are correctly identified by one or more algorithms (union).
DISCUSSION
PMF, regardless of becoming complementary to PFF for protein identification, remains the commonly used method in proteomics research, accompanied by in-depth studies in every aspect. It is necessary to incorporate earlier conclusions and ideas into a uniform approach to improve the performance of PMF-based protein identification.
In this study, three types of early concept that were adopted as candidate parameters gave different contributions. First, although parameters derived from matched mass error have insufficient F-score to be selected for the final SVM parameters, they still gave us a new insight into the PMF procedure. Second, prediction of missed cleavage has been applied in MPIR, which helped us to learn that it is necessary to deal with theoretical and random missed cleavages separately. Last, consideration of matched peptides hit on a protein represented competitive information for protein identification. It will be worthwhile to further inspect parameter series of consecutive matching.
Peak intensity, which has been ignored by traditional methods because it is influenced by various ionization processes and the unequal tryptic specificity for different amino acids, is now becoming a hot issue. The combination of earlier findings with successful prediction about the relationship between peak intensity and protein sequence suggests that intense experimental peaks are more likely to be generated from true peptides rather than noisy peptides. Hence, we gave prominence to peak intensity in this approach by using it rather than predicting it. First, peak intensity proportion was used to make it more comparable between different PMF data. Second, peak intensity and peak intensity proportion participated in the generation of all series of parameters. Third, parameter series of top matching are newly proposed to highlight the effect of intense experimental peaks on performance. Finally, parameters derived from peak intensity and peak intensity proportion contributed five out of 11 to the selected SVM parameters. Peak intensity is an inherent attribute of the experimental spectrum and should receive more attention during protein identification.
The purpose of MPIR is to handle multiple shared peak intensities during spectrum alignment. Differentiated weights make it rational to allocate shared peak intensities to peptides of various origins. The inherent mechanism of MPIR allows both peptide missed cleavage and mass modification to be taken into consideration concurrently. The tuning of MPIR showed that missed cleavages should no longer be an obstacle to protein identification. When normalized by several types of harmonic factors, missed cleavages and mass modification can offer competitive information on performance.
SVM is sensitive to irrelevant or correlated inputs, and the algorithm itself uses stratified sampling to reduce the size of the training data as needed. There is no upper limit on the number of features; the only constraints are those imposed by hardware. In an attempt to describe the PMF procedure in as much detail as possible, we divided it into three objects and assembled four attributes of the experimental and theoretical spectrum to generate 81 FMPs. A total of 11 select parameters calculated for each FMP at the same time could offer ultrafine and sufficient information to distinguish positive sets from large numbers of negative data. According to our conclusion, FMPs with status 1 play the same roles in performance as those with status *. In other words, alignments between intense experimental peaks and theoretical peptides digested from proper cleavage or unique in the database or with the original mass are very likely to have occurred in positive PMFs. Meanwhile, parameters derived from implied attributes of the experimental spectrum and the theoretical spectrum contributed most to the 11 select parameters, among which five out of seven parameters were derived from peak intensity rank and peak intensity proportion of the experimental spectrum, and two parameters were derived from the peptide cleavage order of the experimental spectrum. The outstanding performance of the implied attributes shows their comparable or even greater robustness than other explicit attributes.
The good generalization performance, absence of local minima and sparse representation of solution make SVM a powerful tool in classification systems. In this study, SVM was used to select sufficient and efficient parameters from 35,640 features generated from a series of earlier findings and new opinions. Using 491 select features of the PMF procedure, we obtained high performance with the validating data set by our feature-matching pattern-based SVM approach (see supplemental file SI14-PerformanceSummarry). The FMP algorithm outperforms earlier methods and has a greater ability to discriminate correctly identified proteins from randomly matched proteins, achieving the highest sensitivity, precision and F1-measure values. The high level of performance is mainly the result of the more robust parameters and elaborate features in our procedure.
As demonstrated by the tuning of the number of experimental spectra, it is necessary to extract proper peaks for single PMF data before submission to this SVM approach. The feature-matching pattern-based SVM approach described here remains to be further evaluated by more PMF data. More precise data will surely contribute more to its performance by consistent re-training. A web service for protein identification based on the current SVM approach is available at http://bioinformatics.datawisdom.net/fmp.
Acknowledgments
We want to thank Prof. Yonghong Wang (State Key Laboratory of Bioreactor Engineering, East China University of Science and Technology, Shanghai 200237, China) for providing the original mass spectrometry data of Avermectin Data set and Prof. Dianhui Wang (School of Engineering and Mathematical Science, La Trobe University, Melbourne, Victoria 3086, Australia) for helpful discussions.
Footnotes
* This work was supported by the National Basic Research Program of China (2007CB714303) and the Open Project Program of the State Key Laboratory of Bioreactor Engineering, East China University of Science and Technology.
 This article contains supplemental Parameter Tables.
1 The abbreviations used are:
- MS/MS
- Tandem mass spectrometry
- PMF
- Peptide Mass Fingerprinting
- PFF
- Peptide Fragment Fingerprinting
- SVMs
- Support Vector Machines
- TS
- Theoretical Spectrum
- ES
- Experimental Spectrum
- TP
- Theoretical Peptide
- EP
- Experimental Peak
- PUD
- Peptide Uniqueness Database
- MPIR
- Matched Peak Intensity Redistribution
- PCT
- Peptide Cleavage Type
- PUN
- Peptide Uniqueness
- PMA
- Peptide Mass Altering
- PIR
- Peak Intensity Rank
- FMP
- Feature-matching Pattern.
REFERENCES
- 1. Krogan N. J., Cagney G., Yu H., Zhong G., Guo X., Ignatchenko A., Li J., Pu S., Datta N., Tikuisis A. P., Punna T., Peregrín-Alvarez J. M., Shales M., Zhang X., Davey M., Robinson M. D., Paccanaro A., Bray J. E., Sheung A., Beattie B., Richards D. P., Canadien V., Lalev A., Mena F., Wong P., Starostine A., Canete M. M., Vlasblom J., Wu S., Orsi C., Collins S. R., Chandran S., Haw R., Rilstone J. J., Gandi K., Thompson N. J., Musso G., St Onge P., Ghanny S., Lam M. H. Y., Butland G., Altaf-Ul A. M., Kanaya S., Shilatifard A., O'Shea E., Weissman J. S., Ingles C. J., Hughes T. R., Parkinson J., Gerstein M., Wodak S. J., Emili A., Greenblatt J. F. (2006) Global landscape of protein complexes in the yeast Saccharomyces cerevisiae. Nature 440, 637–643 [DOI] [PubMed] [Google Scholar]
- 2. Gavin A. C., Aloy P., Grandi P., Krause R., Boesche M., Marzioch M., Rau C., Jensen L. J., Bastuck S., Dümpelfeld B., Edelmann A., Heurtier M. A., Hoffman V., Hoefert C., Klein K., Hudak M., Michon A. M., Schelder M., Schirle M., Remor M., Rudi T., Hooper S., Bauer A., Bouwmeester T., Casari G., Drewes G., Neubauer G., Rick J. M., Kuster B., Bork P., Russell R. B., Superti-Furga G. (2006) Proteome survey reveals modularity of the yeast cell machinery. Nature 440, 631–636 [DOI] [PubMed] [Google Scholar]
- 3. Damodaran S., Wood T. D., Nagarajan P., Rabin R. A. (2007) Evaluating peptide mass fingerprinting-based protein identification. Genomics Proteomics Bioinformatics 5, 152–157 [DOI] [PMC free article] [PubMed] [Google Scholar]
- 4. Henzel W. J., Watanabe C., Stults J. T. (2003) Protein identification: the origins of peptide mass fingerprinting. J. Am. Soc. Mass Spectrom. 14, 931–942 [DOI] [PubMed] [Google Scholar]
- 5. Palagi P. M., Hernandez P., Walther D., Appel R. D. (2006) Proteome informatics I: bioinformatics tools for processing experimental data. Proteomics 6, 5435–5444 [DOI] [PubMed] [Google Scholar]
- 6. Shadforth I., Crowther D., Bessant C. (2005) Protein and peptide identification algorithms using MS for use in high-throughput, automated pipelines. Proteomics 5, 4082–4095 [DOI] [PubMed] [Google Scholar]
- 7. Parker K. C. (2002) Scoring methods in MALDI peptide mass fingerprinting: ChemScore, and the ChemApplex program. J. Am. Soc. Mass Spectrom. 13, 22–39 [DOI] [PubMed] [Google Scholar]
- 8. Craig R., Cortens J. P., Beavis R. C. (2005) The use of proteotypic peptide libraries for protein identification. Rapid Commun. Mass Spectrom. 19, 1844–1850 [DOI] [PubMed] [Google Scholar]
- 9. Gras R., Müller M., Gasteiger E., Gay S., Binz P. A., Bienvenut W., Hoogland C., Sanchez J. C., Bairoch A., Hochstrasser D. F., Appel R. D. (1999) Improving protein identification from peptide mass fingerprinting through a parameterized multi-level scoring algorithm and an optimized peak detection. Electrophoresis 20, 3535–3550 [DOI] [PubMed] [Google Scholar]
- 10. Monigatti F., Berndt P. (2005) Algorithm for accurate similarity measurements of peptide mass fingerprints and its application. J. Am. Soc. Mass Spectrom. 16, 13–21 [DOI] [PubMed] [Google Scholar]
- 11. Kaltenbach H. M., Wilke A., Böcker S. (2007) SAMPI: protein identification with mass spectra alignments. BMC Bioinformatics 8, 102–112 [DOI] [PMC free article] [PubMed] [Google Scholar]
- 12. He Z., Yang C., Yu W. (2008) Peak bagging for peptide mass fingerprinting. Bioinformatics 24, 1293–1299 [DOI] [PubMed] [Google Scholar]
- 13. Sanaki T., Suzuki M., Lee S. H., Goto T., Oe T. (2010) A simple and efficient approach to improve protein identification by the peptide mass fingerprinting method: concomitant use of negative ionization. Anal. Methods 2, 1144–1151 [Google Scholar]
- 14. Song Z., Chen L., Ganapathy A., Wan X. F., Brechenmacher L., Tao N., Emerich D., Stacey G., Xu D. (2007) Development and assessment of scoring functions for protein identification using PMF data. Electrophoresis 28, 864–870 [DOI] [PubMed] [Google Scholar]
- 15. Timm W., Scherbart A., Böcker S., Kohlbacher O., Nattkemper T. W. (2008) Peak intensity prediction in MALDI-TOF mass spectrometry: A machine learning study to support quantitative proteomics. BMC Bioinformatics 9, 443–460 [DOI] [PMC free article] [PubMed] [Google Scholar]
- 16. Yang D., Ramkissoon K., Hamlett E., Giddings M. C. (2008) High-Accuracy Peptide Mass Fingerprinting Using Peak Intensity Data with Machine Learning. J. Proteome Res. 7, 62–69 [DOI] [PubMed] [Google Scholar]
- 17. Haas W., Faherty B. K., Gerber S. A., Elias J. E., Beausoleil S. A., Bakalarski C. E., Li X., Villen J., Gygi S. P. (2006) Optimization and use of peptide mass measurement accuracy in shotgun proteomics. Mol. Cell. Proteomics 5, 1326–1337 [DOI] [PubMed] [Google Scholar]
- 18. Dodds E. D., Clowers B. H., Hagerman P. J., Lebrilla C. B. (2008) Systematic characterization of high mass accuracy influence on false discovery and probability scoring in peptide mass fingerprinting. Anal. Biochem. 372, 156–166 [DOI] [PMC free article] [PubMed] [Google Scholar]
- 19. Jain R., Wagner M. (2010) Kolmogorov-Smirnov Scores and Intrinsic Mass Tolerances for Peptide Mass Fingerprinting. J. Proteome Res. 9, 737–742 [DOI] [PubMed] [Google Scholar]
- 20. Song Z., Chen L., Xu D. (2009) Confidence assessment for protein identification by using peptide-mass fingerprinting data. Proteomics 9, 3090–3099 [DOI] [PubMed] [Google Scholar]
- 21. Chamrad D. C., Körting G., Stühler K., Meyer H. E., Klose J., Blüggel M. (2004) Evaluation of algorithms for protein identification from sequence databases using mass spectrometry data. Proteomics 4, 619–628 [DOI] [PubMed] [Google Scholar]
- 22. Perkins D. N., Pappin D. J., Creasy D. M., Cottrell J. S. (1999) Probability-based protein identification by searching sequence databases using mass spectrometry data. Electrophoresis 20, 3551–3567 [DOI] [PubMed] [Google Scholar]
- 23. Clauser K. R., Baker P., Burlingame A. L. (1999) Role of accurate mass measurement (±10 ppm) in protein identification strategies employing MS or MS/MS and database searching. Anal. Chem. 71, 2871–2882 [DOI] [PubMed] [Google Scholar]
- 24. Zhang W., Chait B. T. (2000) ProFound: An Expert System for Protein Identification Using Mass Spectrometric Peptide Mapping Information. Anal. Chem. 72, 2482–2489 [DOI] [PubMed] [Google Scholar]
- 25. Sreevatsa A. N., Badrunnisa S., Shaukath A. M., Vinitha R. P. (2010) Computational diagnostics based on proteomic data - review on approaches and algorithms. Int. J. Bioinformatics Res. 2, 56–66 [Google Scholar]
- 26. McHugh L., Arthur J. W. (2008) Computational Methods for Protein Identification from Mass Spectrometry Data. PLoS Comput Biol 4, e12. [DOI] [PMC free article] [PubMed] [Google Scholar]
- 27. Tharakan R., Edwards N., Graham D. R. M. (2010) Data maximization by multipass analysis of protein mass spectra. Proteomics 10, 1160–1171 [DOI] [PubMed] [Google Scholar]
- 28. Chamrad D. C., Koerting G., Gobom J., Thiele H., Klose J., Meyer H. E., Blueggel M. (2003) Interpretation of mass spectrometry data for high-throughput proteomics. Anal. Bio. Anal. Chem. 376, 1014–1022 [DOI] [PubMed] [Google Scholar]
- 29. Falkner J. A., Kachman M., Veine D. M., Walker A., Strahler J. R., Andrews P. C. (2007) Validated MALDI-TOF/TOF mass spectra for protein standards. J. Am. Soc. Mass Spectrom. 18, 850–855 [DOI] [PubMed] [Google Scholar]
- 30. Yin P. (2008) The regulation of avermectin fermentation process and its metabolic analysis by differential proteome. Doctoral Dissertation, East China University of Science and Technology [Google Scholar]
- 31. Yin P., Wang Y. H., Zhang S. L., Chu J., Zhuang Y. P., Wang M. L., Zhou J. (2008) Isolation of soluble proteins from an industrial strainStreptomyces avermitilis in complex culture medium for two-dimensional gel electrophoresis. J. Microbiol. Methods 73, 105–110 [DOI] [PubMed] [Google Scholar]
- 32. Tuloup M., Hernandez C., Coro I., Hoogland C., Binz P. A., Appel R. D. (2003) Aldente and BioGraph: An improved peptide mass fingerprinting protein identification environment. Proceedings of the Swiss Proteomics Society 2003 Congress: Understanding Biological Systems through Proteomics 174–176 [Google Scholar]
- 33. Siepen J. A., Keevil E. J., Knight D., Hubbard S. J. (2007) Prediction of missed cleavage sites in tryptic peptides aids protein identification in proteomics. J. Proteome Res. 6, 399–408 [DOI] [PMC free article] [PubMed] [Google Scholar]
- 34. Fu Y., Yang Q., Sun R., Li D., Zeng R., Ling C. X., Gao W. (2004) Exploiting the kernel trick to correlate fragment ions for peptide identification via tandem mass spectrometry. Bioinformatics 20, 1948–1954 [DOI] [PubMed] [Google Scholar]
- 35. Chang C. C., Lin C. J. (2001) LIBSVM: a library for support vector machines. Software available at http://www.csie.ntu.edu.tw/∼cjlin/libsvm
- 36.Yu H. F., Ho C. H. http://www.csie.ntu.edu.tw/∼cjlin/libsvmtools/eval/index.html.
- 37. Chen Y. W., Lin C. J. (2006) Combining SVMs with various feature selection strategies. Studies in Fuzziness and Soft Computing 207, 315–324 Software available at http://www.csie.ntu.edu.tw/∼cjlin/libsvmtools/fselect/fselect.py [Google Scholar]
- 38. Li Y. Y., Zhuang Y. P., Zhang S. L. (2011) Automation Strategies for Bioinformatics Software and Their Implementation. Comput. Eng. 37, 81–83, 86 [Google Scholar]