Abstract
Resolving the closest relatives of Gnetales has been an enigmatic problem in seed plant phylogeny. The problem is known to be difficult because of the extent of divergence between this diverse group of gymnosperms and their closest phylogenetic relatives. Here, we investigate the evolutionary properties of conifer chloroplast DNA sequences. To improve taxon sampling of Cupressophyta (non-Pinaceae conifers), we report sequences from three new chloroplast (cp) genomes of Southern Hemisphere conifers. We have applied a site pattern sorting criterion to study compositional heterogeneity, heterotachy, and the fit of conifer chloroplast genome sequences to a general time reversible + G substitution model. We show that non-time reversible properties of aligned sequence positions in the chloroplast genomes of Gnetales mislead phylogenetic reconstruction of these seed plants. When 2,250 of the most varied sites in our concatenated alignment are excluded, phylogenetic analyses favor a close evolutionary relationship between the Gnetales and Pinaceae—the Gnepine hypothesis. Our analytical protocol provides a useful approach for evaluating the robustness of phylogenomic inferences. Our findings highlight the importance of goodness of fit between substitution model and data for understanding seed plant phylogeny.
Keywords: compositional heterogeneity, heterotachy, Gnetales, systematic error
Introduction
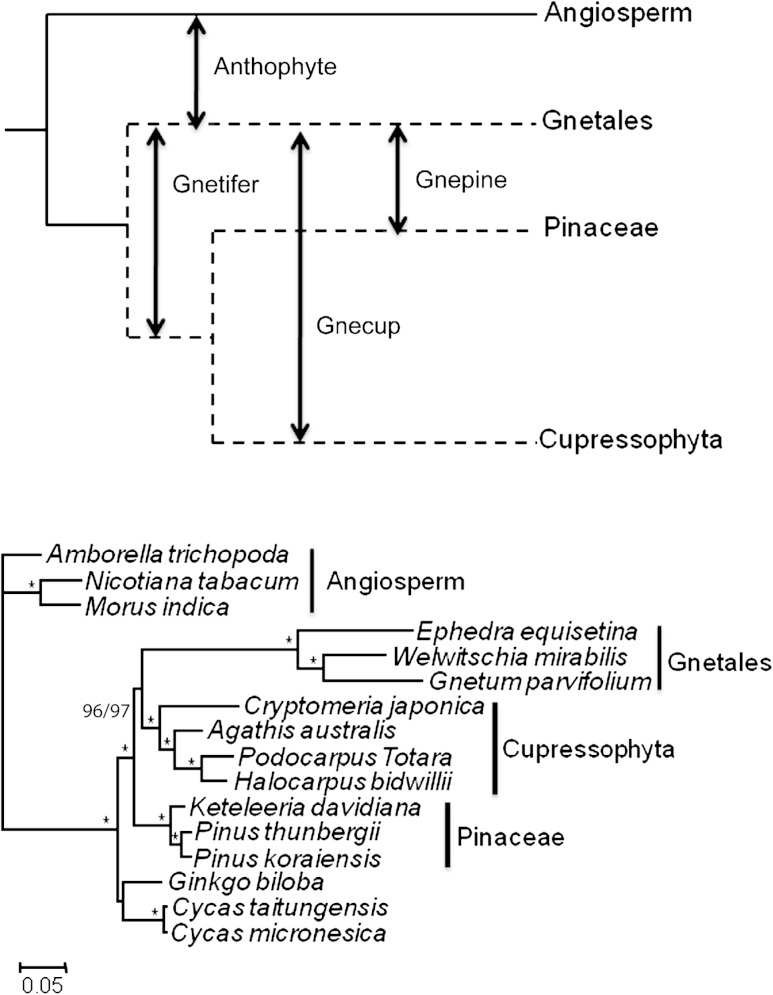
Gnetales are a morphologically and ecologically diverse group of Gymnosperms, united as a monophyletic group based on special features of their cytology. Initially, they were thought to be the nearest relatives of flowering plants (angiosperms) based on the morphological similarities (the “Anthophyte” hypothesis) (Crane 1985). However, all recent molecular work has separated Gnetales away from the angiosperms and instead placed them with or within conifers. Some analyses have placed them as sister group to conifers (the “Gnetifer” hypothesis, Chaw et al. 1997), others close to Pinaceae (the “Gnepine” hypothesis, Bowe et al. 2000; Chaw et al. 2000; Finet et al. 2010; Zhong et al. 2010), and others within conifers but close to Cupressophyta (non-Pinaceae conifers; the “Gnecup” hypothesis, Nickrent et al. 2000; Doyle 2006). These alternative hypotheses are illustrated in figure 1A.
FIG. 1.—
(A) Four major hypotheses for phylogenetic relationships involving Gnetales. (B) Optimal PhyML tree (GTR + G substitution model) reconstructed from all codon positions. The same topology is obtained using 1st + 2nd position sites. Bootstrap support for Gnecup hypothesis is 96% for all sites and 97% for 1st + 2nd position sites.
It has been reported that Gnetales have a faster substitution rate of sequence evolution than other gymnosperms, which could potentially cause a “long-branch attraction” (LBA) artifact in phylogenetic reconstruction (Zhong et al. 2010). The effects of LBA are well understood, even though the significance of contributing causes is often difficult to determine. These can include faster substitution rates in nonadjacent phylogenetic lineages (Felsenstein 1978), poor taxon sampling due to extinction or limited availability of some taxa (Hendy and Penny 1989), and properties of sequences not well described by stationary time reversible models. The latter include base compositional heterogeneity (Foster 2004; Jermiin et al. 2004) and lineage-specific changes in evolutionary constraint that can alter the proportion of variable sites in homologs (Lockhart and Steel 2005).
To improve taxonomic sampling of the Cupressophyta, we determined sequences for 52 genes from the chloroplast DNA (cpDNA) genomes of Halocarpus kirkii, Podocarpus totara, and Agathis australis using Illumina GAII sequencing. In phylogenetic analyses of concatenated seed plant chloroplast genome sequences, we demonstrate that sites exhibiting greatest character state variation are not well described by a time reversible substitution model. We show that this data property significantly impacts on the reconstruction accuracy of seed plant phylogeny.
Materials and Methods
Sample Collection and DNA Sequences
Tissue for Cupressophyta (H. kirkii, P. totara, and A. australis) was obtained with permission from the living collection at Massey University, Palmerston North. Chloroplasts were isolated and enriched DNA sequenced using the protocols described in Atherton et al. (2010). Short reads were filtered for the longest contigous subsequences below 0.05 error probability using DynamicTrim (Cox et al. 2010). Filtered reads were assembled with Velvet (Zerbino and Birney 2008) and a k-mer range from 23 to 63. Contigs were further assembled using the Geneious assembler (Drummond et al. 2011). Initial annotations for protein-coding genes were carried out using DOGMA (Wyman et al. 2004). Annotations were manually refined by comparison with genes of more closely related species.
We retrieved 13 cp genomes from the NCBI database, including the three genera of Gnetales, one Cupressophyta conifer (Cryptomeria japonica), three representatives of Pinaceae conifers (Pinus thunbergii, Pinus koraiensis, and Keteleeria davidiana), and three species from the Cycads/Ginkgo group, with three angiosperms representing the outgroup. GenBank accession numbers for gene sequences used and determined in the present study are listed in supplementary table S1 (Supplementary Material online). Fifty-two protein-coding genes were first aligned as proteins using MUSCLE (Edgar, 2004). Gaps were excluded from these alignments so that only blocks of ungapped residues bounded by similar or identical amino acids were used in phylogenetic analyses. Se-Al v2.0all (Rambaut 2002) was used to edit the underlying DNA sequences into the amino acid alignments. These alignments were then concatenated using Geneious v5.4 (Drummond et al. 2011). This approach produced an alignment of 33289 ungapped positions (not divisible by three as some gaps occur in Genbank sequences).
Sorting Sites Based on Character State Variation
The positions in our concatenated alignments were sorted based on their character state variation. As we demonstrate, this facilitated the study of systematic error in these data. Several methods have been suggested for ordering sites (e.g., discussed in Hansmann and Martin 2000; Goremykin et al. 2010). We used the method of observed variability (OV) sorting as described in Goremykin et al. (2010), which previously has been found to be efficient in concentrating saturated positions toward the most varied end of the sorted alignment. The alignment was ordered from the most highly varied sites to the most conserved sites, and a series of alignments was generated by successively shortening the OV-sorted alignment in steps of 250 sites. For each shortening step, two data partitions were obtained: 1) the shortened alignment containing the most conserved sites (partition “A”) and 2) an alignment containing the more varied sites (partition “B”). After model fitting for each partition data, the maximum likelihood (ML) distance and uncorrected p distance were calculated using PAUP* (Swofford 2002). Two Pearson correlation analyses of pairwise distances were conducted at each shortening step: 1) correlation of the ML and uncorrected p distances for partition B and 2) correlation of the ML distances for partition A and B. The stopping point for site removal was determined as the point at which the two correlations showed a significant improvement (Goremykin et al. 2010).
Data Model Fit
We used MISFITS (Nguyen et al. 2011) to determine the occurrence of site patterns in our sorted alignment that were unexpected under a general time reversible (GTR) + G model using three alternative Gnetales phylogenetic trees incorporated as part of the evolutionary model. That is, given a GTR + G substitution model and weighted tree, the expected pattern likelihood vector was computed. For each entry in the vector, a simultaneous α = 95% Gold confidence region was calculated. Sequence positions in the alignment indicating unexpected patterns were recorded. We also successively shortened our alignment by 250 positions and compared the log-likelihood scores for our OV-sorted alignment (partition A) to log-likelihood scores for identical length partitions jackknife resampled from the complete 33289 position alignment. PhyML 3.0 (Guindon et al. 2010) was used for log-likelihood calculations. Seqboot, implemented in the Phylip3.6 package (Felsenstein 2004), was used for jackknife resampling. Z-scores were calculated by subtracting the log-likelihood score on the original data from the mean log-likelihood score for the psuedoreplicate data sets and dividing by the standard deviation (SD) of mean scores.
Compositional Heterogeneity
MEGA5.0 (Tamura et al. 2011) was used to calculate the average nucleotide composition of 1) all codon sites, 1st + 2nd codon sites and 3rd codon sites and 2) intervals of increasing length (250 bp) beginning from the most varied end of the OV-sorted alignment. The SD of mean nucleotide frequencies was plotted to visualize compositional heterogeneity among taxa.
Phylogenetic Analyses
ML trees were built assuming a GTR + G model implemented in PhyML 3.0 (Guindon et al. 2010). The relative length of branches and extent of heterotachy (lineage-specific differences in evolutionary rate) in these trees was visualized using SplitsTree 4.0 (Huson and Bryant 2006).
Results
Effect of Improved Taxon Sampling
In ML analyses of all codon positions and 1st + 2nd sites, inclusion of the newly determined sequences from three Cupressophyta genomes halved the length of the internal branch subtending Gnetales and Cupressophyta when compared with phylogenetic reconstructions made without these taxa. Inclusion of sequences from these additional genomes did not change the topology. In the trees with additional taxa, the Gnecup hypothesis (fig. 1B) was strongly supported (96% and 97% bootstrap support for all positions and 1st + 2nd sites, respectively). However as we show below, support for this hypothesis was also strongly dependent on the inclusion of sites in the data that showed a poor fit to the GTR + G substitution model.
The Impact of Site Removal
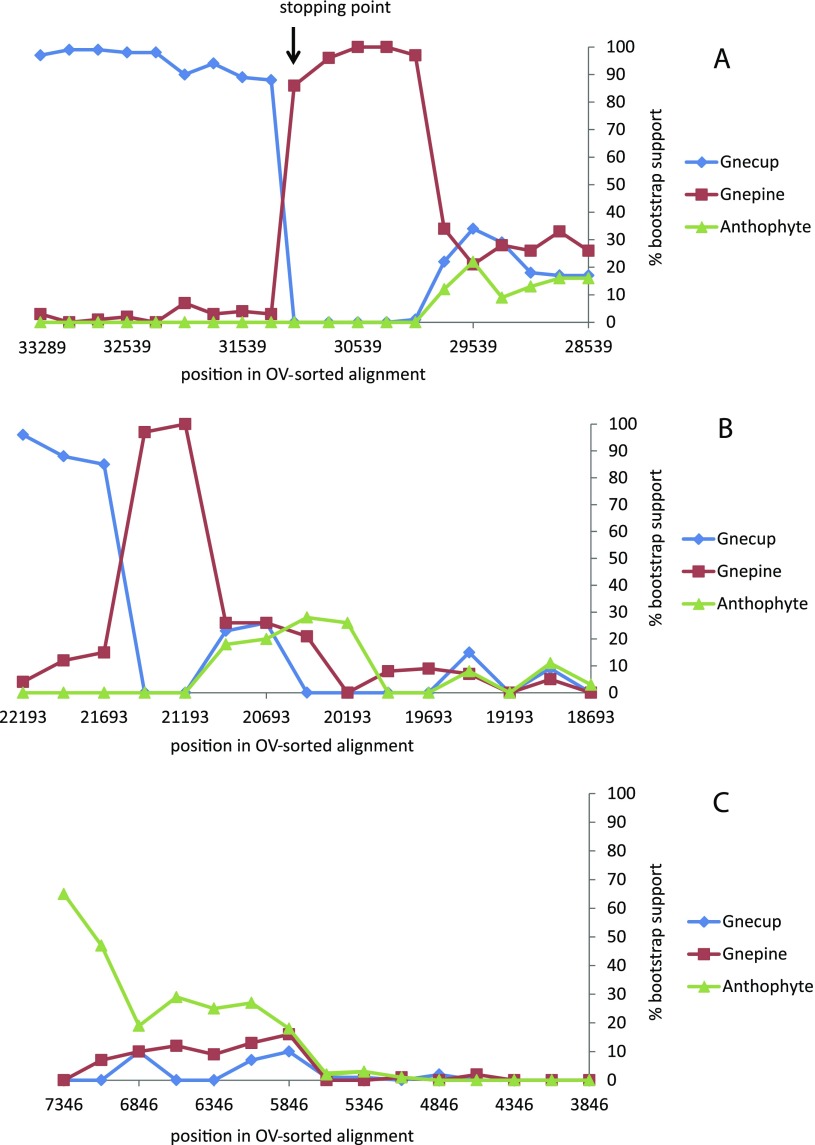
We used the OV sorting criterion of Goremykin et al. (2010) to rank site patterns from most varied to least varied. Blocks of columns in steps of 250 sites were then removed sequentially. This produced a series of shortened alignments. ML trees under a GTR + G model were reconstructed for each partition, and the bootstrap support for alternative hypotheses was measured for each partition. This analysis was made for all sites, 1st + 2nd codon position sites, and 3rd codon position sites. Figure 2A (all sites) shows that the Gnecup hypothesis was favored only while the 2000 most varied positions were included in the analysis. After these sites were removed, the Gnepine hypothesis became favored until 3,250 sites were removed. After this point, alternative hypotheses were unresolved. With 1st and 2nd codon position data alone, the Gnepine hypothesis was favored after removal of 750 sites and before removal of 1,250 sites (fig. 2B). With 3rd codon position data, the Anthophyte hypothesis was initially weakly supported, but this support decreased as sites were removed (fig. 2C).
FIG. 2.—
Bootstrap support in optimal PhyML trees for three alternative relationships as intervals of 250 bases were successively removed from the OV-sorted alignment. (A) all sites, (B) 1st + 2nd codon positions, and (C) 3rd codon positions.
Data Model Fit
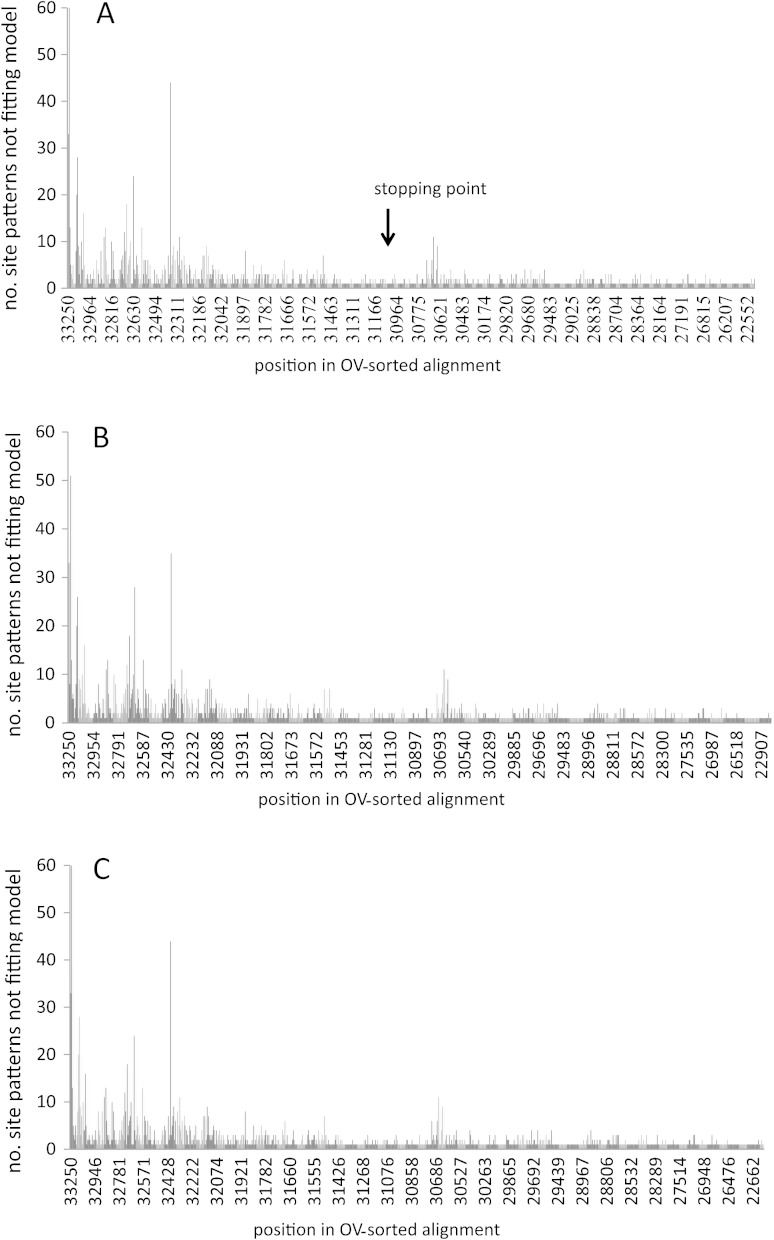
To help understand the impact of site removal, we investigated the fit of site patterns to three alternative evolutionary models (Gnecup, Gnepine, and Gnetifer trees) that assumed an optimal GTR + G substitution model. Using MISFITS (Nguyen et al. 2011), we computed the overrepresented and underrepresented site patterns in the OV-sorted data. For the Gnepine hypothesis, we observed that 46%of the sites not fitting the evolutionary model occurred within the 2250 most varied positions (i.e., in 7% of the total alignment length; 15% of all variable sites). About 3.1% (691/22193) of the 1st + 2nd position sites and 15.2% (1687/11096) of the 3rd position sites do not fit the Gnepine tree. A similar poor fit was also obtained for tree topologies that supported the Gnetifer and Gnecup hypotheses (fig. 3), suggesting that in the most varied positions of the OV-sorted alignment, misspecification was a general property of the GTR + G substitution model and not specific to any one hypothesis of evolutionary relationship.
FIG. 3.—
Histogram indicating consecutive misfitting site patterns under the (A) GTR + G + Gnepine, (B) GTR + G + Gnetifer, and (C) GTR + G + Gnecup evolutionary model. The height of each histogram indicates the number of unexpected site patterns.
To further evaluate the impact of the most varied positions on data model fit with our three tree models, we also compared the log-likelihood scores for the sequentially shorted (partition A) data sets, with scores for identical length data sets comprised of jackknife resampled site patterns taken from the original 33289 position alignment. The results from this analysis corroborated those obtained with MISFITS in identifying an extremely poor data model fit for sites at the most varied end of the OV-sorted alignment (supplementary fig. S1, Supplementary Material online).
Compositional Heterogeneity
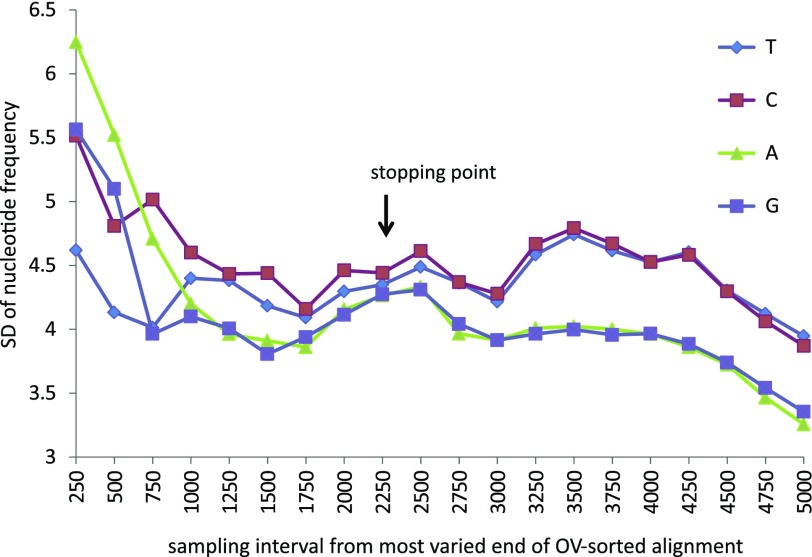
Figure 4 shows the SD of individual base frequencies from mean (stationary) estimates for intervals increasing in length by 250 bases sampled from the most varied end of the OV-sorted alignment. While the average nucleotide compositional frequencies of all sites, 1st + 2nd sites, and 3rd sites are relatively homogeneous (Results not shown), the most varied OV-sorted sites in the alignment exhibit significant compositional heterogeneity. This decreases incrementally toward the more conserved positions of the OV-sorted alignment.
FIG. 4.—
Plot indicating nucleotide compositional heterogeneity within intervals sampled from the most varied end of the OV-sorted alignment. Subsequent intervals increased in length by 250 bases per interval.
Heterotachy
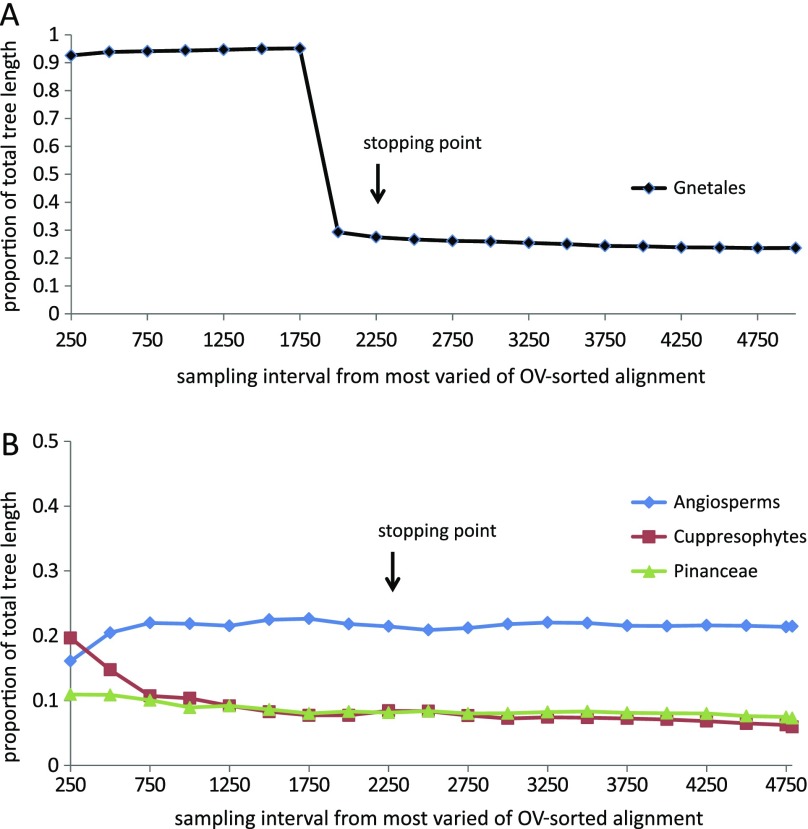
Optimal PhyML trees (GTR + G substitution model) were reconstructed for sampling intervals that increased in length by 250 bases from the most varied end of the OV-sorted alignment. The relative length of the Gnetales internal branch separating Gnetales from other species in the 16 taxon data set for each sampling interval is shown in figure 5A. The relative length of the branches subtending the Cupressophyta, Pinaceae, and angiosperms in the 13 taxon data set is shown in figure 5B. A striking feature of the 16 taxon trees is that the branch leading to the Gnetales lineage is disproportionately much longer than branches subtending other seed plant lineages (more than 60× longer over the first 1750 bases and between 10×–5× between 2000 and 2500 bases) at the most varied end of the OV-sorted alignment (fig. 5). This extreme branch length difference is a feature of both the 1st + 2nd codon position and 3rd codon position data (not shown).
FIG. 5.—
Relative length of internal branch leading to (A) Gnetales in a 16 taxon data set; (B) non-Pinaceae, Pinaceae, and Angiosperms in a 13 taxon data set (this second data set excluded Gnetales). The branch lengths are shown as a proportion of total tree length. Optimal PhyML trees were reconstructed for the same sampling intervals as used in figure 4.
Removal of Most Varied Sites from the Alignment
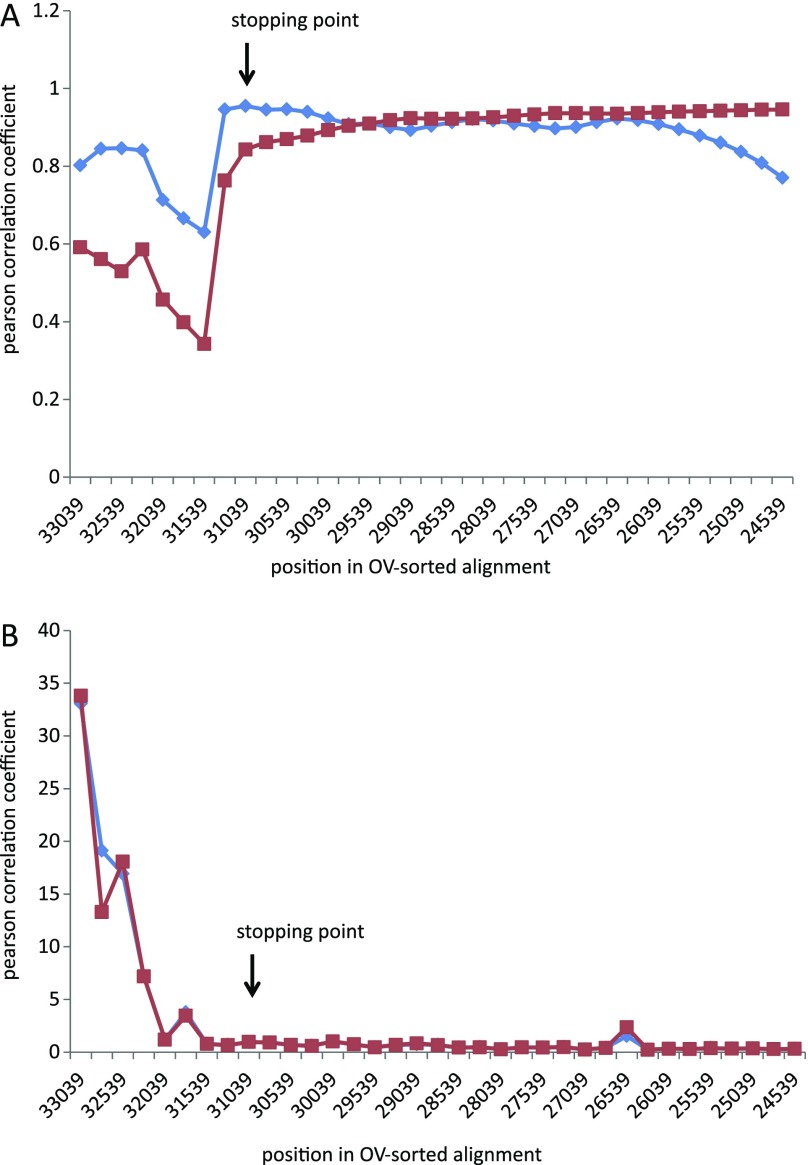
We used the stopping criterion of Goremykin et al. (2010) to make an assessment of the number of most varied sites that should be excluded prior to tree building. This criterion considers the alignment partitions created by the sequential shortening steps described previously and compares 1) ML distances for the conserved (A) and the variable (B) bipartition and 2) p distances and ML distances for the B partition. The authors have suggested that the removal of variable positions should be continued at least until the very end of the sharp rise in Pearson correlation values in either analysis. The stopping criterion identifies the point where the substitution properties of most varied sites (partition B) become more similar to those of the more conserved sites in the alignment (partition A), and where corrected and uncorrected distances for the variable B partition begin to show a strong positive correlation. As such it provides a means to objectively decide a cutoff point for excluding from tree building sites that exhibit site saturation and or model misspecification. Figure 6 indicates change in the correlation coefficient (r) and similarity of distances estimates as sites are removed. A sharp rise in (r) occurs when 2,000 sites have been removed and it ceases with removal of 2,250 sites in the correlation of p distances and ML distances estimated from B partitions. Reference to figure 5 shows that this is accompanied by reduction of heterotachy associated with the Gnetales lineage. It also marks the transition zone for bootstrap support of the Gnecup and Gnepine hypotheses. The Gnepine hypothesis is strongly favored after removal of 2,250 sites (position 31039). It continues to be favored until 3,250 sites are removed when the PhyML trees become unresolved.
FIG. 6.—
(A) Pearson correlation analyses. The blue dotted line indicates the Pearson correlation coefficients (r) of ML distances for (the more conserved) partition “A” and (less conserved) partition “B”. The red dotted line represents r value of uncorrected p distances and ML distances for partition B. The r values begin to increase sharply at the eighth shortening step (31289 position remained). (B) Mean deviations of ML distances from p distances for B partitions. The red dotted line shows deviations between p distances and ML distances calculated using the best-fitting ML model as determined by ModelTest (Posada and Crandall 1998) using the Akaike information criterion (the neighbor joining tree was used to estimate ML model parameters). The blue dotted line indicates the deviation between p distances and ML distances calculated as above but using an ML tree to fit model parameters.
Discussion
Most phylogenetic methods assume that DNA sequences have evolved under stationary, reversible, and homogeneous conditions. Violation of this model assumption is well known to lead to inaccurate tree reconstruction (e.g., Lanave et al 1984; Lockhart et al. 1994; Foster 2004; Jermiin et al. 2004; Delsuc et al. 2005; Lockhart and Steel 2005). Our MISFIT analyses indicate a poor fit between the most varied nucleotide sites in the Gnetales chloroplast concatenated data set and a GTR + G model—one of the more general models of substitution currently used in phylogenetic reconstruction. Although more complex mixture models exist (e.g., such as the CAT model, Lartillot and Philippe 2004), like GTR + G, they also assume a stationary distribution of base frequencies and have the expectation for a constant proportion of variable sites in all sequences.
Deviation from compositional homogeneity occurs in the most varied regions of the OV-sorted alignment. However, this heterogeneity extends past the OV sorting stopping point and shows no obvious relationship to it. Thus, compositional homogeneity appears an insufficient explanation for the significant increase in value of the Pearson statistic after removal of 2,000 sites and an insufficient explanation for the extent of poor model fit observed in the most varied part of the OV-sorted alignment.
More important for explaining the sharp rise in the Pearson statistic is the extent of substitution rate difference inferred for the Gnetales lineage across the sampling intervals at the most varied end of the OV-sorted alignment. This property of the aligned data causes high variance in ML distance estimation between Gnetales and other species when estimates are made from B partitions. This property of the sorted data explains much of the Pearson coefficient behavior in the correlation analyses. By the final shortening step, at 2250 bases, the relative length of the internal branch separating Gnetales shows approximately 60× reduction in length. This reduction is accompanied by a rapid change in the bootstrap support for the Gnepine hypothesis.
The extreme branch length differences between Gnetales and other lineages for sites at the most varied end of the OV-sorted alignment suggests an issue with alignment of some amino acid positions, despite a conservative approach being used in generating the sequence alignments in the present study. To investigate this further, we also aligned seed plant DNA sequences using the approach of Goremykin et al. (2010) and excluded regions of low sequence similarity (analyses not shown). Working with these alignments, we also obtained very similar results and conclusions regarding heterotachy, compositional heterogeneity, misfit analyses, and bootstrap support. Thus, we conclude that heterotachy is a strong feature of the data and is not a feature of a specific alignment method.
Very recently, a similar study has been undertaken to that reported here. Wu et al. (2011) have determined chloroplast genome sequences for five Cupressophytes and a cycad. They also studied the phylogenetic placement of Gnetales with respect to other seed plants. Our general conclusions are similar to theirs—phylogenetic reconstruction of Gnetales in seed plant phylogeny is misled by non-time reversible properties of aligned chloroplast sequences. From their sampling of taxa, Wu et al. (2011) obtain stronger evidence than we do for lineage-specific change in the Cupressophyta that parallels Gnetales. Our studies also differ in that these authors did not evaluate the relative contribution of compositional heterogeneity and heterotachy in causing problems for tree building. Our analyses suggest that heterotachy is a more significant cause of systematic error in the seed plant sequences analyzed. As we have discussed below, our analyses also suggest that removal of sites rather than individual genes provides a better strategy for dealing with this problem.
Wu et al. (2011) divided chloroplast sequences into L (low heterotachy) and H (high heterotachy) genes and provide evidence that only phylogenetic inference from genes in the L data set is reliable. The H data set contains genes involved in translation including the rpo genes, which previously have been shown to exhibit nonconservative substitutions, indels, and increased proportions of variable sites in green algae (Lockhart et al. 2006). Our analyses indicate that while heterotachy is most pronounced in genes of the H data set, a significant level of heterotachy also occurs in the L data set for conifers that we have studied (not shown). There is also a significant amount of useful phylogenetic information in the H genes, as indicated from our results that favor the Gnepine hypothesis. This conclusion is based on an analysis of 31,039 sites, whereas that of Wu et al. (2011) is based on 21945 DNA positions (7,315 amino acids in the L data set). In general, we suspect that it will be more phylogenetically informative to remove model violating sites rather than genes prior to phylogenetic analyses.
Wu et al. (2011) suggest that the example of Gnetales follows the classic LBA scenario of Felsenstein (1978), wherein there is LBA between Gnetales and Cupressophyta. However, it is important to note that while similar, the LBA scenario for seed plants is likely to differ from this. The properties of seed plant sequences better fit the LBA scenario described by Lockhart and Steel (2005) in which proportions of variable sites change in a lineage-specific fashion, and where parallel changes occur (Zhong et al. 2010) because of similar proportions and convergent patterns of variable sites (modeled in Gruenheit et al. 2008). The significance of the difference in scenarios is important because current methods of tree building do not model lineage-specific change the proportion of variable sites in homologues (Lockhart and Steel 2005; Lockhart et al. 2006; Gruenheit et al. 2008; Shavit Grievink et al. 2008). Although it is possible to model changes in proportions of variable sites using branch length mixtures, these can be complex under some scenarios and thus problematic to identify (Matsen and Steel 2007; Gruenheit et al. 2008; Lartillot et al. 2009). Furthermore, Wu et al. (2011) observe that a mixture branch lengths model was unsuccessful in alleviating LBA with the H data set.
Conclusions
Observations of a poor fit between fast-evolving sites and time reversible models such as the GTR + G model of sequence evolution are not novel (e.g., Sullivan et al. 1995; Goremykin et al. 2004). However, the significance of having a poor fit becomes much more obvious in analysis of concatenated sequences. In the present study, systematic error arising from lineage-specific differences in evolutionary constraint dominates phylogenetic signal and misleads phylogenetic reconstruction. When systematic error contributing to most of the model misfit is removed prior to tree building, our analyses favor the Gnepine hypothesis for seed plant phylogeny (Bowe et al. 2000; Chaw et al. 2000; Finet et al. 2010; Zhong et al. 2010; Soltis et al. 2011; Wu et al. 2011).
We studied site removal in the context of substitution model misspecification and the stopping criterion of Goremykin et al. (2010). With respect to this, our study provides more insight into the performance of this method. Our results indicate that use of the stopping criterion also removes sites that provide a poor fit to tree-building assumptions. Although this criterion does not remove all model violating sites from data, it removes sites that significantly impact on phylogenetic estimates and thus sites most important for misleading tree building. Thus, it provides a useful tool to guide phylogenomic analyses.
Wu et al. (2011) note that improved taxon sampling was insufficient to overcome LBA between Curessophytes and Gnetales. We also obtained this result. However, we wish to be more positive about the contribution that improving taxon sampling of conifers will make to phylogenetic reconstruction of seed plant phylogeny. In our study, addition of sequences from three Cupressophytes reduced the length of the internal branch leading to Gnetales and Cupressophytes 2-fold, even if it was not sufficient to change the topology. Together with international efforts currently underway to sequence and analyze conifer genomes, we believe that analytical approaches such as those used here will be essential for evaluating and mitigating the impact of systematic error in large-scale phylogenomic data sets for seed plants.
Supplementary Material
Supplementary table S1, figure S1, and data matrix concatenated gapped alignment are available at Genome Biology and Evolution online ( http://www.gbe.oxfordjournals. org/).
Acknowledgments
This work was financially supported by the Allan Wilson Centre, Massey University, the New Zealand Royal Society, and the Deutscher Akademischer Austausch Dienst. We thank Jennifer Tate, the anonymous reviewers, and the associate editor for helpful comments.
References
- Atherton RA, et al. Whole genome sequencing of enriched chloroplast DNA using the Illumina GAII platform. Plant Methods. 2010;6:22. doi: 10.1186/1746-4811-6-22. [DOI] [PMC free article] [PubMed] [Google Scholar]
- Bowe LM, Coat G, dePamphilis CW. Phylogeny of seed plants based on all three genomic compartments: extant gymnosperms are monophyletic and Gnetales' closest relatives are conifers. Proc Natl Acad Sci U S A. 2000;97:4092–4097. doi: 10.1073/pnas.97.8.4092. [DOI] [PMC free article] [PubMed] [Google Scholar]
- Chaw SM, Parkinson CL, Cheng Y, Vincent TM, Palmer JD. Seed plant phylogeny inferred from all three plant genomes: monophyly of extant gymnosperms and origin of Gnetales from conifers. Proc Natl Acad Sci U S A. 2000;97:4086–4091. doi: 10.1073/pnas.97.8.4086. [DOI] [PMC free article] [PubMed] [Google Scholar]
- Chaw SM, Zharkikh A, Sung HM, Lau TC, Li WH. Molecular phylogeny of extant gymnosperms and seed plant evolution: analysis of nuclear 18S rRNA sequences. Mol Biol Evol. 1997;14:56–68. doi: 10.1093/oxfordjournals.molbev.a025702. [DOI] [PubMed] [Google Scholar]
- Cox MP, Peterson DA, Biggs PJ. SolexaQA: At-a-glance quality assessment of Illumina second-generation sequencing data. BMC Bioinformatics. 2010;11:485. doi: 10.1186/1471-2105-11-485. [DOI] [PMC free article] [PubMed] [Google Scholar]
- Crane PR. Phylogenetic analysis of seed plants and the origin of angiosperms. Ann Mo Bot Gard. 1985;72:716–793. [Google Scholar]
- Delsuc F, Brinkmann H, Philippe H. Phylogenomics and the reconstruction of the tree of life. Nat Rev Genet. 2005;6:361–375. doi: 10.1038/nrg1603. [DOI] [PubMed] [Google Scholar]
- Doyle JA. Seed ferns and the origin of angiosperms. J Torrey Bot Soc. 2006;133:169–209. [Google Scholar]
- Drummond AJ, et al. Geneious v5.4. 2011. Auckland (New Zealand):Biomatters, Ltd. [cited 2011 Aug 3]. Available from: http://www.geneious.com/ [Google Scholar]
- Edgar RC. MUSCLE: multiple sequence alignment with high accuracy and high throughput. Nucleic Acids Res. 2004;32:1792–1797. doi: 10.1093/nar/gkh340. [DOI] [PMC free article] [PubMed] [Google Scholar]
- Felsenstein J. Cases in which parsimony and compatibility methods will be positively misleading. Syst Zool. 1978;27:401–410. [Google Scholar]
- Felsenstein J. PHYLIP (phylogeny inference package) version 3.6. 2004. Distributed by the author. Seattle (WA): Department of Genome Sciences, University of Washington. [Google Scholar]
- Finet C, Timme RE, Delwiche CF, Marletaz F. Multigene phylogeny of the green lineage reveals the origin and diversification of land plants. Curr Biol. 2010;20:2217–2222. doi: 10.1016/j.cub.2010.11.035. [DOI] [PubMed] [Google Scholar]
- Foster PG. Modeling compositional heterogeneity. Syst Biol. 2004;53:485–495. doi: 10.1080/10635150490445779. [DOI] [PubMed] [Google Scholar]
- Goremykin VV, Hirsch-Ernst KI, Woelfl S, Hellwig FH. The chloroplast genome of Nymphaea alba: whole-genome analyses and the problem of identifying the most basal angiosperm. Mol Biol Evol. 2004;21:1445–1454. doi: 10.1093/molbev/msh147. [DOI] [PubMed] [Google Scholar]
- Goremykin VV, Nikoforova SV, Bininda-Emonds OPP. Automated removal of noisy data in phylogenomic analyses. J Mol Evol. 2010;71:319–331. doi: 10.1007/s00239-010-9398-z. [DOI] [PubMed] [Google Scholar]
- Gruenheit N, Lockhart PJ, Steel M, Martin W. Difficulties in testing for covarion-like properties of sequences under the confounding influence of changing proportions of variable sites. Mol Biol Evol. 2008;25:1512–1520. doi: 10.1093/molbev/msn098. [DOI] [PubMed] [Google Scholar]
- Guindon S, et al. New algorithms and methods to estimate maximum-likelihood phylogenies: assessing the performance of PhyML 3.0. Syst Biol. 2010;59:307–321. doi: 10.1093/sysbio/syq010. [DOI] [PubMed] [Google Scholar]
- Hansmann S, Martin WT. Phylogeny of 33 ribosomal and six other proteins encoded in an ancient gene cluster that is conserved across prokaryotic genomes: influence of excluding poorly alignable sites from analysis. Int J Syst Evol Microbiol. 2000;50:1655–1663. doi: 10.1099/00207713-50-4-1655. [DOI] [PubMed] [Google Scholar]
- Hendy M, Penny D. A framework for the quantitative study of evolutionary trees. Syst Zool. 1989;38:297–309. [Google Scholar]
- Huson DH, Bryant D. Application of phylogenetic networks in evolutionary studies. Mol Biol Evol. 2006;23:254–267. doi: 10.1093/molbev/msj030. [DOI] [PubMed] [Google Scholar]
- Jermiin LS, Ho SYW, Ababneh F, Robinson J, Larkum AWD. The biasing effect of compositional heterogeneity on phylogenetic estimates may be underestimated. Syst Biol. 2004;53:638–643. doi: 10.1080/10635150490468648. [DOI] [PubMed] [Google Scholar]
- Lanave C, Preparata G, Sacone C, Serio G. A new method for calculating evolutionary substitution rates. J Mol Evol. 1984;20:86–93. doi: 10.1007/BF02101990. [DOI] [PubMed] [Google Scholar]
- Lartillot N, Lepage T, Blanquart S. PhyloBayes 3: a Bayesian software package for phylogenetic reconstruction and molecular dating. Bioinformatics. 2009;25:2286–2288. doi: 10.1093/bioinformatics/btp368. [DOI] [PubMed] [Google Scholar]
- Lartillot N, Philippe H. A Bayesian mixture model for calculating evolutionary substitution rates. Mol Biol Evol. 2004;21:1095–1109. doi: 10.1093/molbev/msh112. [DOI] [PubMed] [Google Scholar]
- Lockhart PJ, et al. Heterotachy and tree building: a case study with plastids and eubacteria. Mol Biol Evol. 2006;23:40–45. doi: 10.1093/molbev/msj005. [DOI] [PubMed] [Google Scholar]
- Lockhart PJ, Steel MA. A tale of two processes. Syst Biol. 2005;54:948–951. doi: 10.1080/10635150500234682. [DOI] [PubMed] [Google Scholar]
- Lockhart PJ, Steel MA, Hendy MD, Penny D. Recovering evolutionary trees under a more realistic model of sequence evolution. Mol Biol Evol. 1994;11:605–612. doi: 10.1093/oxfordjournals.molbev.a040136. [DOI] [PubMed] [Google Scholar]
- Matsen FA, Steel MA. Phylogenetic mixtures on a single tree can mimic a tree of another topology. Syst Biol. 2007;56:767–775. doi: 10.1080/10635150701627304. [DOI] [PubMed] [Google Scholar]
- Nguyen MAT, Klaere S, von Haeseler A. MISFITS: Evaluating the goodness of fit between a phylogenetic model and an alignment. Mol Biol Evol. 2011;28:143–152. doi: 10.1093/molbev/msq180. [DOI] [PubMed] [Google Scholar]
- Nickrent DL, Parkinson CL, Palmer JD, DuV RJ. Multigene phylogeny of land plants with special reference to bryophytes and the earliest land plants. Mol Biol Evol. 2000;17:1885–1895. doi: 10.1093/oxfordjournals.molbev.a026290. [DOI] [PubMed] [Google Scholar]
- Posada D, Crandall KA. Modeltest: testing the model of DNA substitution. Bioinformatics. 1998;14:817–818. doi: 10.1093/bioinformatics/14.9.817. [DOI] [PubMed] [Google Scholar]
- Rambaut A. Se-Al. Sequence alignment editor v2.0a11. 2002. Edinburgh (UK): Andrew Rambaut. [cited 2011 Aug 15] Available from: http://tree.bio.ed.ac.uk/software/seal/ [Google Scholar]
- Shavit Grievink L, Penny D, Hendy MD, Holland BR. LineageSpecificSeqgen: generating sequence data with lineage-specific variation in the proportion of variable sites. BMC Evol Biol. 2008;8(1):317. doi: 10.1186/1471-2148-8-317. [DOI] [PMC free article] [PubMed] [Google Scholar]
- Soltis DE, et al. Angiosperm phylogeny: 17 genes, 640 taxa. Am J Bot. 2011;98:704–730. doi: 10.3732/ajb.1000404. [DOI] [PubMed] [Google Scholar]
- Sullivan J, Holsinger KE, Simon C. Among-site variation and phylogenetic analysis of 12s rRNA in sigmodontine rodents. Mol Biol Evol. 1995;12:988–1001. doi: 10.1093/oxfordjournals.molbev.a040292. [DOI] [PubMed] [Google Scholar]
- Swofford DL. PAUP*. Phylogenetic analysis using parsimony (*and other methods). Version 4. Sunderland (MA): Sinauer Associates; 2002. [Google Scholar]
- Tamura K, et al. MEGA5: molecular evolutionary genetics analysis using maximum likelihood, evolutionary distance, and maximum parsimony methods. Mol Biol Evol. 2011;28:2731–2739. doi: 10.1093/molbev/msr121. [DOI] [PMC free article] [PubMed] [Google Scholar]
- Wu C-S, Wang Y-N, Hsu C-Y, Lin C-P, Chaw S-M. doi: 10.1093/gbe/evr095. Forthcoming 2011. Loss of different inverted repeat copies from the chloroplast genomes of Pinaceae and Cupressophytes and influence of heterotachy on the evaluation of gymnosperm phylogeny. Genome Biol Evol. [DOI] [PMC free article] [PubMed] [Google Scholar]
- Wu C-S, Wang Y-N, Hsu C-Y, Lin C-P, Chaw S-M. Loss of different inverted repeat copies from the chloroplast genomes of Pinaceae and Cupressophytes and influence of heterotachy on the evaluation of gymnosperm phylogeny. Genome Biol Evol. doi: 10.1093/gbe/evr095. Advance Access published September 19, 2011, doi:10.1093/gbe/evr095. [DOI] [PMC free article] [PubMed] [Google Scholar]
- Wyman SK, Jansen RK, Boore JL. Automatic annotation of organellar genomes with DOGMA. Bioinformatics. 2004;20:3252–3255. doi: 10.1093/bioinformatics/bth352. [DOI] [PubMed] [Google Scholar]
- Zerbino DR, Birney E. Velvet: algorithms for de novo short read assembly using de Bruijn graphs. Genome Res. 2008;18:821–829. doi: 10.1101/gr.074492.107. [DOI] [PMC free article] [PubMed] [Google Scholar]
- Zhong BJ, Yonezawa T, Zhong Y, Hasegawa M. The position of Gnetales among seed plants: overcoming pitfalls of chloroplast phylogenomics. Mol Biol Evol. 2010;27:2855–2863. doi: 10.1093/molbev/msq170. [DOI] [PubMed] [Google Scholar]


