c-Fos increases the overall synthesis of polyphosphoinositides by an AP-1–independent mechanism involving activation of CDP-diacylglycerol synthase and phosphatidylinositol (PtdIns) 4-kinase II α but not of PtdIns synthase or PtdIns 4-kinase II β. Coimmunoprecipitation and FRET experiments show that c-Fos physically associates only with the enzymes it activates.
Abstract
The oncoprotein c-Fos is a well-recognized AP-1 transcription factor. In addition, this protein associates with the endoplasmic reticulum and activates the synthesis of phospholipids. However, the mechanism by which c-Fos stimulates the synthesis of phospholipids in general and the specific lipid pathways activated are unknown. Here we show that induction of quiescent cells to reenter growth promotes an increase in the labeling of polyphosphoinositides that depends on the expression of c-Fos. We also investigated whether stimulation by c-Fos of the synthesis of phosphatidylinositol and its phosphorylated derivatives depends on the activation of enzymes of the phosphatidylinositolphosphate biosynthetic pathway. We found that c-Fos activates CDP-diacylglycerol synthase and phosphatidylinositol (PtdIns) 4-kinase II α in vitro, whereas no activation of phosphatidylinositol synthase or of PtdIns 4-kinase II β was observed. Both coimmunoprecipitation and fluorescence resonance energy transfer experiments consistently showed a physical interaction between the N-terminal domain of c-Fos and the enzymes it activates.
INTRODUCTION
The protein c-Fos was first described more than 15 years ago as a member of the AP-1 family of inducible transcription factors (Morgan and Curran, 1995). The expression of c-Fos is tightly regulated. It is found at its limit of detection in quiescent cells, whereas its expression is rapidly and transiently induced in cells stimulated to reenter growth (Angel and Karin, 1991; Morgan and Curran, 1995; Caputto and Guido, 2000). c-Fos is a 380–amino acid protein with two well-established domains: the basic domain (BD), spanning from amino acid 139 to 160, and the leucine zipper domain (LZ), from amino acid 165 to 211. The BD domain is responsible for DNA binding, whereas LZ is a leucine-repetition region that allows heterodimerization but not homodimerization of c-Fos with other leucine-zipper proteins such as c-Jun to form AP-1 transcription factors (Angel and Karin, 1991).
Like other transcription factors, c-Fos is imported into the nucleus as an AP-1 dimer (Angel and Karin, 1991; Shaulian and Karin, 2002). However, an increasing number of reports show the presence of c-Fos and of other immediate early genes in the cytoplasm. Cytoplasmic c-Fos is found in stimulated retina ganglion cells (Guido et al., 1996; Bussolino et al., 1998), growing NIH 3T3 cells (Bussolino et al., 2001), frog primary spermatogonia (Cobellis et al., 2002), PC12 cells induced to differentiate (Gil et al., 2004), and tumors of the nervous system (Silvestre et al., 2010). The dependence of proliferation and growth on c-Fos–activated phospholipid synthesis was shown both in culture in differentiating PC12 cells, which require this activation to sustain neurite elongation (Gil et al., 2004), and in vivo for the development of tumors in the central and peripheral nervous system (Silvestre et al., 2010).
The regulation of the activation of phospholipid synthesis by c-Fos is attained at least at two distinguishable levels: One is the very precise regulation the cell imposes on the amount of c-Fos it contains. The other is determined by regulating the association/dissociation state of c-Fos to the endoplasmic reticulum (ER). Only ER-associated c-Fos activates lipid synthesis. In quiescent T98G cells, the very low amounts of c-Fos contained by the cells is phosphorylated on tyrosine residues 10 and 30; in such a condition, c-Fos is dissociated from the ER membranes, and no phospholipid synthesis activation is observed. However, inducing cells to grow promotes abundant c-Fos expression; under these conditions, c-Fos is dephosphorylated, and it associates to ER membranes and activates phospholipid synthesis (Portal et al., 2007). The association of c-Fos to the ER results in the activation of phosphatidic acid phosphatase and lysophosphatidic acid acyl transferase II but not of phosphatidylserine (PtdSer) synthase I or II (de Arriba Zerpa et al., 1999).
Data from our laboratory showed that induction of quiescent fibroblasts to reenter growth promoted an increase in c-Fos expression and a concomitant increase in the labeling of polyphosphoinositides (Bussolino et al., 2001). Consequently, in the present study we first determined that this activation is dependent on c-Fos expression. Then we examined which enzymes of the pathway of synthesis of phosphatidylinositolphosphate (PtdInsP) are activated by c-Fos. Because when activating lipid synthesis c-Fos is found associated to the ER, we also examined whether a physical association is occurring between c-Fos and the enzymes it activates.
Results of experiments of coimmunoprecipitation and fluorescence resonance energy transfer (FRET) reveal that c-Fos associates with the enzymes CDP-diacylglycerol (DAG) synthase (CDS) and phosphatidylinositol (PtdIns) 4-kinase II α (PI4KIIα). On the other hand, no association with and no activation of phosphatidylinositol synthase (PIS) or of PtdIns 4-kinase II β (PI4KIIβ) were observed.
RESULTS
Effect of c-Fos on PtdInsP and phosphatidylinositolbiphosphate synthesis in vivo
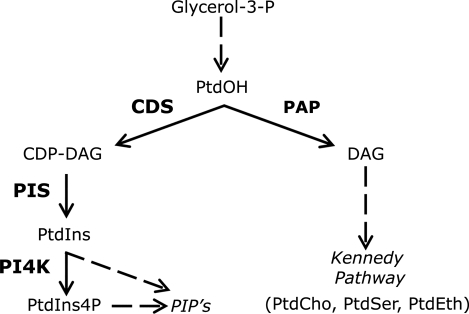
In eukaryotic cells, phospholipid synthesis occurs via two major pathways: one leads to the formation of PtdIns and its phosphorylated derivatives, and the other leads to the formation of phosphatidylethanolamine (PtdEth), phosphatidylcholine (PtdCho), and PtdSer through the Kennedy pathway (Figure 1). As stated previously, we found that induction of quiescent NIH 3T3 fibroblasts to reenter growth concomitantly promoted an increase in the synthesis of the polyphosphoinositides (PtdInsP's) and of c-Fos expression (Bussolino et al., 2001). Thus we first examined whether there is a direct effect of c-Fos expression on the synthesis of polyphosphoinositides. To this end, we determined the synthesis of PtdInsP and phosphatidylinositolbiphosphate (PtdIsP2) in quiescent and growing cells expressing or not expressing c-Fos. As expected, the addition of fetal bovine serum (FBS) to quiescent cell cultures promoted an increase in PtdInsP's labeling and an increase in c-Fos expression (Figure 2). Furthermore, this increase in lipid labeling was dependent on the expression of c-Fos, since specifically blocking its expression by using a c-Fos mRNA antisense oligonucleotide almost completely abrogated the increase in PtdInsP's labeling (Figure 2, A and B).
FIGURE 1:
Pathway of synthesis of PtdInsP. The reactions examined leading to the formation of PtdInsP starting from PtdOH are depicted. Note that PtdOH, in addition to being conveyed to CDP-DAG, can be channeled to DAG and the Kennedy pathway of phospholipid synthesis. Because this pathway is not examined, it was not included in the figure.
FIGURE 2:
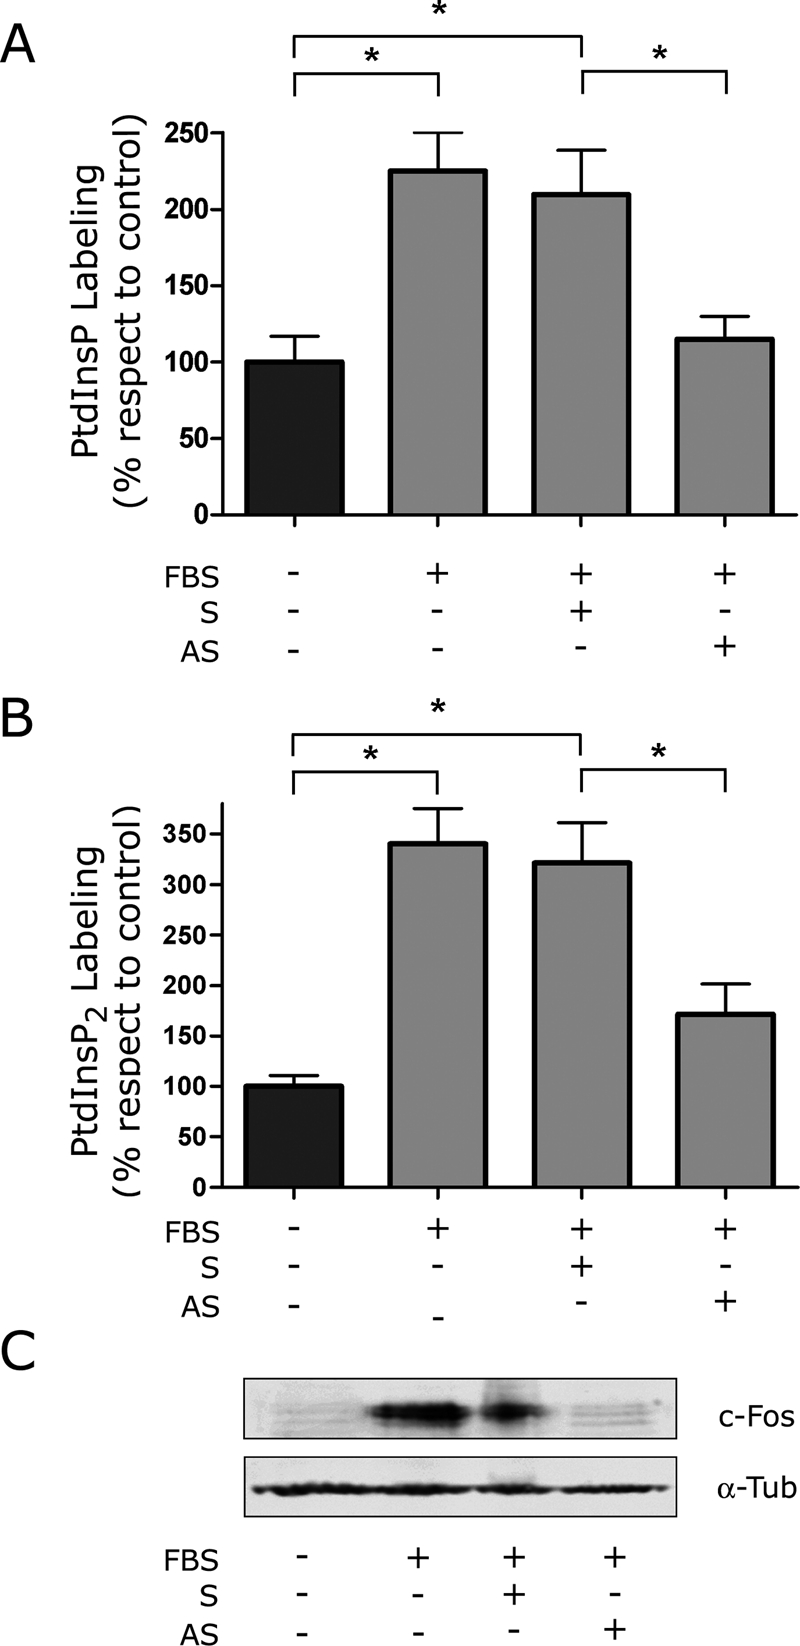
Effect of blocking c-Fos expression on the labeling of PtdInsP and of PtdInsP2 in culture. Quiescent NIH 3T3 cells were pulsed with 32P-orthophosphate 15 min before harvesting. Cells induced to reenter growth were fed with FBS 7.5 min prior to harvesting. c-fos mRNA antisense (AS) or scrambled (S) oligonucleotides (1 μg/ml culture medium) were added to the cultures 30 min prior to addition of 32P-orthophosphate. As a control, cells cultured without FBS were fed AS or S, and in no case were modifications observed in lipid labeling (data not shown). In-culture labeling of PtdInsP (A) or of PtdInsP2 (B) in the presence (+AS) or the absence (−AS) of AS in growing (+FBS) as compared with quiescent (−FBS) cells or to cells cultured with S. Results are the mean of five determinations performed in duplicate ± SD. *p < 0.005 as determined by one-way analysis of variance with Tukey post test. (C) Note the decrease in c-Fos expression after culturing cells in the presence of AS as determined by Western blot for cells used in A and B. Bottom, α-tubulin as a loading control.
Effect of recombinant c-Fos on the activity of PtdInsP's synthesizing enzymes
To obtain information on the mechanism of the c-Fos–promoted activation of polyphosphoinositide synthesis, we directly measured the effect of purified c-Fos on the enzymatic activities of the first three biosynthetic steps in vitro in the presence of exogenous acceptors and the addition or not of c-Fos to the assay. The first step of PtdInsP synthesis in the ER is the conversion of phosphatidic acid (PtdOH) into CDP-DAG, a reaction catalyzed by the enzyme CDS. CDS is a membrane-bound protein highly dependent on Mg2+ (reviewed in Heacock and Agranoff, 1997). The next step is the conversion of CDP-DAG into PtdIns by the enzyme PIS, a small, ER-located, transmembrane enzyme (Antonsson, 1997). The last enzyme examined belongs to the family of PtdIns kinases (PIKs) that phosphorylate the OH of the inositol ring in positions 3, 4, and 5 (Martin, 1998; Balla et al., 2002). Of the different individual kinases described (Balla and Balla, 2006), PI4K is the most abundant.
CDS and PIK but not PIS are activated by c-Fos
Conditions of linearity with the incubation time were established for each reaction using quiescent NIH 3T3 cell homogenate with or without the addition of recombinant c-Fos to the incubates. The purity of the recombinant c-Fos preparation and the optimal concentrations required for activation of each enzyme were also determined (Supplemental Figure S1).
CDS activity assayed using 3H-CTP and dioleoyl-PtdOH as substrates (Lykidis et al., 1997) was linear up to at least 60 min of incubation (Figure 3A). At all times assayed, higher amounts of CDP-DAG were formed in the +Fos as compared with the −Fos assays. PIS enzyme activity was determined in vitro using 3H-myoinositol to label PtdIns. PtdIns formation was linear up to 15 min, the longest time assayed (Figure 3B). Formation of PtdInsP was determined at 25°C; even at that temperature no clear linearity was attained (Figure 3C). In any case, time curves show an increased enzyme activity for CDS (>50%) when assayed in the presence of c-Fos as compared with those in the absence of c-Fos at all times. Essentially the same result was obtained for PIK. By contrast, no differences were observed for PIS activity between +Fos and −Fos assays at any incubation time or after the addition of increasing concentrations of c-Fos to the assays (concentrations assayed varied from 0.5 to 3 ng of c-Fos/μg of quiescent NIH 3T3 cell homogenate protein; Supplemental Figure S1).
FIGURE 3:
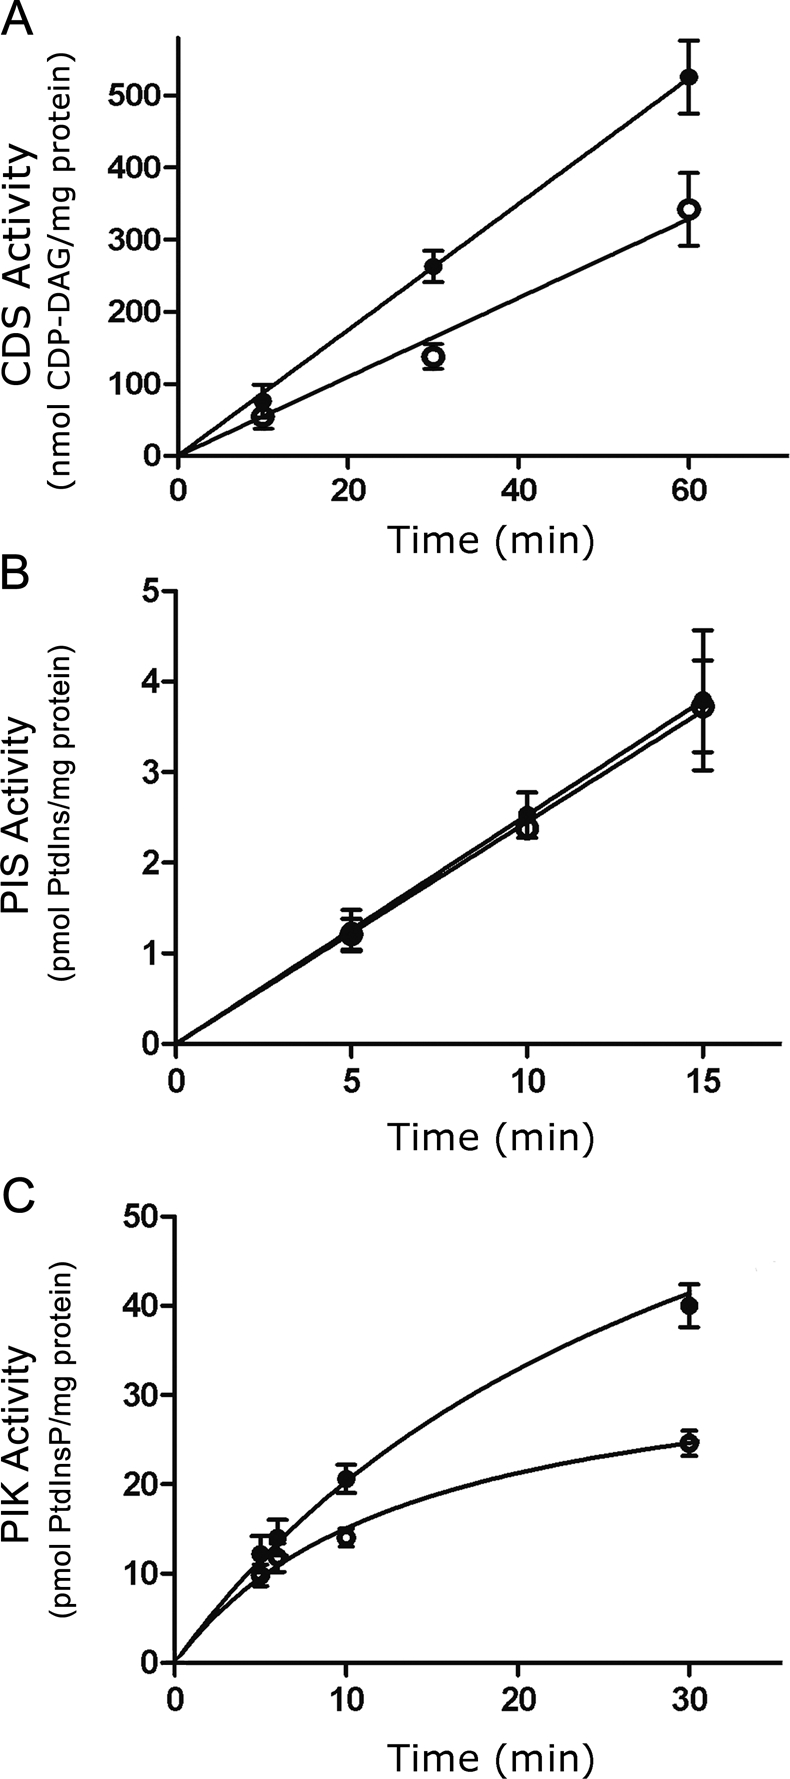
Effect of c-Fos addition on CDS, PIS, and PI4K activities. To establish linear conditions, time curves for the synthesis of CDP-DAG (A), PtdIns (B), and PtdInsP (C) were performed using homogenate prepared from quiescent cells as enzyme source. Assays were performed in the presence or the absence of c-Fos resuspended in elution buffer; an equal volume of elution buffer was added to assays carried out in the absence of c-Fos. (A) Formation of CDP-DAG was measured in the presence (●) or the absence (○) of 0.5 μg of c-Fos/mg of cell homogenate and 3H-CTP. (B) PIS activity for PtdIns formation was measured in the presence (●) or the absence (○) of 1 μg of c-Fos/mg of cell homogenate and 3H-inositol. (C) PIK activity was determined in the presence (●) or the absence (○) of 1 μg of c-Fos/mg of cell homogenate and α-32P-ATP. All results are the mean ± SD of at least two experiments performed in triplicate. Note the increased activity of CDS and PIK in the presence of c-Fos with respect to assays in the absence of c-Fos.
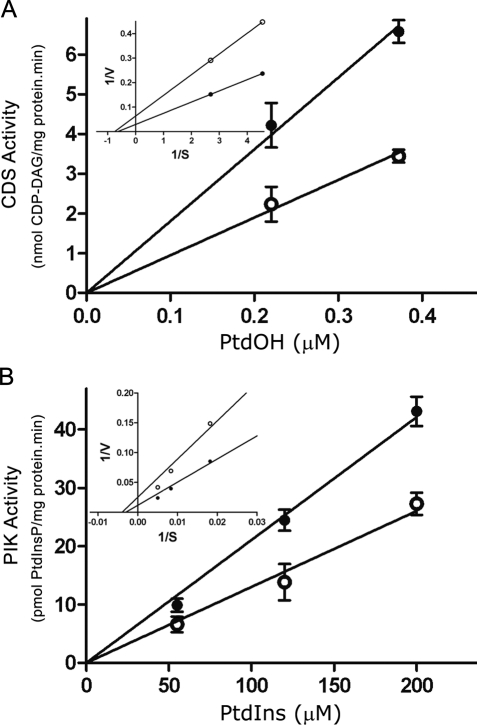
Kinetic parameters (Km and Vmax) for both CDP-DAG and PtdIns synthesis were determined in the presence and the absence of c-Fos. Addition of recombinant c-Fos to the assays results in a significantly higher amount of 3H-CDP–DAG formation at all PtdOH concentrations assayed (Figure 4A). This increase was the result of more than doubling the Vmax of the reaction without substantially modifying the Km for PtdOH (Km: −Fos, 1.33 μM; +Fos: 1.57 μM; Vmax, expressed as nmol/mg protein min: −Fos, 15.75; +Fos, 34.34; Figure 4A, inset).
FIGURE 4:
Kinetic parameters of CDS and PIK in the presence or the absence of c-Fos. Enzyme activities were determined as indicated in Figure 2. (A) For CDS activity, determinations were carried out for 20 min using increasing concentrations of dioleoyl-PtdOH as indicated. (B) PIK activity was determined at 10 min using increasing concentrations of PtdIns as indicated. Results are the mean ± SD of two experiments performed in triplicate. Insets, Lineweaver–Burk plots for Km and Vmax calculations.
As with CDS, the kinetic parameters of PIK also evidenced a similar increase in Vmax with no substantial modification in Km values in the presence or in the absence of c-Fos (Km: −Fos, 253.74 μM; +Fos, 331.01 μM; Vmax, expressed as pmol/mg protein min: −Fos, 3.96; +Fos, 8.53; Figure 4B, inset). It should be noted that the highest amount of c-Fos added to the incubates (1 ng/μg of homogenate protein) corresponds to a concentration of ∼105 molecules of c-Fos/cell. This concentration is comparable to the amount of c-Fos calculated by Kovary and Bravo (1992) to be present in fibroblasts when c-Fos expression is induced (103–105 molecules of c-Fos/cell).
Depressing the expression of CDS1 or PI4KIIα abrogates the activation of PtdInsP and PtdInsP2 labeling promoted by FBS, whereas blocking PI4KIIβ has no effect
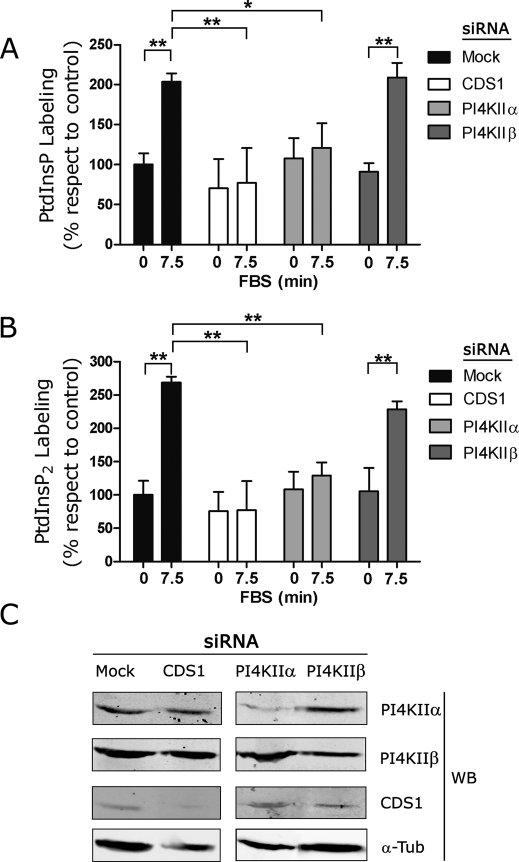
It was considered important to assess the involvement of the enzymes CDS1 and the two type II isoforms of PI4K, PI4KIIα and PI4KIIβ (Tolias and Cantley, 1999; Barylko et al., 2002; Wei et al., 2002; Balla and Balla, 2006), in determining the rate of PtdInsP and PtdInsP2 formation in vivo. For this, we determined the labeling of these lipids in culture in quiescent and growing cells treated with appropriate small interfering RNA (siRNA) to depress the expression of these enzymes as compared with control cells with normal enzyme expression. As expected, the addition of FBS to the control cultures promoted an increase in PtdInsP and PtdInsP2 formation that was abrogated in siRNA-treated cells with depressed CDS1 or PI4KIIα expression (Figure 5, A and B). In contrast, no effect on PtdInsP and PtdInsP2 formation was observed when PI4KIIβ expression was depressed (Figure 5, A and B, last two columns). Figure 5C shows the expression levels of CDS1, PI4KIIα, and PI4KIIβ in the cells treated with siRNA used for Figure 5, A and B. These results highlight the relevance of CDS1 and PI4KIIα in determining c-Fos–dependent PtdInsP and PtdInsP2 synthesis activation.
FIGURE 5:
Effect of depressing the expression of CDS1, PI4KIIα, or PI4KIIβ on PtdInsP and PtdInsP2 labeling in culture. For depressing CDS1, PI4KIIα, or PI4KIIβ expression, cells were fed the corresponding siRNA for 3 d, after which quiescent cells were pulsed with 25 µCi/ml of 32P-orthophosphate for 15 min. Cells were stimulated to grow by the addition of FBS to the culture medium or maintained quiescent (in the absence of FBS); at 7.5 min after FBS addition, quiescent and growing cells were harvested and labeling in PtdInsP and PtdInsP2 determined. (A) PtdInsP labeling and (B) PtdInsP2 labeling in culture in growing cells (+FBS 7.5 min) as compared with quiescent cells mock transfected (black) or transfected with the appropriate siRNA to depress the expression of CDS1 (white), PI4KIIα (light gray), or PI4KIIβ (dark gray) as indicated. Results are the mean of two independent experiments ± SD. *p < 0.05, **p < 0.01, as determined by two-way analysis of variance with Bonferroni post test. In addition, cells transfected with nontargeting siRNA were examined, and no difference with respect to mock-transfected cells was observed (data not shown). (C) Cells mock transfected (first column) or transfected to depress the expression of CDS1 (second column), PI4KIIα (third column), or PI4KIIβ (last column) were subjected to Western blot to determine the expression levels of PI4KIIα (first row), of PI4KIIβ (second row), or of CDS1 (third row). The last row shows α-tubulin used as a loading control. Note the decrease in the expression of the enzymes present in cells used in A and B after culturing in the presence of the corresponding siRNA.
CDS and PI4KIIα but not PIS or PI4KIIβ participate in a physical association with c-Fos
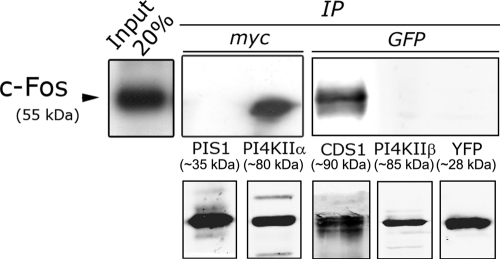
The experiments previously described raised the question of whether c-Fos and the enzymes it activates form physical associations to attain the activated state of these enzymes. To examine this possibility, coimmunoprecipitation (coIP) assays were performed with homogenates prepared from NIH 3T3 cells transfected to express tagged CDS, PIS, PI4KIIα, or PI4KIIβ. Figure 6 (top) shows that c-Fos coimmunoprecipitates with CDS and PI4KIIα, whereas no coIP was observed between c-Fos and PIS or PI4KIIβ. Figure 6 (bottom) shows the immunoprecipitate obtained for each enzyme. Taken together, the activation of CDS and PI4K activities by c-Fos and the coIP of CDS and PI4K with c-Fos suggest that c-Fos is specifically modulating these enzymes through a direct or an indirect physical interaction.
FIGURE 6:
CDS and PI4KIIα but not PIS1 or PI4KIIβ coimmunoprecipitate c-Fos. Lysates from quiescent cells transfected with peYFPC1-CDS1, peYFPN1-PI4KIIß, pcDNA3.1 myc-His-PIS1, or pcDNA3.1 myc-His-PI4KIIα were immunoprecipitated using mouse anti-GFP (Roche) or mouse anti-myc (Sigma) antibodies, as indicated. Immunocomplexes were analyzed by SDS–PAGE followed by Western blotting with rabbit anti-c-Fos antibody (top). Bottom, the immunoprecipitates obtained for each enzyme examined using rabbit anti-GFP (Sigma) or rabbit anti-myc (Santa Cruz Biotechnology) antibodies. Left, Western blotting of c-Fos input (20%).
Examination of molecular proximity by microscopic FRET
To further examine a possible participation of c-Fos in a physical interaction with particular phospholipid-synthesizing enzymes as suggested by the kinetics and coIP experiments, we looked at this by a different approach: microscopic FRET. FRET increases the resolution of conventional fluorescence microscopy to the molecular level, allowing quantitative examination of protein–protein interactions based on nonradiative energy transfer between donor and acceptor molecules. Because FRET depends on proximity, fluorophores must lie within 1–10 nm of each other for energy transfer to occur, a distance range that is typical of protein–protein interaction. This requirement for FRET to take place practically excludes the possibility of a third-party protein being involved (Gordon et al., 1998; Elangovan et al., 2003; Chen et al., 2005; Elder et al., 2009). For FRET examination, a set of plasmids encoding chimeric proteins bearing green fluorescent protein (GFP) derivatives with spectral overlap (enhanced cyan fluorescent protein [eCFP] and enhanced yellow fluorescent protein [eYFP]) at the N- or C-terminus of c-Fos and the enzymes under examination were used as indicated in each case.
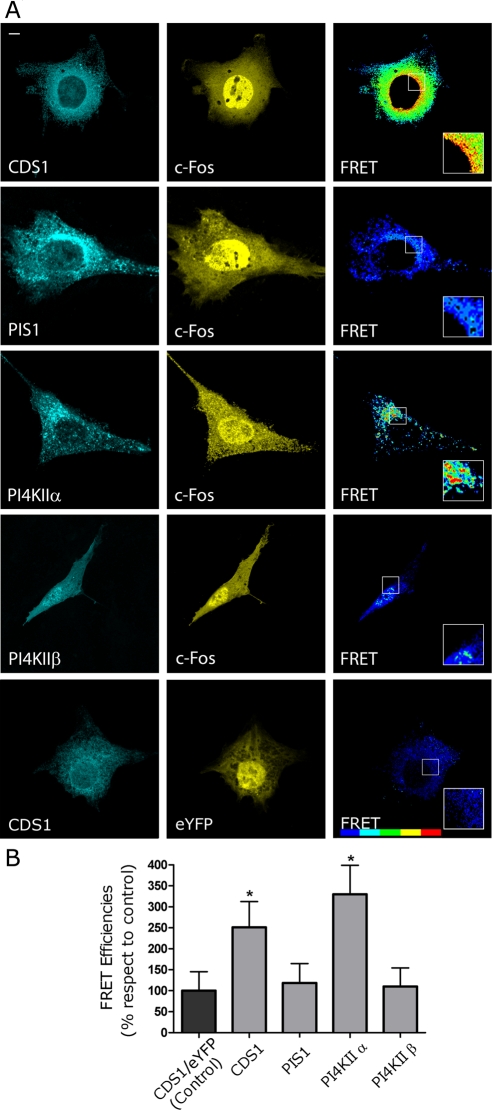
Figure 7A shows the subcellular distribution of the coexpressed chimeras under study (left and middle). FRET images are shown on the right, using a blue-to-red increasing scale of FRET efficiency. It is clear from the FRET images in Figure 7A (right) that positive values are produced between eYFP-c-Fos and eCFP-CDS1 (top row) and between eYFP-c-Fos and eCFP-PI4KIIα (third row), whereas no positive FRET was found between c-Fos-eYFP and eCFP-PIS1 (second row) or between eYFP-c-Fos and eCFP-PI4KIIβ (fourth row). Figure 7B shows the quantification of FRET efficiencies for each case: the enzymes activated by c-Fos, that is, CDS and PI4KIIα, show statistically significant FRET efficiency values, whereas the values obtained between c-Fos and enzymes not activated by this protein (see Figures 4 and 6) were comparable to a control pair of chimeras that does not show FRET (cotransfection of eCFP-CDS1 and eYFP shown in the last row of Figure 7A and quantified in the first column of Figure 7B).
FIGURE 7:
CDS and PI4KIIα but not PIS1 or PI4KIIβ undergo FRET with c-Fos. (A) Cells cotransfected to express eYFP-c-Fos and eCFP-CDS1 (first row), eCFP-PIS1 (second row), eCFP-PI4KIIα (third row), or eCFP-PIKIIβ (fourth row) were examined by confocal microscopy using filters for eCFP (left) or for eYFP (middle). FRET efficiency images were obtained and pseudocolored using PFRET software (Elangovan et al., 2003; Chen et al., 2005) (right). The last row shows control cells coexpressing CDS1-eCFP and eYFP. (B) Mean FRET efficiencies ± SD for the donor/acceptor pairs shown in A. Results obtained after the examination of 50 cells in each case are from one representative experiment out of at least three performed. *p < 0.001 as determined by one-way analysis with Dennett's post test. Bar, 5 μm. FRET bar shown on the right corresponds to a blue-to-red increasing scale of FRET efficiency.
BD of c-Fos is responsible for phospholipid synthesis activation
In previous studies it was found that only the deletion mutants of c-Fos that contain its N-terminus plus its BD, that is, amino acids 139–160, efficiently activate phospholipid synthesis (Gil et al., 2004). To examine whether BD is required for PtdInsP and PtdInsP2 synthesis activation, the ability of c-Fos and diverse c-Fos mutants to activate the production of these lipids was assayed. The mutants tested were NA (amino acids [aa] 1–139 of full-length c-Fos), NB (aa 1–160 of full-length c-Fos that includes BD), ΔBD (full-length c-Fos in which only BD was deleted), and the deletion mutant containing amino acid 165 to the C-terminus of c-Fos (LZC). A schematic representation of the mutants examined is shown in Figure 8C. As predicted, NA, ΔBD, and LZC (all devoid of BD) have no capacity to activate PtdInsP or PtdInsP2 synthesis, whereas NB has a capacity similar to that of c-Fos to promote PtdInsP and PtdInsP2 activation (Figure 8, A and B).
FIGURE 8:
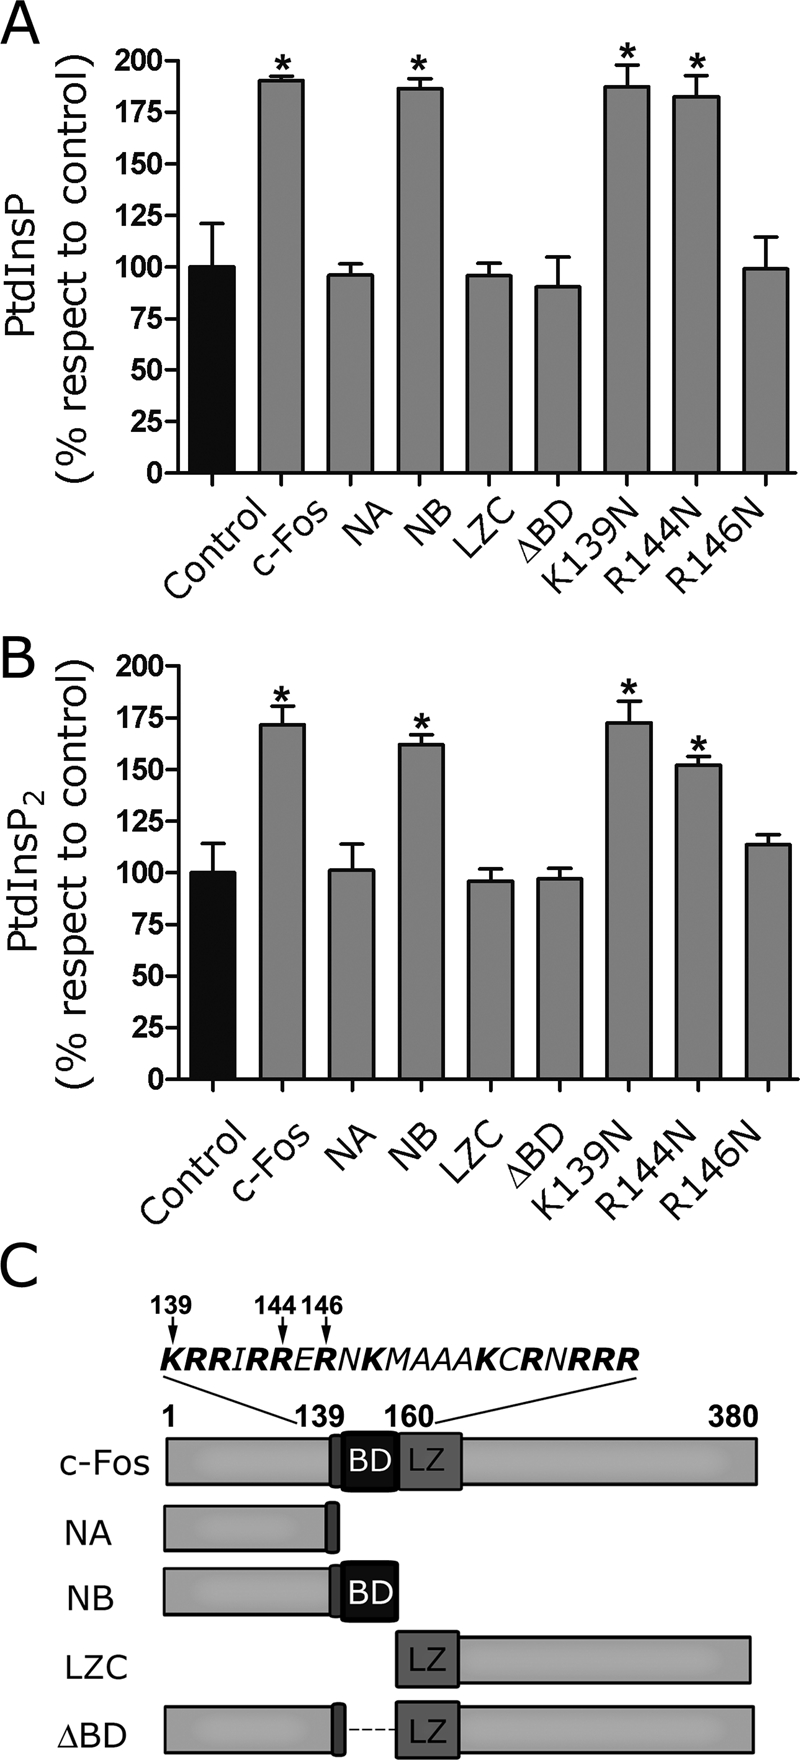
In vitro PtdInsP and PtdInsP2 synthesis activation by c-Fos or c-Fos mutants. (A) PtdInsP and (B) PtdInsP2 labeling was determined in vitro in the presence of c-Fos or its deletion mutants NA, NB, LZC, and ΔBD or its point-mutated versions K139N, R144N, and R146N resuspended in elution buffer to a final concentration of 1 ng/μg cell homogenate protein and 32P-ATP. Control assays received an equal volume of elution buffer. Results are the mean ± SD of three experiments performed in duplicate. *p < 0.01 as determined by one-way analysis of variance with Dennett's post test. (C) Schematic representation of the c-Fos mutants used in A and B and/or for Figure 9. Note the relevance of BD for lipid synthesis activation.
Of the 21 amino acids contained in BD, 12 are basic ones (schematic representation shown in Figure 8C). It was also deemed of interest to determine whether all basic amino acids are required to promote lipid synthesis activation or only some of these participate in the structural requirements relevant for activation. Consequently, different versions of full-length c-Fos, point mutated in one basic amino acid contained in BD, were generated, recombinant protein purified, and assayed for phospholipid synthesis–activating capacity. Figure 8A shows that substitutions K139N and R144N do not modify the activating capacity of c-Fos. Surprisingly, the substitution R146N completely abolishes it, pointing to the relative position of this basic residue as critically relevant to confer an appropriate structure for enzyme activation.
The N-terminus of c-Fos associates to the enzymes it activates
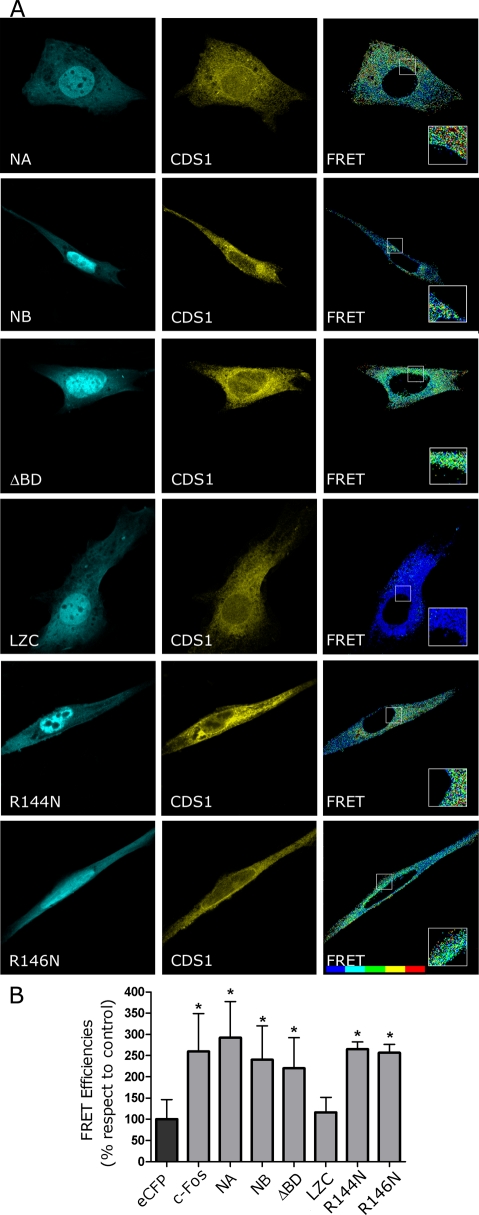
Next we examined by FRET the association capacity of CDS (one of the positive interacting enzymes with wild-type c-Fos) with the following set of c-Fos mutants fused to eCFP: ΔBD; the deletion mutant NA, which does not contain BD and does not activate PtdInsP or PtdInsP2 synthesis; the deletion mutant NB, which includes BD and activates PtdInsP and PtdInsP2 synthesis; the BD point-mutated versions of full-length c-Fos, R144N (which activates PtdInsP and PtdInsP2 synthesis) and R146N (which does not show activating capacity), and LZC, which contains the C-terminus of c-Fos and does not activate lipid synthesis (Figure 8, A–C).
Cells were double transfected to express eYFP-CDS and the corresponding c-Fos mutant under study. Figure 9A shows the subcellular distribution for the c-Fos mutants, which, as shown in Figure 7A, were similar to that of c-Fos, although the fluorescent tag in this case was eCFP. Examination by FRET showed that c-Fos, NA, NB, ΔBD, R144N, and R146N physically associate with CDS (Figure 9B). In contrast, LZC, the only mutant assayed that is devoid of the N-terminus of c-Fos, did not show positive FRET, indicating its lack of association to CDS.
FIGURE 9:
c-Fos mutants undergo FRET with CDS irrespective of containing or not containing c-Fos BD domain. (A) Cells cotransfected to express eYFP-CDS and the deletion mutants eCFP-NA (first row), eCFP-NB (second row), or eCFP-ΔBD (third row), the deletion mutant LZC (fourth row), or the point-mutated versions of c-Fos eCFP-R144N (fifth row) or eCFP-R146N (bottom row) were examined by confocal microscopy using filters for eCFP (left) or for eYFP (middle). FRET efficiencies images were obtained and pseudocolored using PFRET software (Elangovan et al., 2003; Chen et al., 2005) (right). (B) Mean FRET efficiencies ± SD for the donor/acceptor pairs shown in A. Results obtained after the examination of 50 cells in each case are from one representative experiment out of at least three performed. *p < 0.001 determined by one-way analysis of variance with Dennett's post test. Bar, 5 μm. FRET bar shown on the right corresponds to a blue-to-red increasing scale of FRET efficiency. Note that LZC, the deletion mutant lacking the N-terminus domain of c-Fos, fails to show association with CDS.
It is interesting to note that, in spite of the fact that both NA and NB maintain a similar capacity to associate to CDS, only the BD-containing mutant NB is capable of activating lipid synthesis. Thus the simplest interpretation of these results is that c-Fos associates to the enzymes by its N-terminus (Figure 9), whereas activation is accomplished through its BD domain (Figure 8).
DISCUSSION
Even if an overall twofold increase in the activity of the enzymes CDS and PI4KIIα described may seem at first sight small, it should be noted that c-Fos also promotes the activation of the structural phospholipids (Bussolino et al., 2001) and glycolipids (Crespo et al., 2008). Furthermore, this phospholipid synthesis activation promoted by c-Fos has been shown to be highly relevant for cellular processes that demand high rates of membrane biogenesis. Such is the case for cell proliferation and growth. In PC12 cells induced to differentiate with nerve growth factor (NGF), c-Fos–activated phospholipid and glycolipid synthesis is required for neurite elongation: blocking of c-Fos expression results in growth arrest together with the retraction of preformed neurites; in contrast, in primed cells, the sole expression of c-Fos or of c-Fos–deletion mutants that activate phospholipid synthesis sustain neurite outgrowth in the absence of NGF. c-Fos mutants that do not activate lipid synthesis do not sustain neurite growth either. It is interesting to underscore that in no case could lipid synthesis activation be evidenced with c-Jun, another member of the immediate early gene that forms homodimer or heterodimer AP-1 transcription factors with immediate early c-Fos (Kovary and Bravo, 1992); c-Jun was tested up to three times the concentration required for c-Fos–dependent activation of phospholipid synthesis and even so failed to show lipid synthesis activation (Gil et al., 2004).
Another example that highlights the biological relevance of c-Fos–dependent lipid synthesis activation was observed in peripheral and CNS malignant tumor cells. These cells undergo the exacerbated growth characteristic of tumor cells. In 100% of the 156 human malignant tumor specimens examined, c-Fos was found highly expressed and associated to ER components. c-Fos also activates phospholipid synthesis in all fresh human brain tumor specimens examined (Silvestre et al., 2010). In culture, no proliferation of these tumor cells is observed if c-Fos expression is blocked (Portal et al., 2007). In an animal model of neurofibromatosis type I—the NPcis mouse, which spontaneously develops tumors of the CNS and the peripheral nervous system with a 100% penetrance—tumor development depends on c-Fos expression: no tumor development is found in NPcis mice knocked out for c-Fos, in contrast with the tumor burden found in 71.4% of their NPcis littermates. Furthermore, treatment of NPcis mice intracranially or of malignant tumors of the peripheral nervous system with c-Fos antisense oligonucleotide blocks c-Fos–activated phospholipid synthesis and cell proliferation. In no case were significant modifications observed in the AP-1 content of these tissue samples (Silvestre et al., 2010).
On the other hand, knowledge of the biosynthesis and metabolism of PtdIns and its phosphorylated derivatives are of interest not only due to its structural role in cell membranes but also in terms of the participation of these lipids in key cellular events and the many diseases that result from mutations in genes encoding phosphoinositide-metabolizing enzymes (McCrea and De Camilli, 2009). Despite their importance, little is known about the fine regulation of the synthesis of these lipids. The present work proposes a novel mechanism mediated by c-Fos that regulates the entire pathway of PtdInsP synthesis by regulating key enzymes of the pathway.
Regarding the molecular mechanism by which c-Fos activates the synthesis of lipids, it should be considered that c-Fos is an amphitropic, highly surface-active protein (Borioli et al., 2001). From the present results, it seems reasonable to hypothesize that when c-Fos associates to the ER membranes, the amphitropic interaction may allow a physical interaction between c-Fos and the activated enzymes, promoting an increase in the Vmax of the enzyme to which it associates.
The physical association between the N-terminal domain of c-Fos and the enzymes it activates shown in this work opens the possibility that the enzymes to which c-Fos associates share some yet-unknown structural domain to which it associates. Previous findings indicate that c-Fos also activates the synthesis of glycolipids in a similar way to that observed for phospholipids: c-Fos activates the formation of glucosylceramide, the first glycosylated intermediate in the pathway of glycolipid synthesis, which results in a global stimulation of the synthesis of most glycolipids. Again, only a particular enzyme of this pathway is regulated by c-Fos: ceramide glucosyl transferase but not sialyl- or galactosyl-transferases. It is worth underscoring that, as found for CDS and PI4K, the Vmax but not Km of the enzyme ceramide glucosyl transferase is increased by c-Fos (Crespo et al., 2008). c-Fos is emerging as a cytoplasmic effector that regulates the overall production of lipids by its association to the ER membranes and activation of key enzymes.
The experimental data presented strongly support a physical association between c-Fos and the enzymes it is capable of activating. It will be interesting to direct future studies toward determining whether the Kennedy pathway of phospholipid synthesis, which is also activated by c-Fos (Bussolino et al., 2001), shares the mechanism described in this study for the activation of PtdInsP's to achieve activation. If so, the knowledge of the precise molecular mechanism involved will undoubtedly facilitate rational intervention in cellular lipid metabolism.
MATERIALS AND METHODS
Materials
NIH 3T3 mouse fibroblasts were purchased from the American Type Culture Collection (Bethesda MD). Radioactive materials (3H-inositol, specific activity, 21 Ci/mmol; α-3H-CTP, specific activity, 20 Ci/mmol; 32P-orthophosphoric acid, specific activity, 8500 Ci/mmol; and γ-32P-ATP, specific activity, 3000 Ci/mmol) were purchased from PerkinElmer (Waltham, MA). Biotinylated antibodies were purchased from Vector Labs (Burlingame, CA), mouse anti-myc and anti–α-tubulin monoclonal and rabbit anti-GFP and anti–c-Fos polyclonal antibodies, DMEM, and cycloheximide were from Sigma-Aldrich (St. Louis, MO), rabbit anti-CDS1, anti-PI4KIIα and anti-PI4KIIβ polyclonal antibodies were from Abcam (Cambridge, MA), rabbit anti-myc was from Santa Cruz Biotechnology (Santa Cruz, CA), anti-GFP mouse monoclonal antibody and Protease Inhibitor Cocktail were from Roche (Indianapolis, IN), and streptavidin–horseradish peroxidase (HRP) conjugate, Protein G Sepharose, and ECL Plus were from GE Healthcare (Piscataway, NJ). siRNA duplexes ON-TARGET Plus targeting mouse CDS1, PI4KIIα, and PI4KIIβ were from Dharmacon (Lafayette, CO). Fetal bovine serum and Lipofectamine 2000 were from Invitrogen (Carlsbad, CA). HisBind affinity column and pET15b were purchased from Novagen (Gibbstown, NJ), peCFP-C1 from Clontech (Mountain View, CA), pGEM-T Easy from Promega (Madison, WI), Bradford assay from Bio-Rad (Hercules, CA), and Prolong Antifade Gold from Molecular Probes (Invitrogen).
Experimental procedures
Cell cultures.
NIH 3T3 mouse fibroblasts were grown at 37°C in 5% CO2 in DMEM and 10% fetal bovine serum.
For establishing quiescence, cells were arrested in serum-free DMEM for 48 h. Then cells were washed twice with chilled phosphate-buffered saline (PBS), harvested, and homogenized by sonication in ultrapure Milli-Q water (Millipore, Billerica, MA), and finally protein concentration was determined by Bradford assay.
For siRNA, immunoprecipitation, and FRET assays, cells were transiently transfected using Lipofectamine 2000, following the manufacturer's protocol, in serum-free DMEM. After transfection, cells were arrested during 48 h in DMEM prior to stimulating them for the indicated times with DMEM supplemented with 20% FBS.
Expression and purification of recombinant proteins.
Histidine (His)-tagged c-Fos was obtained from the p6Hisfos vector, which encodes an optimized sequence for c-Fos expression in prokaryotes (Abate et al., 1991). Truncated constructs were prepared using full-length c-Fos cDNA with oligonucleotides specifically designed for this purpose using the “overlap extension” PCR technique (Higuchi et al., 1988). Final PCR products were cloned in pGEM-T Easy and subcloned in the prokaryote expression vector pET15b using the NdeI and EcoRI sites of the polylinker sequence of the vector. Recombinant proteins were synthesized as His-tagged proteins in BL21 strain of Escherichia coli as described previously (Borioli et al., 2001). The crude extracts were passed through a HisBind affinity column. After washing thoroughly, proteins were eluted in 100 mM Tris-HCl, pH 7.9, 500 mM imidazole/8 M urea buffer (elution buffer), and protein concentration was determined by Bradford assay.
Metabolic labeling of PtdInsP and PtdInsP2.
Quiescent cells were pulsed with 25 μCi/ml of 32P-orthophosphate 15 min before harvesting. c-fos mRNA antisense (5′-TGC-GTT-GAA-GCC-CGA-GAA-3′) or scrambled oligonucleotide (1 μg/ml culture medium) was added to the medium 30 min prior to radiolabeling (Bussolino et al., 2001). siRNA duplexes were used to depress the expression of targeted enzymes. In all cases, 240 pmol of total siRNA was added per well of a six-well plate. After 24 h, cells were transfected a second time in the same manner and were cultured for an additional 48 h in serum-free DMEM before performing the metabolic labeling. Cell harvesting and determination of 32P-PtdInsP and 32P-PtdInsP2 radioactivity were as described previously (Bussolino et al., 2001). To correct for possible differences in cell number in siRNA assays, a matched, nonradiolabeled well was grown in parallel, which was used for Western blot and densitometry for α-tubulin.
In vitro PtdInsP and PtdInsP2 labeling.
The 32P-PtdInsP and 32P-PtdInsP2 labeling capacity of quiescent cells was determined in vitro as described previously (Gil et al., 2004). Briefly, reactions were initiated by the addition of 100 μg of cell homogenate to the assay medium containing the indicated amount of recombinant c-Fos protein or its specified mutants suspended in 3 μl of elution buffer. 32P-PtdInsP and 32P-PtdInsP2 quantification was performed as described previously (Bussolino et al., 2001); assays were performed in duplicate.
Enzyme activity determinations.
All reactions were performed in 80 μl of final volume containing 100 μg of quiescent cell homogenate protein as the enzyme source. Conditions of linearity with time and protein concentration were determined for each enzyme with the stated amount of recombinant c-Fos suspended in 3 μl of elution buffer or an equal volume of elution buffer for control reactions. Total CDS activity was assayed as described by Lykidis et al. (1997). The reaction was started by the addition of 10 mM MgCl2, and assays were incubated at 37°C for the indicated times. For total PIS activity, the reaction was carried out as described previously (Lykidis et al., 1997). The reaction was carried out at 37°C for the indicated times. PIK activity was assayed according to Wong et al. (1997). Assays were incubated at 25°C for the indicated times.
Immunoprecipitation assays.
These assays were performed as described in Bonifacino and Dell'Angelica (2001) under nondenaturing conditions. Briefly, NIH 3T3 cells were transfected with the following plasmids: CDS1 and PI4KIIβ cloned into peYFP-C1; and PIS1 and PI4KIIα cloned into pcDNA3.1 myc-His C. After establishment of quiescence, cells were stimulated with 20% FBS for 7.5 min, harvested, and lysed in nondenaturing lysis buffer (1% Triton X-100, 50 mM Tris, pH 7.5, 150 mM NaCl, 0.5 mM EDTA) with complete Protease Inhibitor Cocktail. Lysates were preabsorbed with 10 μl of Protein G Sepharose (GE Healthcare) for 1 h and centrifuged at 4°C for 15 min at 16,000 × g. Protein complexes in the supernatant were immunoprecipitated using 25 μl of Protein G Sepharose beads coupled to 1 μg of mouse anti-myc or anti-GFP monoclonal antibody. The immunoprecipitates were washed four times with washing buffer (0.1% Triton X-100, 50 mM Tris, pH 7.5, 150 mM NaCl, and Protease Inhibitor Cocktail) and once with 10 mM PBS and analyzed by Western blot.
Western blot analysis.
Total cell lysates and immunoprecipitates were subjected to SDS–PAGE under reducing conditions on 12% polyacrylamide gels and transferred to nitrocellulose membrane as described previously (Gil et al., 2004). Blocked membranes were incubated with the specified primary antibody, washed twice with PBS-Tween, incubated using secondary biotinylated antibodies and streptavidin-HRP conjugate (1:60,000), and finally incubated with streptavidin-peroxidase (1:60,000). Immunoreactive bands were detected as described in the manufacturer's protocol for ECL Plus (GE Healthcare).
FRET analyses.
Cells were seeded onto 24-well tissue culture dishes containing a coverslip and grown to 80–90% confluence at the time of transfection. After transfection, cells were arrested as described. To avoid specific interactions of endogenous c-Fos with the fluorescent proteins, 50 μg/ml cycloheximide was added to the culture medium 1 h prior to inducing cells to reenter growth, as described previously (Gil et al., 2004). Then cells on coverslips were washed with ice-cold PBS and immediately fixed with 4% paraformaldehyde in PBS for 10 min at room temperature; cells were washed three times with PBS and rinsed with Milli-Q water. Coverslips were mounted in 20 μl of Prolong Antifade Gold (Invitrogen) and visualized using an LSM Pascal 5 (Zeiss, Jena, Germany) or an Olympus (Center Valley, PA) FV1000 confocal laser scanning microscope. A plan apochromat 63×, numerical aperture 1.4, oil immersion objective lens zoomed digitally 2× was used.
For FRET determinations, the sensitized emission measurement approach was used (Gordon et al., 1998; Elder et al., 2009). The eCFP (donor) and eYFP (acceptor) chimeric proteins were excited with an argon laser at 458 and 515 nm, respectively. The emission channel was 475–515 nm for the donor and 530–600 nm for the acceptor. Background values were determined independently for each channel from a coverslip with nontransfected cells and then subtracted using ImageJ (National Institutes of Health, Bethesda, MD). Donor spectral bleedthrough and acceptor cross excitation were calculated and corrected from single transfected cells. PFRET software (Elangovan et al., 2003; Chen et al., 2005) was used to obtain the mean FRET efficiencies values (%E) within a cell on a pixel-by-pixel basis. The algorithm used allows exclusion from saturated pixels and other subcellular regions that do not pass defined thresholds of fluorescence intensity (e.g., cell nucleus). Thus the separation of signal-containing pixels from the background pixels for the FRET calculation can be achieved and makes possible the analysis of signals that arise from noncontinuous compartments such as the endoplasmic reticulum. PFRET also generates a %E image that indicates the intensity of the calculated FRET, where the pixel value in the %E image represents the FRET efficiency value. The resulting image is then pseudocolored to better illustrate the distribution of the calculated efficiencies in the cell.
Acknowledgments
We thank T. Curran, University of Pennsylvania School of Medicine (Philadelphia, PA) for full-length c-Fos cDNA and S. Jackowski, St. Jude Children's Research Hospital (Memphis, TN) for the plasmids pPJ20 (containing human CDS1 cDNA) and pPJ28 (containing the human PIS1 cDNA). We also thank H. Maccioni for helpful discussions, Guillermo Gomez and Gabriel Ferrero for help with FRET studies and artwork, respectively, and Susana Deza and Gabriela Schachner for excellent technical assistance. This work was supported by grants from the Agencia Nacional de Promoción Científica y Tecnológica, Secretaría de Ciencia, Tecnología e Innovación Productiva de Argentina, Consejo Nacional de Investigaciones Científicas y Técnicas (CONICET), Secretaría de Ciencia y Tecnología, Universidad Nacional de Cordoba, Ministro de Ciencia y Tecnología de la Provincia de Córdoba, Argentina, and the James S. McDonnell Foundation. B.L.C. is a Career Member and A.C.G. a Fellow of CONICET.
Abbreviations used:
- aa
amino acids
- BD
basic domain (amino acids 139–160) of c-Fos
- CDP-DAG
CDP-diacylglycerol
- CDS
CDP-diacylglycerol synthase
- ΔBD
full-length c-Fos lacking basic domain (amino acids 139–160)
- eCFP
enhanced cyan fluorescent protein
- ER
endoplasmic reticulum
- eYFP
enhanced yellow fluorescent protein
- GFP
green fluorescent protein
- LZC
deletion mutant containing amino acid 165 to the C-terminus of c-Fos
- NA
deletion mutant of c-Fos containing amino acids 1–139
- NB
deletion mutant of c-Fos containing amino acids 1–160
- NGF
nerve growth factor
- PIS
phosphatidylinositol synthase
- PI4KIIα
phosphatidylinositol 4-kinase II α
- PI4KIIβ
phosphatidylinositol 4-kinase II β
- PtdCho
phosphatidylcholine
- PtdEth
phosphatidylethanolamine
- PtdIns
phosphatidylinositol
- PtdInsP
phosphatidylinositolphosphate
- PtdInsP2
phosphatidylinositolbiphosphate
- PtdOH
phosphatidic acid
- PtdSer
phosphatidylserine
Footnotes
This article was published online ahead of print in MBoC in Press (http://www.molbiolcell.org/cgi/doi/10.1091/mbc.E11-03-0259) on October 12, 2011.
REFERENCES
- Abate C, Luk D, Curran T. Transcriptional regulation by Fos and Jun in vitro: interaction among multiple activator and regulatory domains. Mol Cell Biol. 1991;11:3624–3632. doi: 10.1128/mcb.11.7.3624. [DOI] [PMC free article] [PubMed] [Google Scholar]
- Angel P, Karin M. The role of Jun, Fos and the AP-1 complex in cell-proliferation and transformation. Biochim Biophys Acta. 1991;1072:129–157. doi: 10.1016/0304-419x(91)90011-9. [DOI] [PubMed] [Google Scholar]
- Antonsson B. Phosphatidylinositol synthase from mammalian tissues. Biochim Biophys Acta. 1997;1348:179–186. doi: 10.1016/s0005-2760(97)00105-7. [DOI] [PubMed] [Google Scholar]
- Balla A, Tuymetova G, Barshishat M, Geiszt M, Balla T. Characterization of type II phosphatidylinositol 4-kinase isoforms reveals association of the enzymes with endosomal vesicular compartments. J Biol Chem. 2002;277:20041–20050. doi: 10.1074/jbc.M111807200. [DOI] [PubMed] [Google Scholar]
- Balla A, Balla T. Phosphatidylinositol 4-kinases: old enzymes with emerging functions. Trends Cell Biol. 2006;16:351–361. doi: 10.1016/j.tcb.2006.05.003. [DOI] [PubMed] [Google Scholar]
- Barylko B, Wlodarski P, Binns DD, Gerber SH, Earnest S, Sudhof TC, Grichine N, Albanesi JP. Analysis of the catalytic domain of phosphatidylinositol 4-kinase type II. J Biol Chem. 2002;277:44366–44375. doi: 10.1074/jbc.M203241200. [DOI] [PubMed] [Google Scholar]
- Bonifacino JS, Dell'Angelica EC. Immunoprecipitation. Curr Protoc Cell Biol. 2001 doi: 10.1002/0471143030.cb0702s00. Chapter 7, Unit 7.2. [DOI] [PubMed] [Google Scholar]
- Borioli GA, Caputto BL, Maggio B. c-Fos is surface active and interacts differentially with phospholipid monolayers. Biochem Biophys Res Commun. 2001;280:9–13. doi: 10.1006/bbrc.2000.4081. [DOI] [PubMed] [Google Scholar]
- Bussolino DF, de Arriba Zerpa GA, Grabois VR, Conde CB, Guido ME, Caputto BL. Light affects c-fos expression and phospholipid synthesis in both retinal ganglion cells and photoreceptor cells in an opposite way for each cell type. Brain Res Mol Brain Res. 1998;58:10–15. doi: 10.1016/s0169-328x(98)00065-5. [DOI] [PubMed] [Google Scholar]
- Bussolino DF, Guido ME, Borioli GA, Renner ML, Grabois VR, Conde CB, Caputto BL. c-Fos associates with the endoplasmic reticulum and activates phospholipid metabolism. FASEB J. 2001;15:556–558. doi: 10.1096/fj.00-0446fje. [DOI] [PubMed] [Google Scholar]
- Caputto BL, Guido ME. Immediate early gene expression within the visual system: light and circadian regulation in the retina and the suprachiasmatic nucleus. Neurochem Res. 2000;25:153–162. doi: 10.1023/a:1007508020173. [DOI] [PubMed] [Google Scholar]
- Chen Y, Elangovan M. FRET data analysis: the algorithm. In: Periasamy A, Day RN, editors. Molecular Imaging: FRET Microscopy and Spectroscopy. New York: Oxford University Press; 2005. pp. 126–145. [Google Scholar]
- Cobellis G, Meccariello R, Fienga G, Pierantoni R, Fasano S. Cytoplasmic and nuclear Fos protein forms regulate resumption of spermatogenesis in the frog, Rana esculenta. Endocrinology. 2002;143:163–170. doi: 10.1210/endo.143.1.8567. [DOI] [PubMed] [Google Scholar]
- Crespo PM, Silvestre DC, Gil GA, Maccioni HJ, Daniotti JL, Caputto BL. c-Fos activates glucosylceramide synthase and glycolipid synthesis in PC12 cells. J Biol Chem. 2008;283:31163–31171. doi: 10.1074/jbc.M709257200. [DOI] [PMC free article] [PubMed] [Google Scholar]
- de Arriba Zerpa GA, Guido ME, Bussolino DF, Pasquaré SJ, Castagnet PI, Giusto NM, Caputto BL. Light exposure activates retina ganglion cell lysophosphatidic acid acyl transferase and phosphatidic acid phosphatase by a c-Fos-dependent mechanism. J Neurochem. 1999;73:1228–1235. doi: 10.1046/j.1471-4159.1999.0731228.x. [DOI] [PubMed] [Google Scholar]
- Elangovan M, Wallrabe H, Chen Y, Day RN, Barroso M, Periasamy A. Characterization of one- and two-photon excitation fluorescence resonance energy transfer microscopy. Methods. 2003;29:58–73. doi: 10.1016/s1046-2023(02)00283-9. [DOI] [PubMed] [Google Scholar]
- Elder AD, Domin A, Kaminski Schierle GS, Lindon C, Pines J, Esposito A, Kaminski CF. A quantitative protocol for dynamic measurements of protein interactions by Förster resonance energy transfer-sensitized fluorescence emission. J R Soc Interface. 2009;6:S59–S81. [Google Scholar]
- Gil GA, Bussolino DF, Portal MM, Alfonso Pecchio A, Renner ML, Borioli GA, Guido ME, Caputto BL. c-Fos activated phospholipid synthesis is required for neurite elongation in differentiating PC12 cells. Mol Biol Cell. 2004;15:1881–1894. doi: 10.1091/mbc.E03-09-0705. [DOI] [PMC free article] [PubMed] [Google Scholar]
- Gordon GW, Berry G, Liang XH, Levine B, Herman B. Quantitative fluorescence resonance energy transfer measurements using fluorescence microscopy. Biophys J. 1998;74:2702–2713. doi: 10.1016/S0006-3495(98)77976-7. [DOI] [PMC free article] [PubMed] [Google Scholar]
- Guido ME, de Arriba Zerpa GA, Bussolino DF, Caputto BL. Immediate early gene c-fos regulates the synthesis of phospholipids but not of gangliosides. J Neurosci Res. 1996;43:93–98. doi: 10.1002/jnr.490430112. [DOI] [PubMed] [Google Scholar]
- Heacock AM, Agranoff BW. CDP-diacylglycerol synthase from mammalian tissues. Biochim Biophys Acta. 1997;1348:166–172. doi: 10.1016/s0005-2760(97)00096-9. [DOI] [PubMed] [Google Scholar]
- Higuchi R, Krummel B, Saiki RK. A general method of in vitro preparation and specific mutagenesis of DNA fragments: study of protein and DNA interactions. Nucleic Acids Res. 1988;16:7351–7367. doi: 10.1093/nar/16.15.7351. [DOI] [PMC free article] [PubMed] [Google Scholar]
- Kovary K, Bravo R. Existence of different Fos/Jun complexes during the G0-to-G1 transition and during exponential growth in mouse fibroblasts: differential role of Fos proteins. Mol Cell Biol. 1992;12:5015–5023. doi: 10.1128/mcb.12.11.5015. [DOI] [PMC free article] [PubMed] [Google Scholar]
- Lykidis A, Jackson PD, Rock CO, Jackowski S. The role of CDP-diacylglycerol synthetase and phosphatidylinositol synthase activity levels in the regulation of cellular phosphatidylinositol content. J Biol Chem. 1997;272:33402–33407. doi: 10.1074/jbc.272.52.33402. [DOI] [PubMed] [Google Scholar]
- Martin TFJ. Phosphoinositide lipids as signaling molecules: common themes for signal transduction, cytoskeletal regulation, and membrane trafficking. Annu Rev Cell Dev Biol. 1998;14:231–264. doi: 10.1146/annurev.cellbio.14.1.231. [DOI] [PubMed] [Google Scholar]
- McCrea HJ, De Camilli P. Mutations in phosphoinositide metabolizing enzymes and human disease. Physiology (Bethesda) 2009;24:8–16. doi: 10.1152/physiol.00035.2008. [DOI] [PMC free article] [PubMed] [Google Scholar]
- Morgan JI, Curran T. Immediate-early genes: ten years on. Trends Neurosci. 1995;18:66–67. [PubMed] [Google Scholar]
- Portal MM, Ferrero GO, Caputto BL. N-Terminal c-Fos tyrosine phosphorylation regulates c-Fos/ER association and c-Fos-dependent phospholipid synthesis activation. Oncogene. 2007;26:3551–3558. doi: 10.1038/sj.onc.1210137. [DOI] [PubMed] [Google Scholar]
- Shaulian E, Karin M. AP-1 as a regulator of cell life and death. Nat Cell Biol. 2002;4:E131–E136. doi: 10.1038/ncb0502-e131. [DOI] [PubMed] [Google Scholar]
- Silvestre DC, Gil GA, Tomasini N, Bussolino DF, Caputto BL. Growth of peripheral and central nervous system tumors is supported by cytoplasmic c-Fos in humans and mice. PLoS One. 2010;5(3):e9544. doi: 10.1371/journal.pone.0009544. [DOI] [PMC free article] [PubMed] [Google Scholar]
- Tolias KF, Cantley LC. Pathways for phosphoinositide synthesis. Chem Phys Lipids. 1999;98:69–77. doi: 10.1016/s0009-3084(99)00019-5. [DOI] [PubMed] [Google Scholar]
- Wei YJ, Sun HQ, Yamamoto M, Wlodarski P, Kunii K, Martinez M, Barylko B, Albanesi JP, Yin HL. Type II phosphatidylinositol 4-kinase beta is a cytosolic and peripheral membrane protein that is recruited to the plasma membrane and activated by Rac-GTP. J Biol Chem. 2002;277:46586–46593. doi: 10.1074/jbc.M206860200. [DOI] [PubMed] [Google Scholar]
- Wong K, Meyers R, Cantley LC. Subcellular locations of phosphatidylinositol 4-kinase isoforms. J Biol Chem. 1997;272:13236–13241. doi: 10.1074/jbc.272.20.13236. [DOI] [PubMed] [Google Scholar]


